
Abstract
SUMMARY: Neuroferritinopathy is an autosomal dominant extrapyramidal movement disorder, caused by FTL gene mutations. Iron decreases the MR T2* decay time, therefore increasing the R2* (R2* = 1 /T2*), which correlates with brain tissue iron content. 3T structural and quantitative MR imaging assessment of R2* in 10 patients with neuroferritinopathy demonstrated a unique pattern of basal ganglia cavitation involving the substantia nigra in older patients and increasing thalamic R2* signal intensity detectable during 6 months. Increasing R2* signal intensity in the thalamus correlated with progression on a clinical rating scale measuring dystonia severity. Thalamic R2* signal intensity is a clinically useful method of objectively tracking disease progression in this form of neurodegeneration with brain iron accumulation.
ABBREVIATIONS:
- FTL
- ferritin, light polypeptide
- HDRS
- Huntington's Disease Rating Scale
- NBIA
- neurodegenerative disorders with brain iron accumulation
- PKAN
- pantothenate kinase–associated neurodegeneration
- PLAN
- PLA2G6-associated neurodegeneration
- R2
- T2 relaxation rate
- R2*
- T2* relaxation rate
- UDRS
- Unified Dystonia Rating Scale
- UHDRS
- Unified Huntington's Disease Rating Scale
Neuroferritinopathy is an autosomal dominant extrapyramidal movement disorder caused by mutations in the FTL gene.1 Seven different mutations have been reported globally, with the 460insA mutation in exon 4 being the most frequent,2 and all causing basal ganglia neurodegeneration with intracellular accumulation of iron and ferritin.3,4 The most common presentation of neuroferritinopathy is chorea in midadult life, with most patients developing dystonia as the disease progresses.2 Neuroferritinopathy belongs to a clinically and genetically heterogeneous group of NBIA. There is some clinical overlap between neuroferritinopathy and other NBIA disorders such as PKAN, PLAN, and aceruloplasminemia.5 However, 1.5T brain MR imaging has shown characteristic abnormalities distinguishing neuroferritinopathy from sporadic movement disorders and other genetic subtypes of neurodegeneration with brain iron accumulation. Iron decreases the MR T2 decay time and therefore increases the R2 (R2 = 1 /T2), which correlates with iron content in postmortem brain tissue in healthy controls and in neurologic disease.6⇓⇓⇓⇓–11 The R2*(R2* = 1 /T2*) has been shown to be more sensitive than conventional MR imaging in detecting brain iron accumulation.11 Here we used 3T MR imaging to assess structural changes during a 12-month period on T1 and T2-weighted images and to examine the ability of quantitative R2* (R2* = 1 /T2*) measurement to track iron accumulation in neuroferritinopathy.
Case Series
Ten patients (5 men; mean age, 48.5 years; range, 41–62 years) with the 460insA FTL mutation underwent clinical assessment, by using 2 validated rating scales, the UHDRS for chorea and the UDRS, and MR imaging at baseline, 6 months, and 12 months. All studies were approved by the local ethics committee, and written informed consent was obtained from all participants.
Patients were scanned in a 3T Achieva system (Philips Healthcare, Best, the Netherlands) by using a 6-channel head coil. The protocol comprised the following: 1) conventional T1-weighted imaging (TR/TE, 500/15 ms; 30 × 5 mm sections; 400 × 360 acquired matrix; 240 × 192 mm FOV; scan duration, 4.85 minutes) and T2-weighted imaging (TR/TE, 5875/100 ms; TSE factor, 12; 30 × 5 mm sections; 400 × 360 acquired matrix; 240 × 192 mm FOV; scan duration, 2.45 minutes); 2) a dual-echo TSE sequence (TR/TE1/TE2, 2000/18/80 ms; TSE factor, 10; 30 × 5 mm sections; 400 × 349 acquired matrix; 240 × 192 mm FOV; scan duration, 3.9 minutes), which has been used in other iron storage disorders; and 3) a pair of multiecho sequences to map T2 (spin-echo, 5 echoes; TR/TE, 800/20–100 ms; 5 × 5 mm sections; 256 × 205 acquired matrix; 230 × 162 mm FOV; scan duration, 2.0 minutes) and T2*-weighted imaging (multi-gradient echo; TR, 550 ms; 20 echoes; 1.3-ms spacing; 5 × 5 mm sections; 256 × 201 acquired matrix; 230 × 230 mm FOV; scan duration, 1.9 minutes).
All sections were acquired in an axial-oblique orientation aligned along the axis of the corpus callosum (genu to splenium). Image series were fit by using standard single exponential fitting to create quantitative maps of R2 and R2*. Data were available for comparative purposes from 6 healthy individuals (5 women; mean age, 74 years; range, 68–81 years) scanned by using the same protocol. At follow-up at 6 and 12 months, all previous scans were available to aid with repositioning. Following collection of scout scans, images were carefully positioned by using anatomic landmarks identified on the current and previous scans.
T1 and T2 anatomic scans were rated independently by 2 investigators (A.K. and A.M.). Four target ROIs were manually defined on the anatomic images (posterior rim of the putamen, globus pallidus, caudate, and thalamus) and applied to the quantitative R2* maps to determine mean relaxation times in each area. Figure 1 illustrates how each ROI was defined anatomically. These ROIs are known to be affected in neuroferritinopathy. We did not study other regions, to minimize the chance of false-positive associations through multiple significance testing. R2* levels in each ROI were measured independently by 2 investigators (A.K. at baseline, A.M. at baseline and the second and third time points) by using MRIcro software (http://www.cabiatl.com/mricro). For each ROI, R2* was measured on the right and left sides on 2 axial MR imaging sections, and the mean was calculated. The mean R2* in each brain region was plotted against dystonia and chorea severity scores for each time point. The Pearson correlation (Graphpad, Instat; http://www.graphpad.com/welcome.htm) was used to examine relationships between R2* in the ROI and disease severity scores at baseline. One-way repeated-measures ANOVA (Statistical Package for the Social Sciences; SPSS, Chicago, Illinois) was used to examine any significant alterations in R2* from the ROIs with time, and any significant changes in disease severity scores.

Delineation of ROIs on T2* images. A, Red areas demonstrate delineation of the caudate nucleus. B, Red areas demonstrate delineation of the posterior putamen rim. C, Red areas demonstrate delineation of the thalamus.
Results
Clinical Features and Qualitative Imaging
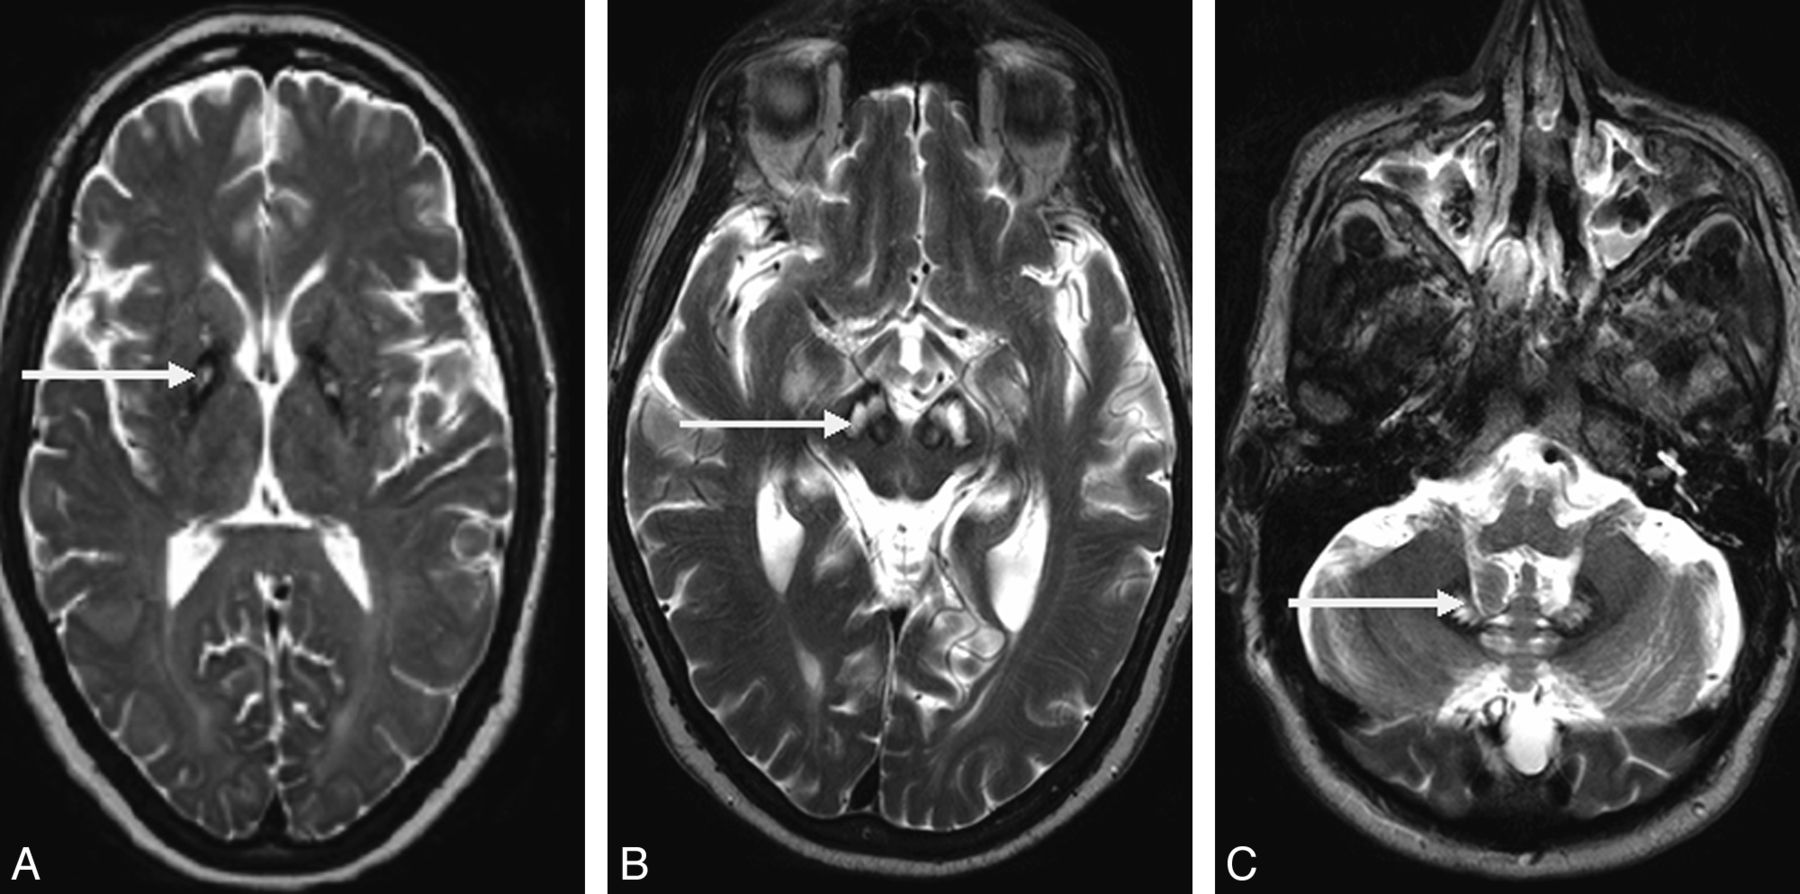
The Table summarizes the demographic details and clinical and radiologic features of the patients studied. Conventional T1- and T2-weighted 3T MR imaging scans demonstrated abnormalities characteristic of neuroferritinopathy (Table). Cases 2 and 4 had areas of medial hyperintensity with surrounding hypointensity in the globus pallidus (Fig 2A), constituting an atypical “eye-of-the-tiger” sign. Novel imaging features of substantia nigra cavitation and dentate nucleus cavitation were identified in cases 10 and 9, respectively (Fig 2B, -C). Older patients generally had more extensive and severe cavitation (Table). All patients older than 50 years of age had cavitation of the globus pallidus and putamen. Additionally 2 patients older than 50 years had bilateral lesions of the substantia nigra, 1 patient older than 50 years had bilateral cavitations of the dentate nucleus, and 1 patient older than 50 years had bilateral cavitations of the head of the caudate nucleus. Only 2 patients younger than 50 years old had fully developed cavitation of the globus pallidus and putamen, and none had substantia nigra, dentate nucleus, or caudate nuclei involvement. There were no discernible structure changes on conventional MR imaging scans obtained 12 months apart.
Demographic, clinical, and T2* MRI features of the neuroferritinopathy cohort

T2* MR imaging findings in neuroferritinopathy. A, Atypical eye-of-the-tiger sign in a 42-year-old woman. Note the area of medial hyperintensity with surrounding hypointensity in the globus pallidus (arrow). B, Cavitation of the substantia nigra in a 58-year-old man (arrow). C, Cavitation of the dentate nucleus in a 62-year-old man (arrow).
Baseline Quantitative Imaging.
At baseline, the thalamic R2* correlated positively with UDRS (r2 = 0.20, P = .0036) but not HDRS (r2 = 0.028, P = .29) and was markedly different from that of controls (data not shown; range, 18.8–27.2 seconds−1, P = .0001). The R2* from the putamen rim correlated inversely with both disease severity scores (UDRS: r2 = 0.16, P = .0082; HDRS: r2 = 0.42, P = .041). The lower R2* scores from the putamen rim in those with high disease-severity scores were associated with cavitation of the putamen. R2* from the caudate nuclei did not correlate with disease rating scores (UDRS: r2 = 0.016, P = .74; HDRS: r2 = 0.166, P = .27). The globus pallidus was found to be extensively cavitated in 5/10 cases and involved by an atypical eye-of-the-tiger sign in 2/10 cases. The associated parenchymal loss prevented baseline or serial assessment of R2* across the whole study group.
Serial Quantitative Imaging.
A 1-way repeated-measures ANOVA was conducted to compare the thalamic R2* scores for the whole group (ie, 40 measurements for each time point being 4 measurements of thalamic R2* for each of 10 patients) at time 1 (baseline), time 2 (6 months), and time 3 (12 months). The means and standard error of thalamic R2* at each time point for the whole group are presented in Fig 3. Thalamic R2* increased with time (Wilks λ = 0.63, F(2, 38) = 11.03, P < .0005; multivariate partial η squared = 0.37), as did the UDRS (Wilks λ = 0.22, F(2, 8) = 14.48, P < .002; multivariate partial η squared = 0.78). The relationship between changes in R2* and UDRS with time was investigated by using the Pearson product-moment correlation coefficient. There was a moderate positive correlation between the 2 variables (r = 0.44, P = .02). There was no alteration in R2* values for the putamen (Wilks λ = 0.97, F(2,23) = 0.27, P = .76; multivariate θ squared = 0.024), caudate (Wilks λ = 0.9, F(2,10) = 0.036, P = .96; multivariate θ squared = 0.002), or HDRS (Wilks λ = 0.35, F(2, 8) = 1.20, P = .35; multivariate partial η squared = 0.23) during the 3 time points.

Serial quantitative MR imaging demonstrates rising thalamic R2* during 3 time points. Thalamic R2* at each time point represents a mean value for the whole group (40 measurements for each time point as 4 measurements for each of 10 patients). A 1-way repeated-measures ANOVA was performed and demonstrated a significant rise in thalamic R2* with time (Wilks λ = 0.63, F (2, 38) = 11.03, P < .0005; multivariate partial η squared = 0.37). Error bars represent standard error of the mean for each time point. Representative colorized serial MR imaging scans from a single individual are presented for each time point. Note the increasing intensity of R2* signal intensity in the thalamus (arrow) during each time point.
Discussion
Although there was no absolute correlation between the extent of basal ganglia cavitation and age or disease duration, individuals older than 50 years of age or with disease duration >10 years tended to have more severe basal ganglia cavitation. However, serial imaging during a 12-month period did not reveal any progressive structural changes such as development or enlargement of cavitated areas. Gross structural change, therefore, developed over decades in neuroferritinopathy, being a marker of late disease. This feature supports the need to develop quantitative imaging markers that track short-term disease progression as a prerequisite for treatment studies. Despite the cavitation in late-stage neuroferritinopathy, we observed that thalamic R2* increases with time in patients with neuroferritinopathy. The thalamus is hypointense in early neuroferritinopathy, representing likely iron accumulation in this structure early in the disease.5 There is no evidence that the rate of iron accumulation is different in early- or late-stage neuroferritinopathy. We thus propose specifically that measuring thalamic R2* may be used as a proxy measure of brain iron accumulation throughout the natural history of neuroferritinopathy.
Applying 3T imaging for the first time revealed novel neuroradiologic features of neuroferritinopathy. In case 10, there was T2 hyperintensity of the substantia nigra with bilateral cavitation observed on T1. This probably reflects cystic degeneration but needs neuropathologic confirmation. A review of PubMed and MEDLINE did not reveal any other reports of substantia nigra cavitation, and it is possible that this imaging feature may prove to be highly characteristic of neuroferritinopathy. In case 9, there was cavitation of the dentate nucleus.
Quantitative 3T imaging with the R2* signal intensity revealed a correlation between thalamic iron levels and dystonia severity scores, but not chorea scores. By contrast, iron levels in the putamen rim demonstrated an inverse relationship with disease severity, with high R2* values associated with low chorea scores and lower R2* values, with high chorea scores. That lower R2* scores were observed in the putamen rim in patients with longer disease duration and higher chorea scores is probably due to necrosis of putaminal tissue, with loss of iron-rich cellular structures. There was no correlation between R2* and disease severity scores for the caudate nucleus, probably reflecting distortion of the MR imaging signal intensity by air in the sphenoidal sinus.
Serial measurements of brain R2* demonstrated increasing R2* in the thalamus, but no significant change in R2* values for the putamen rim or caudate nucleus. Given that R2* reflects brain iron content in postmortem samples and in vivo6⇓⇓⇓–10, the progressive increase in thalamic R2* is likely to reflect ongoing iron accumulation in neuroferritinopathy, detectable during a 6- to 12-month period. Moreover, the correlation of thalamic R2* with dystonia severity scores supports the use of quantitative MR imaging both to monitor natural history and to study the effects of any treatment aimed at modulating brain iron stores. The lack of correlation between thalamic R2* and chorea severity scores likely reflects the relative insensitivity of the chorea scale (UHDRS) to detect small changes during short periods of time in a movement disorder that is more complex than Huntington disease. Case reports indicate that brain iron accumulation can occur in patients with presymptomatic NBIA,5 and clearly, the relationship between brain iron accumulation, neuronal injury, and clinical symptoms is not straightforward. In PKAN and PLAN, it is thought that iron deposition occurs as a secondary process.5,11 However, in neuroferritinopathy, the primary genetic defect directly disrupts iron metabolism, and there is pathologic evidence that ferritin mutations lead to excessive iron deposition in the brain, causing oxidative stress, mitochondrial damage, and cell death.3,4
On MR imaging of the brain in neuroferritinopathy, hypointensities, representing probable iron deposition, precede evidence of atrophy and tissue necrosis.5 Thus, neurodegeneration and clinical symptoms occur once, as yet undefined, toxic threshold of iron accumulation is reached. Therefore, iron accumulation in neuroferritinopathy represents a primary factor driving the disease process, rather than simply accumulation with time. It is, therefore, clinically and scientifically relevant to measure brain iron in neuroferritinopathy as a proxy measure of disease progression in both the presymptomatic state and in clinically manifest disease. This will help to identify a putative toxicity threshold in presymptomatic disease and, because R2* correlates with clinical severity scales, to track disease progression in those clinically affected.
The R2* mapping sequence used in our study was not part of a routine protocol but was available directly on the scanner. The sequence took only 2.5 minutes to acquire, making it an acceptable duration for use in a specialist research setting for interventional and natural history studies. T2*-weighted imaging is routinely used to enhance areas of iron deposition, with other sensitive variations such as SWI being increasingly commercially available and capable of providing high contrast.12 Data processing to mitigate or minimize gross susceptibility effects remains a challenge to extract quantitative information either from R2* mapping or SWI, but is being addressed.12
Footnotes
-
Author roles: 1) research project: A) conception, B) organization, C) execution; 2) statistical analysis: A) design, B) execution, C) review and critique; 3) manuscript: A) writing of the first draft, B) review and critique. Alisdair McNeill: 1C, 2B, 3A, 3B; Grainne Gorman: 1B, 2B, 3A, 3B; Asif Khan: 1C, 2B; Andy Blamire: 1C, 2A, 3B; Patrick F. Chinnery: 1B, 3A, 3B; Rita Horvath: 1C, 2B, 3B.
-
Disclosures: Alisdair McNeill—UNRELATED: Employment: UK Medical Research Council Fellowship. Grainne Gorman—RELATED: Grant: Newcastle Healthcare Charity, Comments: The funding for this study was secured by Professors A. Blamire and P. Chinnery, on behalf of Newcastle University, both authors of this article. Ahmed Khan—RELATED: Grant: Newcastle Healthcare Charity, Comments: to pay for scans. Andrew M. Blamire—RELATED: Grant: Newcastle Healthcare Charity, Comments: local charitable foundation, which funded the MRI scans presented in this article.
References
- Received October 21, 2011.
- Accepted after revision December 2, 2011.
- © 2012 by American Journal of Neuroradiology


