
Abstract
BACKGROUND AND PURPOSE: Investigation of the anatomy, patency, and blood flow of arterial and venous vessels in small animal models of cerebral ischemia, venous thrombosis, or vasospasm is of major interest. However, due to their small caliber, in vivo examination of these vessels is technically challenging. Using micro-CT, we compared the feasibility of in vivo DSA and CTA of the murine cerebrovasculature using an intra-arterial route of contrast administration.
MATERIALS AND METHODS: The ECA was catheterized in 5 C57BL/6J mice. During intra-arterial injection of an iodized contrast agent (30 μL/1 sec), DSA of the intra- and extracranial vessels was performed in mice breathing room air and repeated in hypoxic/hypercapnic mice. Micro-CTA was performed within 20 seconds of intra-arterial contrast injection (220 μL/20 sec). Image quality of both methods was compared. Radiation dose measurements were performed with thermoluminescence dosimeters.
RESULTS: Both methods provided high-resolution images of the murine cerebrovasculature, with the smallest identifiable vessel calibers of ≤50 μm. Due to its high temporal resolution of 30 fps, DSA allowed identification of anastomoses between the ICA and ECA by detection of retrograde flow within the superficial temporal artery. Micro-CTA during intra-arterial contrast injection resulted in a reduced injection volume and a higher contrast-to-noise ratio (19.0 ± 1.0) compared with DSA (10.0 ± 1.8) or micro-CTA when using an intravenous injection route (1.3 ± 0.4).
CONCLUSIONS: DSA of the murine cerebrovasculature is feasible using micro-CT and allows precise and repeated measurements of the vessel caliber, and changes of the vessel caliber, while providing relevant information on blood flow in vivo.
ABBREVIATIONS:
- ACA
- anterior cerebral artery
- CNR
- contrast-to-noise ratio
- ECA
- external carotid artery
- fps
- frames per second
- PPA
- pterygopalatine artery
- STA
- superficial temporal artery
- TS
- transverse sinus
Using small animal models of human cerebrovascular diseases such as brain ischemia, venous thrombosis, or vasospasm,1⇓⇓⇓⇓⇓–7 researchers are able to conduct in-depth investigations of the anatomy and function of cerebral arterial, capillary, and venous vessels, which, in turn, leads to the advancement of therapeutic strategies. Due to the small caliber of murine intracerebral arteries at the base of the skull (range 100–250 μm),8,9 high spatial resolutions are mandatory to allow for the analyses of anatomic and pathologic alterations of these vessels. Furthermore, the extremely short mean cerebral transit time of less than 1 second in mice10 requires sufficient temporal resolution to accurately capture information regarding intracerebral blood flow in vivo.
While micro-CTA of the cerebral vasculature in live mice is feasible at high resolutions (16 μm)—at the expense of relatively high contrast doses (tail vein injection of 350 μL contrast agent over a 40-second scan time) and high radiation doses9,11—due to insufficient temporal resolution, micro-CTA and small-animal MRA12⇓⇓⇓–16 do not yet allow monitoring of the murine cerebrovascular blood flow.
Nevertheless, using high temporal and spatial resolutions with synchrotron radiation-based DSA, researchers have recently reported on murine cerebrovascular blood flow8,13,14 and blood flow in other vessels.11,15,17 Because most institutions do not have easy access to a synchrotron, smaller, less expensive, and more accessible methods are preferred. For example, some researchers have implemented x-ray–based DSA of the thoracic and liver vasculature in mice.17⇓⇓⇓–21 Focusing on neurovascular imaging, we found no publications describing x-ray–based DSA of the murine cerebrovasculature.
To address all of the above-mentioned limitations, we performed the underlying experiments to 1) elucidate whether high-resolution DSA of the murine cerebrovascular system is feasible without utilizing a synchrotron, and to what degree acute morphologic changes of the cerebral vessels can be identified by using such a system; 2) evaluate if contrast agent administration via an intra-arterial route allows high-contrast micro-CTA of the murine cerebrovasculature at reduced scan time and doses of contrast agent and radiation; and 3) compare both methods, focusing on the image quality of each technique.
Materials and Methods
Animals
All experiments were carried out after receiving local ethics committee approval. Institutional guidelines for animal welfare and experimental conduct were followed. In the experiments, five 10-week-old male C57BL/6J mice, weighing 20–23 g, were used. All animals were kept in a temperature-controlled room with a 12-hour light/dark cycle and had free access to water and a standard laboratory diet.
Catheterization of the External Carotid Artery
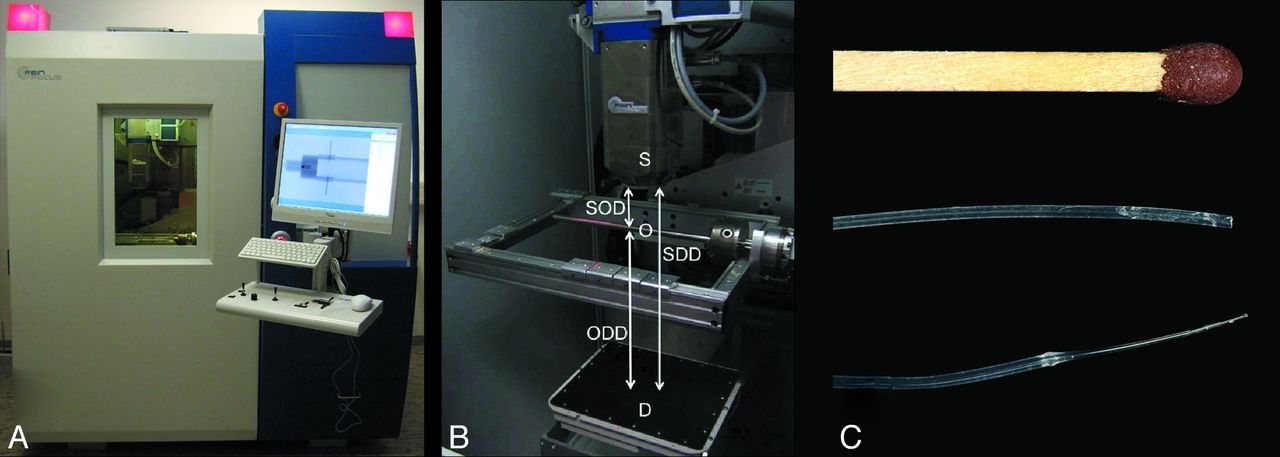
The animals were anesthetized by intraperitoneal administration of ketamine (100 mg/kg body weight) and xylazine (5 mg/kg body weight). Using an operating microscope, the left ECA was cannulated in the retrograde direction through a small incision using a modified polythene catheter. The catheter (Fig 1 C) was prepared from polythene tubing (Portex Fine Bore Polythene Tubing; outer diameter 0.38 mm; inner diameter 0.23 mm; Smiths Medical International Ltd., Ashford Kent, United Kingdom) by heating the polythene tube for a few seconds and immediately stretching while still hot. The stretched part of the tube was cut at the thinnest section to create a catheter thin enough (outer diameter of less than 0.25 mm) to fit into the murine ECA, while still allowing injection of the contrast agent at the specified injection rates.

A, The micro-CT used for the experiments. B, A photograph of the inside of the lead-insulated cabin shows the multifocus x-ray source (S), the detector (D) beneath the x-ray source, as well as the manipulator table with the rotation axis. The height of the detector and the manipulator can be freely adjusted to optimize magnification levels that are affected by the SOD, SDD, and ODD. C, Polyethylene tubing used for intra-arterial injection of contrast agent into the external carotid artery of the mouse. To optimize the tubing system for insertion in small vessels like the ECA, the original tube (middle image; outer diameter 0.38 mm; inner diameter 0.23 mm) was tapered by applying traction to the heated tubing. The thinned polythene tube (lower image) fits well into the ECA. A matchstick (upper image) is shown for scale comparison. SOD indicates source-object distance; SDD, source-detector distance; ODD, object-detector distance.
Digital Subtraction Angiography
An industrial micro-CT (Y. Fox; Yxlon International, Hamburg, Germany; Figs 1A and 1B) equipped with a transmission x-ray tube (Yxlon International) and an amorphous silicon flat panel detector (1888 × 1408 pixels; Varian PaxScan 2520; Varian, Palo Alto, California) was used. The mouse was placed in the micro-CT and the catheter was connected to a syringe filled with prewarmed contrast agent (Iomeprol 300; Bracco Imaging, Konstanz, Germany) diluted (× 0.5) with saline solution. Using an infusion pump (PHD 2000; Harvard Apparatus, March-Hugstetten, Germany), 33 μL of contrast agent were injected into the ECA within 1 second for cerebral DSA.
DSA was performed at 80 kV using a 2 × 2 binned detector pixel matrix of 944 × 704 at 4 and 30 fps. The tube current was maximized to optimize the SNR while preventing overexposure of the detector. The source-object distance and object-detector distance were adjusted so that the left hemisphere of the mouse filled the field of view. Gain-offset calibration was performed before contrast injection to produce DSA images (Figs 2 and 3). DSA sequences were recorded digitally in an AVI movie file format. DSA images were calibrated by performing an additional scan with a 27-gauge (0.4 mm) needle placed directly beside the animal's head at the level of the skull base.

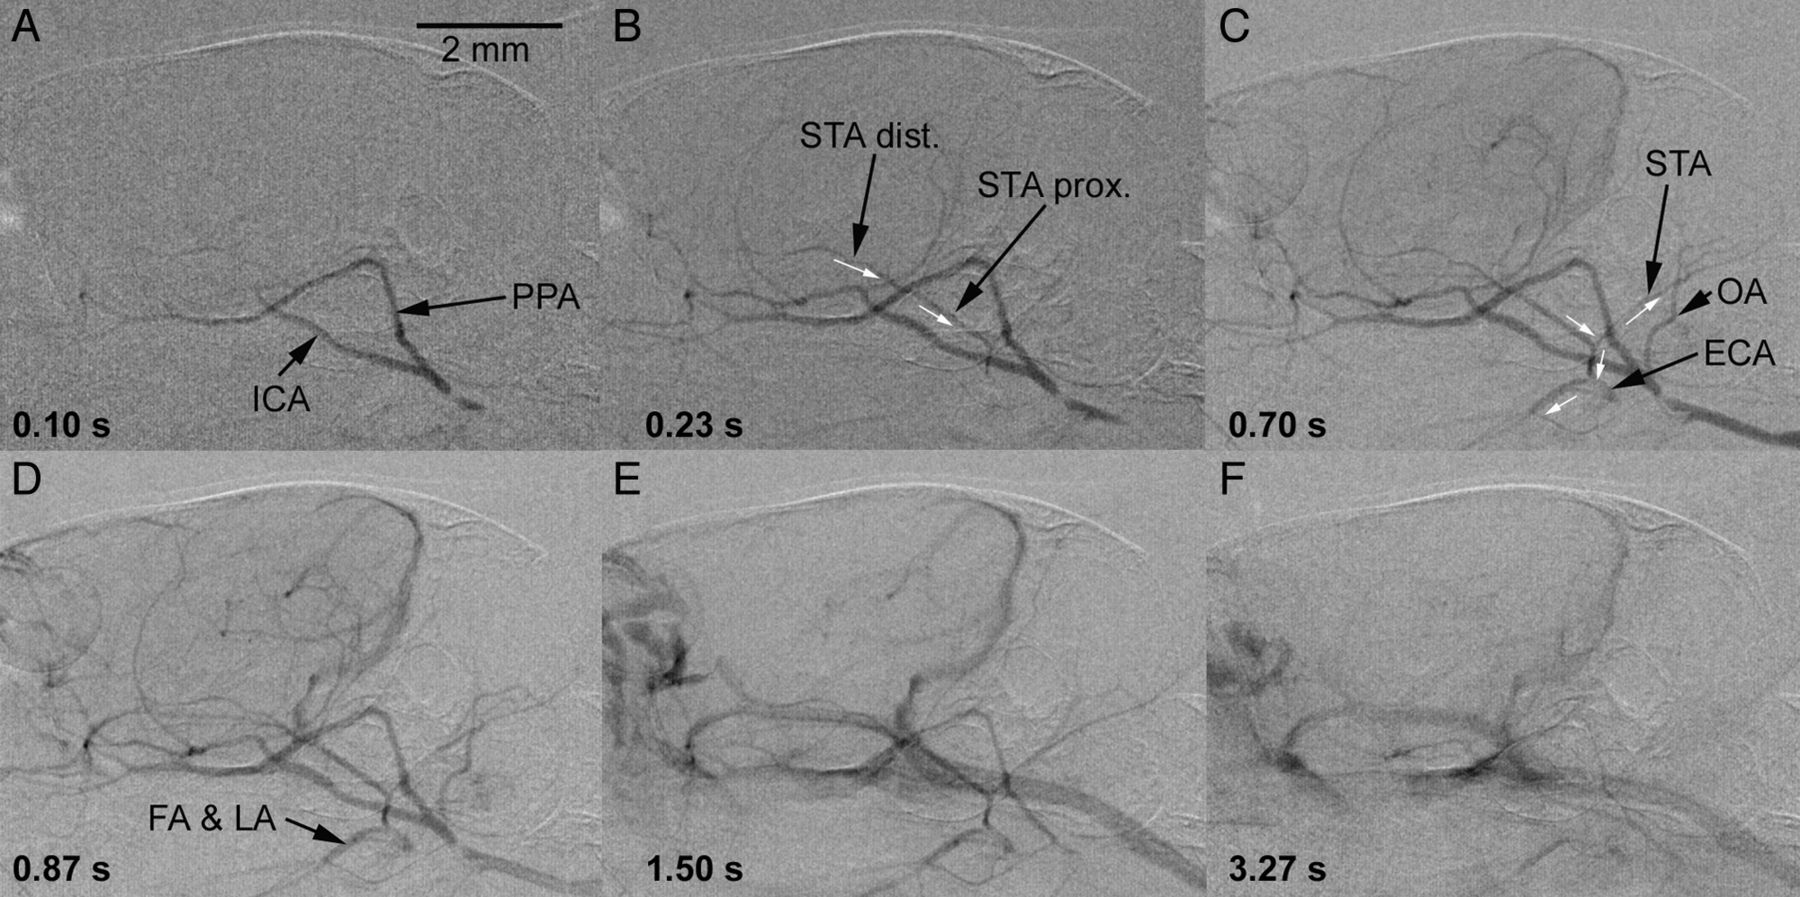
Cerebral DSA of a C57BL/6J mouse (craniocaudal projection). DSA (4 fps) was performed during intra-arterial injection of a bolus of 33 μL of contrast agent within 1 second (1.980 mL/min) via the tapered polythene tubing system into the proximal ECA. The successive images show the early arterial phase (0.10 seconds and 0.35 seconds; A and B) and the parenchymal phase (0.60 seconds; C), while the veins already start to fill after 0.60 seconds (D–F). Despite ligation of the ECA during insertion of the catheter, the distal ECA and its branches are contrasted via a retrograde blood flow in the STA (white arrows in B and C) most probably via extracranial collaterals from the pterygopalatine artery. Relevant large vessels have been named to provide better orientation. PCA indicates posterior cerebral artery; OA, occipital artery; LA, lingual artery; FA, facial artery.

Cerebral DSA (30 fps) of a C57BL/6J mouse (lateral projection). High temporal and spatial resolution of the DSA again demonstrate retrograde filling of the proximally ligated ECA (A–C) via the distal and proximal rostral branch of the STA (direction of blood flow indicated by white arrows). With a slight delay, the occipital branch of the STA, as well as the FA and the LA arising from the ECA, are likewise contrasted (D). The retrograde filling occurs most likely via collaterals between the PPA and the STA. In the venous phase (E and F), the contrast of the STA diminishes from distal to proximal (once more indicating the retrograde flow), while the contrast of the FA and the LA fades away slightly later. The venous structures are shown in detail in Fig 6. FA indicates facial artery; LA, lingual artery; OA, occipital artery.
Induction of Vessel Caliber Changes
To assess acute vessel diameter changes, each mouse underwent initial DSA in a status of normocapnia while breathing room air (time point 0′). Dilation of the cerebrovasculature was measured in a state of hypoxic hypercapnia (time point 15′) by providing a gas mixture containing 5% CO2 and 12% O2 for 15 minutes. Finally, the animals were allowed to breathe room air again for another 15 minutes before performing the third and last DSA (time point 30′).
Measurement of Vessel Calibers
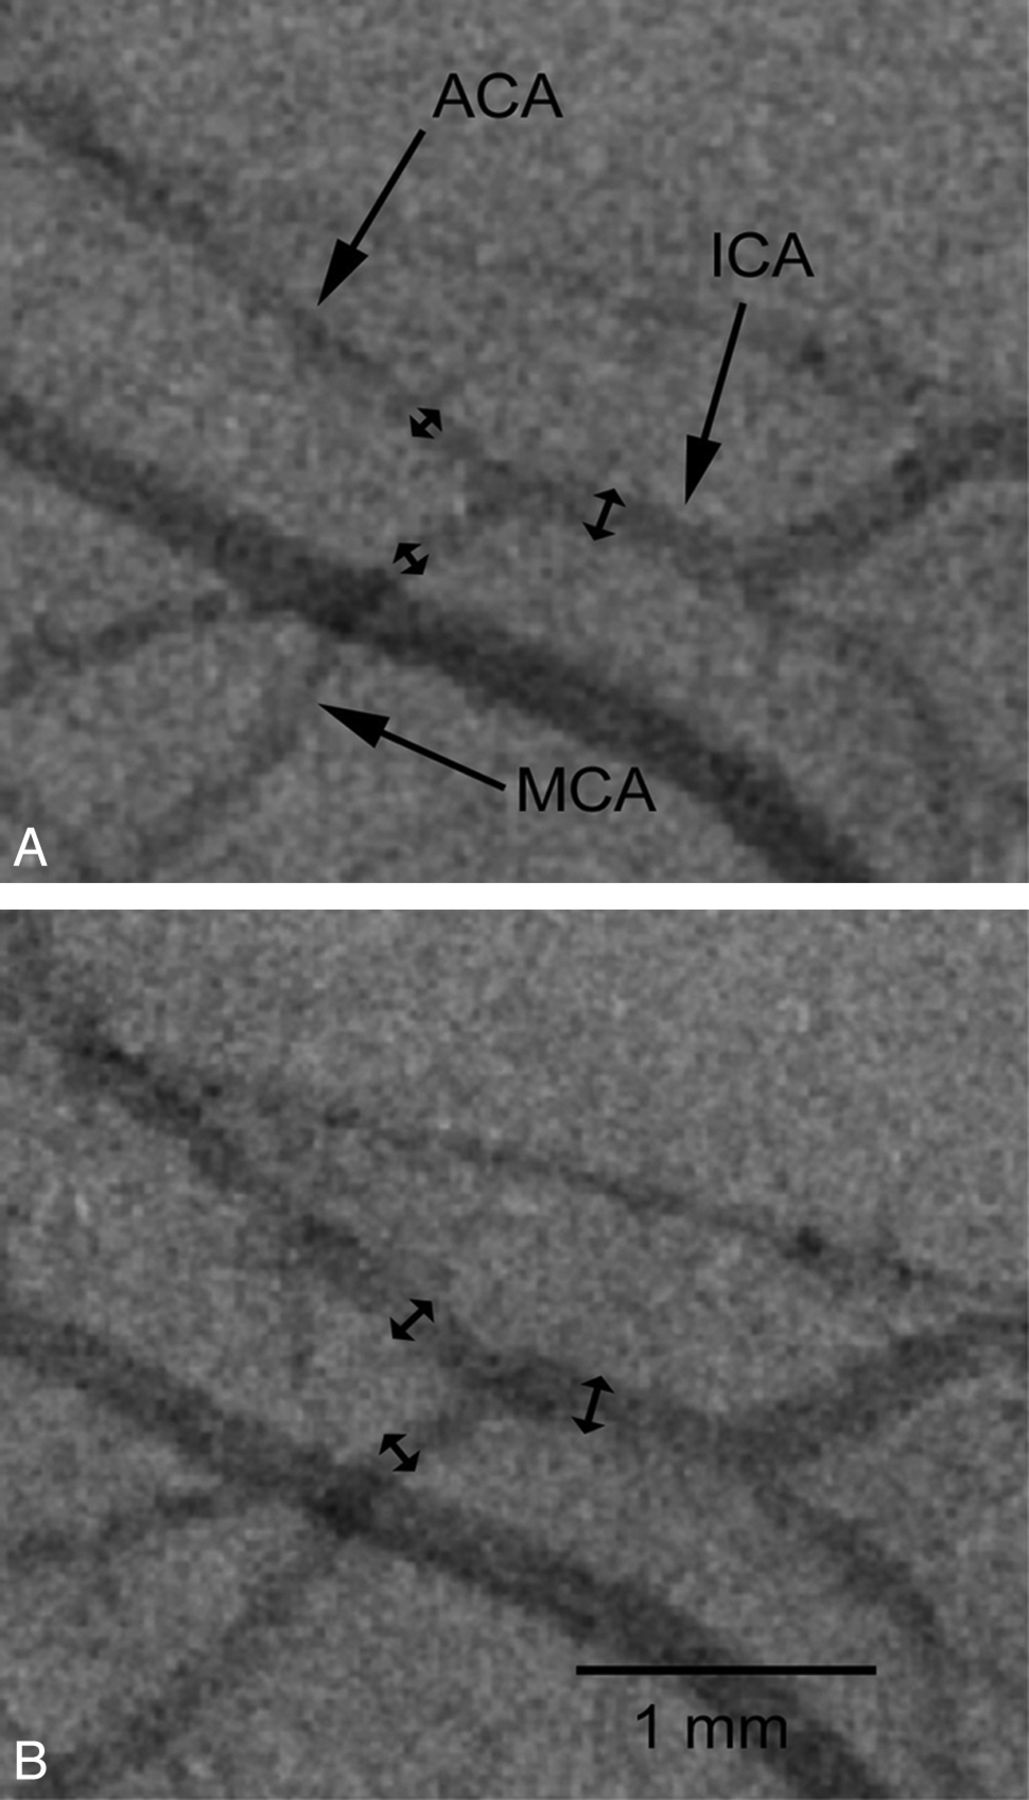
Vessel caliber changes were measured using the public domain software ImageJ (v1.43u; W. Rasband, National Institutes of Health, Bethesda, Maryland). The recorded AVI files were imported and the caliber of the ICA, the MCA, and the ACA of each mouse were measured. Images of the 27-gauge needle were used for calibration. To ensure comparable results, each vessel was measured approximately 0.5 mm proximally or distally of the bifurcation of the ICA splitting into the MCA and ACA (Fig 4). Changes of vessel diameter over time were compared using the Wilcoxon signed-rank test. A P value of ≤.05 was considered statistically significant.

Repeated DSA demonstrates caliber changes of the cerebral vasculature in C57BL/6J mice. The caliber of the ICA, the MCA, and the ACA of each mouse were measured approximately 0.5 mm proximally (ICA) or distally (MCA, ACA) of the bifurcation of the ICA. A, DSA performed in a status of normocapnia with the animal breathing room air. B, After induction of hypoxic hypercapnia (5% CO2 and 12% O2 for 15 minutes), the cerebral vasculature is dilated.
Ultrafast High-Contrast Micro-CT Using Intra-Arterial Injection of Contrast Agent
Because we already had access to the arterial system after catheterization of the ECA to perform DSA, and as we were using a micro-CT system, in 2 of the animals, we subsequently tested whether micro-CT angiography within 20 seconds of continuous intra-arterial infusion of a contrast agent into the ECA yielded a sufficient image quality. The mouse was rotated over 190° during a 20-second scan time at an acquisition rate of 30 fps (600 projections; 944 × 704 pixels in a 2 × 2 binning mode; 80 kV, 75 μA) during injection of 220 μL of prewarmed contrast agent (Iomeprol 300 diluted x 0.5 with normal saline). Datasets were reconstructed using a filtered back-projection algorithm (Reconstruction Studio Software; Yxlon International) with Shepp-Logan filter for edge enhancement. The matrix for reconstruction was 512 × 512 × 512 voxels.
Measurement of CNR
DSA was saved in the AVI movie file format as described previously. The AVI files were imported using ImageJ and decomposed to single projections (by saving as an image sequence). The decomposed single projections were saved using the RAW file format. Eight single projections (0.033-second exposure time per projection) of the early arterial phase of each DSA were again imported in ImageJ and overlaid (opacity for each overlay set to 50%; cumulative exposure time of 0.266 seconds). The overlaid images were flattened and inverted to provide a positive vessel contrast for subsequent calculation of the CNR.
To measure the CNR, we first determined the noise. The noise was measured as the SD of a region of interest encompassing background. Contrast was first measured by placing a region of interest within a vessel (vessel signal), and then another region of interest encompassing brain tissue (tissue signal) without discernable vessels or the ventricular system was measured. The background signal was measured by placing a region of interest in the air-filled space outside of the mouse. The tissue signal was measured as the mean image attenuation or intensity in the adjacent brain tissue. The CNR was calculated as follows:

Radiation Dose Measurements
Measurements of the applied radiation dose were performed by inserting a small calibrated thermoluminescence dosimeter (TLD-GR200; GC Technology, Buch am Erlbach, Germany) intracranially (through the foramen magnum) in 2 sacrificed mice. A 20-second micro-CT scan with the above-described parameters was performed. The thermoluminescence dosimeters were sent back to the German Federal Office for Radiation Protection (Bundesamt f. Strahlenschutz, Oberschleissheim/Neuherberg, Germany) for the evaluation of the applied dose. The mean radiation dose in Gy (±1 SD) was calculated.
Results
Intra-Arterial Injection of Contrast Agent
Because contrast injection may lead to nonphysiologic flow patterns, like crossflow to the contralateral hemisphere or backflow into the ICA, we analyzed the flow pattern during contrast agent injection. At the chosen flow rates of 33 μL/1 sec (DSA) and of 11 μL/s over 20 seconds (micro-CTA) we did not observe any crossflow of contrast agent, nor did we find relevant backflow into the aortic arch. The azygos ACA, which is supplied from both proximal anterior cerebral arteries, likewise did not show sufficient contrast in DSA and micro-CTA indicative of inflow of noncontrasted blood from the contralateral anterior circulation. These observations suggest that the chosen injection rates are not strong enough to induce crossflow or relevant backflow but still provide sufficient contrast for DSA and micro-CTA, as described in the following sections. Only in 2 animals did we observe an extremely weak contrast of the ipsilateral posterior communicating and basilar artery, which is not surprising, as C57BL/6J mice are known to have a thin communicating posterior artery, which is frequently found only on 1 side.9,22,23 This finding may be of importance in experimental models of stroke, where stain-related differences of the vascular anatomy were related to the vulnerability of the brain and size of cerebral ischemia.
Digital Subtraction Angiography
DSA at 4 fps and 30 fps during intra-arterial injection of iodinated contrast agent into the ECA resulted in assessable images of the arterial, capillary, and venous phase of all mice. Figures 2 and 3 provide time-resolved craniocaudal and lateral DSA projections of the murine intra- and extracerebral vessels, respectively. The relevant large vessels were named to allow anatomic orientation. Although the mean cerebral transit time was not determined, the lapse of time between the initial enhancement of the ICA and filling of the larger cerebral veins at the aforementioned injection rates was less than 1 second during DSA, which is in agreement with the literature.10,18 Measurements of the diameter (mean ± 1 SD) of the proximal MCA (124.8 ± 17.1μm), ACA (114.6 ± 16.1μm), and the distal ICA (160.8 ± 16.1μm) have been performed and are presented in detail for each mouse in Table 1. The smallest identifiable vessels were little cortical branches arising from the MCA with a diameter of approximately 50 μm (Fig 2C). Mean CNR of DSA was 10.0 ± 1.8 (n = 5 mice).
Diameters (μm) of murine cerebral arteries measured in vivo using DSA
Interestingly, DSA revealed a slightly delayed contrast enhancement of the distal branches of the proximally ligated ECA in all animals, which raised the suspicion of collaterals communicating between the ICA and ECA. Assessment of DSA at 30 fps showed a retrograde flow in the STA, with subsequent enhancement of the distal ECA as well as of the facial and the lingual artery arising from the ECA. This finding is highlighted in Figs 2 and 3 (small white arrows indicate the direction of blood flow) and indicative for distal anastomoses between branches of the PPA (arising from the ICA) and the STA. Similar collaterals have also been described by Tamaki et al, who observed (in reverse order) blood flow from the ECA into the PPA after ligation of the proximal ICA.24
Measurement of Vessel Diameter Changes Using DSA
Acute changes of the diameter (mean ± 1 SD) of the intracranial arteries (ICA, MCA, and ACA) were measured in 5 mice (Table 2). While breathing room air (normocapnia), the mean vessel diameter was 160.8 ± 16.1 μm for the ICA, 114.6 ± 16.1 μm for the ACA, and 124.8 ± 17.1 μm for the MCA. Fifteen minutes after induction of hypoxic hypercapnia, as described, the vessel diameter increased significantly (P < .05 for all) to 181.6 ± 18.6 μm (ICA), 132.2 ± 20.1 μm (ACA), and 138.4 ± 24.0 μm (MCA). After breathing room air again for another 15 minutes, the diameter of the cerebrovasculature decreased significantly to 144.2 ± 17.5 μm (ICA), 105.4 ± 13.3 μm (ACA), and 116.2 ± 13.2 μm (MCA), respectively. Fig 4 illustrates vessel caliber changes in vivo.
Comparative overview of measurement parameters of micro-CTA and DSA with intra-arterial contrast application into the ECA
Micro-CT Angiography
Although the establishment of cerebrovascular DSA in mice was the main goal of our studies and few publications describe in vivo micro-CTA in mice9 and rats,25 we subsequently tested in 2 animals if ultrafast high-contrast micro-CT angiography is feasible. To investigate to what degree small vessels can be visualized within extremely short scan times of 20 seconds (Fig 5), contrast agent was injected through the already cannulated ECA.

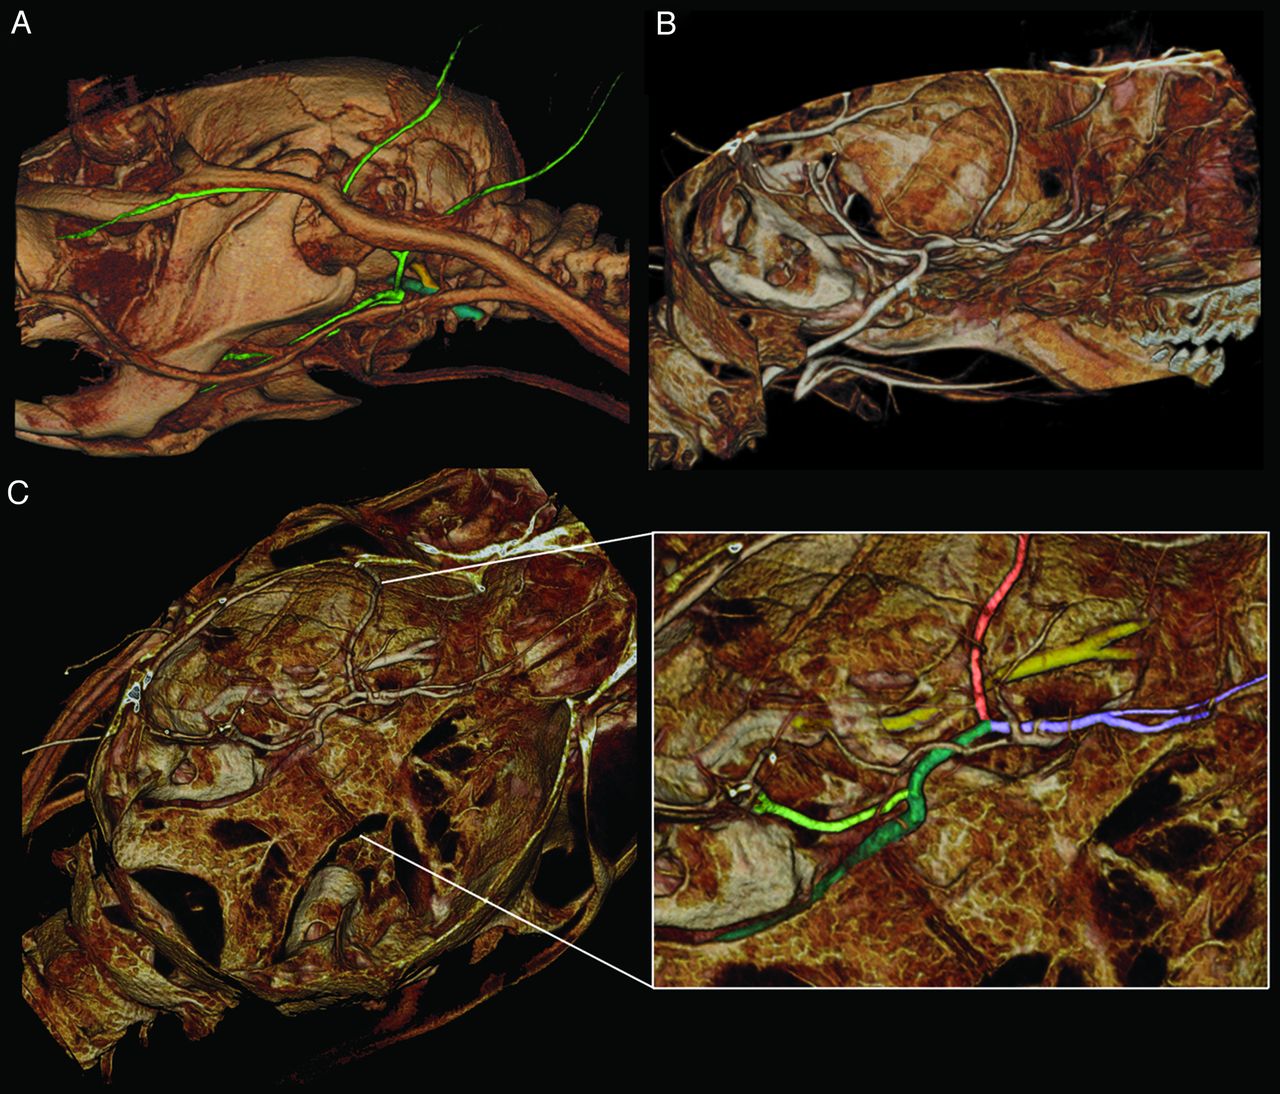
Volume rendering of a micro-CT angiography of a C57BL/6J mouse. Due to the relatively short mean cerebral transit time (intra-arterial injection of 220 μL contrast media within 20 seconds scan time; 190° rotation; 600 projections; 80 kV; 75 μAs; voxel size: 39 × 29 × 29 μm) the venous and the arterial vessels are superimposed. A, Extracranial vessels: the ICA (dark green) and the PA (yellow) both draw into the base of the skull. The branches of the ECA are colored light green, and contrast despite proximal ligation via extracranial anastomoses, as shown in the previous DSA figures. B, Sagittal view showing the ICA running through the base of the skull. C, Cranial view of the skull base showing the intracranial arteries; a close-up shows the ICA drawing through the base of the skull (dark green), as well as the PCA (light green), the MCA (light red), and the ACA (light purple), which divides into the larger azygos ACA and a smaller branch providing blood supply for the olfactory brain (better seen in the overview). Furthermore, the PA (yellow) is shown drawing along the skull base (proximal part with thin bony coverage) and dividing into a lateral and a medial branch providing, among other things, blood supply for the eye and the nasal mucosa, respectively. PA indicates pterygopalatine artery; PCA, posterior cerebral artery.
The smallest identifiable vessels were the proximal branches of the retinal arteries arising from the ophthalmic artery (not shown), with the latter clearly being traceable back to the PPA. Other small vessels (diameter <50 μm) were, for example, small muscle branches arising from the lingual artery as well as small branches arising from the MCA. From DSA, a communication between the PPA and the STA was suspected. We therefore searched for and identified very small arterial vessels located within the temporal fossa, interconnecting the STA and the PPA, explaining the almost immediate retrograde filling of the STA during DSA.
Compared to our previously published method of in vivo micro-CTA of the murine cerebrovasculature using tail-vein injection of contrast agent,9 we found that a better CNR could be achieved in micro-CTA (Table 2) using an intra-arterial route of contrast administration (CNRiv = 1.3 ± 0.4 versus CNRia = 19.0 ± 1.0). Furthermore, the intra-arterial injection route allowed reductions in 1) the total injection volume by 37% (350 μL intravenous versus 220 μL intra-arterial), 2) the contrast agent concentration by 50%, and 3) the total contrast agent dose by 70%, which is important with a total blood volume of 1.2–1.5 mL in mice. In addition, the scan time and radiation dose were halved. A disadvantage, however, was that only the cerebral vessels of 1 hemisphere could be visualized.
In addition to observing the physiologic and anatomic findings described thus far, we were also able to clearly visualize pathologic changes. In very early experiments, for example, we detected dissection of the ICA with a false and a true lumen, which was induced during the introduction of the catheter tip and which extended upward into the intracranial segment of the ICA as well as into the PPA. This finding is shown in Fig 6 D and demonstrates the capability of micro-CTA to clearly visualize even subtle pathologic findings.

DSA (A, venous phase) and volume rendering of a micro-CT angiography (B), providing an overview over the intra- and extracranial venous structures. The SSS and the great cerebral vein or VG drain into the TS. The TS emerges from the cranium and is termed IMV before draining into the JV. The SOV and the TFV drain into the STV and then into the JV. The anterior facial vein drains into the JV more proximally (more clearly in micro-CT angiography images (B). C, A coronal section (maximum intensity projection of a micro-CT angiography) shows the blush of the choroid plexus (arrows) draining into the great VG. D, Micro-CT angiography offers sufficient resolution and contrast to depict intra-arterial pathologies. As an example, dissection of the ICA (arrows), ranging from the extra- into the intracranial segment is shown. The dissection also affects the PPA (*intraosseous part is shown in close proximity to the tympanic cavity). IMV indicates internal maxillary vein; JV, jugular vein; SOV, supraorbital vein; SSS, superior sagittal sinus; STV = superficial temporal vein; TFV, transversal facial vein; TS, transverse sinus; VG, vein of Galen.
Radiation Dose Measurements
Radiation dose measurements using intracerebrally implanted thermoluminescence dosimeters in sacrificed mice showed a radiation dose of 0.25 ± 0.014 Gy per 20 seconds micro-CT angiography. With regard to DSA, these values can be considered as a basic value being influenced by the length and number of performed DSA procedures. In addition, the chosen source-object distance is a basic value that can be decreased to reduce the field of view, increasing the resolution of the images, as well as the locally applied radiation dose, by the inverse square law.
Discussion
With the diameter of the proximal murine cerebral arteries ranging between 100 and 200 μm, high spatial resolutions are required to allow valid analysis of these vessels. Likewise, due to the short mean cerebral transit time of less than 1 second in mice,22,23,26 high temporal resolutions, which cannot be accomplished using micro-CTA, are needed to visualize and analyze the cerebral blood flow. So far, only 1 group presented useful results on the method of cerebrovascular DSA in mice.8,13,14,19,20 These results were obtained using a third-generation synchrotron radiation facility (SPring 8). Advantages of using a synchrotron are that it produces a significantly higher photon flux than conventional x-ray sources and the monochromatized x-ray energies just above the iodine K-edge energy produce the highest contrast. On the other hand, a synchrotron involves complex technology, which is costly and therefore restricted to centers with access to such a device.
As such, the main rationale for our study was to clarify whether comparable results sufficient for experimental purposes could be achieved using a conventional x-ray source, to circumvent the need for a synchrotron radiation facility to perform cerebrovascular DSA in mice.
While other groups performed in vivo x-ray DSA of liver,19 thoracic, and cerebral vessels in rats,11,17,18,21 and of the renal vasculature in mice,17 no studies described x-ray DSA for imaging of the cerebrovasculature in live mice. Our findings, however, demonstrate that this is highly achievable. Crucial points for successful DSA of murine cerebral vessels and the detection of vessel caliber changes are 1) a small pixel size (approximately 15 μm in our study), 2) a sufficient contrast-to-noise ratio, which we achieved by intra-arterial administration of contrast agent, and 3) high temporal resolutions. Since superselective transfemoral catheterization of supra-aortic vessels is feasible in rats,11,27 but not in mice, operative cannulation of the ECA was necessary in our experiments. Thus, the use of a small catheter to fit within the ECA and the process of cannulation of the ECA were other critical steps that required some training. While trying to optimize the contrast, we experimented with different concentrations of contrast agent and found that injection of prewarmed Iomeprol 300 through the small catheter was feasible without problems, whereas the continuous injection of prewarmed Iomeprol 400 was difficult due to the exponential increase in viscosity.
While ex vivo micro-CTA of the murine cerebrovasculature has been described before,28,29 and fewer studies describe in vivo CTA in rats,25 only 1 group, to date, has described cerebral in vivo micro-CTA in mice.9,11 The micro-CTA measurements presented in this manuscript differ in that 1) the scan time (and radiation dose) at 20 seconds is half as long as previously reported,9 2) despite the shortened scan time, the contrast agent dose and injection volume are significantly reduced, and 3) image quality (as measured by CNR) is still superior compared with our older studies using tail-vein injection. Unfavorable factors are that the unilateral approach of intra-arterial contrast administration only allows visualization of the vessels of 1 hemisphere and that catheterization of the ECA is much more invasive than tail-vein injection. Therefore, injection of a contrast agent over a catheter right into the caval vein, directly before or within the right atrium, might be an alternative to the intra-arterial approach. As we are currently investigating this alternative approach; a preliminary set of images is provided in Fig 7. The benefits to this approach are that the complete circle of Willis is contrasted and cannulation of the jugular vein is easier than that of the ECA. The vessel contrast, however, is reduced compared with the intra-arterial route.

In vivo DSA of the murine cerebrovasculature is feasible after injection of 100 μL Iomeprol (300 mg/L) within 1 second into the caval vein. A–C show original images acquired at 30 fps. In contrast to intra-arterial injection via the ECA, the complete circle of Willis is can be assessed. D, Improved image quality after integration of 6 single images.
Conclusions
We have been able to demonstrate that x-ray DSA in mice is feasible using a micro-CT system and allows measurement of changes of the diameter of the murine cerebrovasculature as well as visualization of the cerebrovascular blood flow in vivo. In addition, we demonstrated that intra-arterial administration of contrast agent allows us to perform micro-CTA in mice while reducing scan time, radiation dose, total injection volume, and contrast agent dose compared with the intravenous injection route, while still allowing the visualization of pathologic lesions of the murine cerebrovasculature.
Our findings suggest that DSA and CTA of the murine cerebrovasculature are useful tools for the in vivo investigation of vascular diseases, such as vasospasm or thrombolysis, and other experimental therapeutic strategies.
Footnotes
-
The acquisition of the micro-CT (Yxlon Y. Fox) was funded by the Federal Ministry of Education and Research and the Land Baden-Württemberg (HBFG grant # 125–648).
References
- Received October 5, 2011.
- Accepted after revision January 23, 2012.
- © 2012 by American Journal of Neuroradiology


