
Abstract
BACKGROUND AND PURPOSE: ADC histogram analysis can stratify outcomes in patients with GBM treated with bevacizumab. Therefore, we compared gene expression between high-versus-low ADC tumors to identify gene expression modules that could underlie this difference and impact patient prognosis.
MATERIALS AND METHODS: Up-front bevacizumab-treated patients (N = 38) with newly diagnosed glioblastoma were analyzed by using an ADC histogram approach based on enhancing tumor. Using microarrays, we compared gene expression in high-versus-low ADC tumors in patients subsequently treated with bevacizumab. Tissue sections from a subset of tumors were stained for collagen and collagen-binding proteins. Progression-free and overall survival was determined by using Cox proportional hazard ratios and the Kaplan-Meier method with the log rank test.
RESULTS: A total of 13 genes were expressed at 2-fold or greater levels in high- compared with low-ADC tumors at the P < .05 level. Of these, 6 encode for collagen or collagen-binding proteins. High gene expression for the collagen-binding protein decorin was associated with shorter survival (HR, 2.5; P = .03). The pattern and degree of collagen staining were highly variable in both high- and low-ADC tumors.
CONCLUSIONS: High-ADC GBMs show greater levels of ECM protein gene expression compared with low-ADC GBMs. It is unclear whether this translates to the accumulation of higher levels of the encoded proteins. However, because ECM molecules could contribute to a proinvasive phenotype, this relationship merits further investigation.
ABBREVIATIONS:
- ADCL
- mean ADC (10−6 mm2/s) of the lower curve from the histogram analysis
- ECM
- extracellular matrix
- GBM
- glioblastoma
- HR
- hazard ratio
- NIH
- National Institutes of Health
- RNA
- ribonucleic acid
- RPA
- recursive partitioning analysis
- VEGF
- vascular endothelial growth factor
- VEGF-A
- vascular endothelial growth factor-A
GBMs are the most aggressive and lethal primary brain tumors.1 Diffusion-based imaging paradigms have the ability to interrogate tumor physiology and, though previously used for assessment of stroke, are currently being developed as biomarkers for tumors. For instance, ADC histogram analysis has been used to predict response to bevacizumab in patients with recurrent GBM,2 and minimum ADC values have been found to be prognostic of outcomes in gliomas.3,4
Bevacizumab is a monoclonal antibody against VEGF-A, a primary mediator of angiogenesis in malignant gliomas.5 In patients with recurrent GBM, bevacizumab regimen treatment has been shown to improve response rate, as well as progression-free and overall survival compared with historical controls.6,7 It is known that the response to bevacizumab is highly variable, but the mechanisms underlying bevacizumab susceptibly are not well-characterized.8,9 More recently, the effect of bevacizumab therapy has been studied when started within 3–6 weeks after maximal tumor resection, concurrent with radiation and temozolomide therapy (ie, “up-front” treatment). In this setting, although progression-free survival improved, no benefit to overall survival was found.10,11
Microarrays are a powerful tool used to characterize genome-wide gene expression based on messenger RNA levels in tumor and other tissue. This technique has been used to demonstrate correlations between gene-expression levels, MR imaging–derived imaging features, and outcomes in GBM.12⇓–14 This combination of imaging and gene expression, sometimes referred to as “radiogenomics,” has the potential to give insight into tumor biology that would be difficult to acquire from either technique alone.15
In the current work, we investigated the relationship between an MR imaging–derived physiologic imaging parameter, in this case tumor ADC, and gene expression. Previously, it has been shown that ADC histogram analysis can stratify progression in patients with GBM treated up-front with bevacizumab.16 Thus, we determined the gene expression differences between high- and low-ADC tumors in treatment-naïve GBM subsequently treated with bevacizumab, and the relationship of the differences to progression-free and overall survival.
Materials and Methods
Patients
All patients enrolled in this retrospective study signed institutional review board–approved informed consent agreeing to participate in a study correlating image analysis with clinical outcomes. Data acquisition was performed in compliance with all applicable Health Insurance Portability and Accountability Act regulations. Patients were part of the AVF3770 study.10,11 The study enrollment spanned May 2005 to November 2008. Patients (N = 38) received (6000 ± 200 cGy) external beam regional radiation started within 3–6 weeks after maximal tumor resection, concurrent with temozolomide and bevacizumab therapy. All patients met the following criteria: 1) pathology-confirmed GBM, 2) a baseline (presurgical) MR imaging scan that included diffusion-weighted images, 3) minimum 1 year of clinical follow-up, 4) age older than 18 years, 5) Karnofsky Performance Status ≥ 60, and 6) available microarray genomic data that were acquired from gross total or near-total (>80%) resection in all except 1 patient based on the enhancing lesion. Follow-up scans were obtained at approximately 4- to 6-week intervals. Steroid doses for patients at the time of the initial scanning were not available in most cases. At the time of the last assessment (November 2010), 32/38 (84%) patients had died.
Imaging
MR imaging was performed on a 1.5T scanner and typically included axial T1-weighted (TR, 400 ms; TE, 15 ms; section thickness, 5 mm), T2-weighted fast spin-echo (TR, 4000 ms; TE, 126–130 ms; section thickness, 5 mm), FLAIR (TR, 8802 ms; TE, 122 ms; TI, 2100 ms; section thickness, 3 mm), diffusion-weighted and gadopentetate dimeglumine–enhanced (Magnevist; Berlex, Wayne, New Jersey; 0.1 mmol/kg) axial and coronal T1-weighted images (TR, 400 ms; TE, 15 ms; section thickness, 3 mm), with an FOV of 24 cm and a matrix size of 256 × 256. Postcontrast images were acquired immediately following contrast injection. Diffusion images used a section thickness of 3–5 mm, FOV of 24 cm, and matrix size of 256 × 256 for most patients. Most patients (32 of 38) were scanned either on a 1.5T Signa MR imaging unit (GE Healthcare, Milwaukee, Wisconsin) or on a 1.5T Sonata scanner (Siemens, Erlangen, Germany), by using the standard diffusion-weighted imaging pulse sequence supplied by the scanner manufacturer. This pulse sequence includes 1 image acquisition at b = 0 s/mm2 and 3 diffusion-weighted acquisitions using b = 1000 s/mm2.
Volume Acquisition/ADC Histograms
Enhancing tumor volumes were segmented on postcontrast T1-weighted images on presurgical scans by using a semiautomated adaptive thresholding technique so that all pixels above the threshold value were selected as previously described.2 Therefore, significant regions of macroscopic necrosis that were not enhancing as well as cystic areas were excluded. The resulting ROIs encompassing the entire enhancing tumor volumes were verified by a board-certified neuroradiologist (W.B.P., 7 years of experience) blinded to clinical outcome and were mapped to the ADC images. ADC values calculated on a pixel-by-pixel basis for the entire enhancing volume were used for histogram analysis and expressed in units of 10−6 mm2/s. ADC histograms were processed by using a 2-mixture normal distribution to provide optimal curve fitting as previously described.2 Mean values for the lower peak (ADCL, lower curve mean) were then generated, and tumors were dichotomized by using a cutoff for mean ADCL of 1200 based on prior work.2 Tumors with mean ADCL < 1200 10−6 mm2/s are referred to as “low-ADC tumors,” whereas tumors with mean ADCL > = 1200 10−6 mm2/s are referred to as “high-ADC tumors.”
Determination of Tumor Progression
Progression-free survival from the time of tumor resection was determined on the basis of modified Macdonald criteria, in which nonenhancing tumor growth also was considered as evidence of tumor progression as per the Response Assessment in Neuro-Oncology working group.17,18 Specifically, to increase sensitivity for nonenhancing tumor progression, 2 reviewers (W.B.P. and A.L.) retrospectively assessed the MR imaging and backdated time of progression to the earliest convincing worsening of FLAIR signal-intensity change compatible with nonenhancing tumor (this was done after the ADC histograms were generated to prevent unblinding of the reviewers). Discrepancies were resolved by consensus of the 2 readers. The main purpose of this retrospective method was to avoid increased progression-free survival due to failure to recognize progression (particularly nonenhancing progression) in the context of VEGF inhibition. Similarly, to decrease the chance that “pseudoprogression” would be characterized as true tumor growth, the first postoperative scan was used as the baseline and new areas of progressive contrast enhancement within the radiation field that developed within 3 months of the end of radiation therapy and then spontaneously resolved without change in treatment were assessed as “pseudoprogression.”
Microarray Data
Gene-expression data used in this work had been previously generated for a molecular study of GBM.19 Briefly, RNA was purified from fresh frozen tumor samples and was hybridized to U133 Plus 2.0 Arrays (Affymetrix, Santa Clara, California) for analysis of roughly 13,283 genes. The data files generated were normalized by using RMA from Bioconductor (for R, Version 2.6; http://cran.r-project.org/bin/windows/base/), relative to other Affymetrix microarrays of the same platform by using the Celsius data base (http://www.ncbi.nlm.nih.gov/pubmed/17570842). RMA normalized data were imported into dChip (http://biosun1.harvard.edu/complab/dchip)20 for differential expression analysis among genes in different ADC groups. We compared the fold change for the mean of each gene in the different ADC groups and used a t test to assess the significance. Significant genes were further analyzed by the DAVID bioinformatics tool (The US NIH data base for annotation, visualization, and integrated discovery; http://david.abcc.ncifcrf.gov)21 to identify enriched biologic groups.
Immunohistochemistry
Immunohistochemistry was performed by using antibodies against collagen I, III, VI, and decorin in a series of 38 formalin-fixed paraffin-embedded GBM tumor samples, 1 set of samples from each patient. Immunostaining was measured quantitatively, evaluating the attenuation of collagen on a scale of 0–4: 0, none, no immunopositivity for collagen; 1, mild/scarce, immunopositive for collagen in <25% of the tumor area, including vascular, cytoplasmic and interstitial staining; 2, scarce to moderate, immunopositive for collagen in 25%–50% of the tumor area, including vascular, cytoplasmic, and interstitial staining; 3, moderate to extensive: immunopositive for collagen in 50%–75% of the tumor area, including vascular, cytoplasmic, and interstitial staining; 4, extensive, immunopositive for collagen in >75% of the tumor area, including vascular, cytoplasmic, and interstitial staining.
Immunohistochemistry was performed by using whole-slide quantification with Image Analysis software (Aperio Technologies, Vista, California) by using the Positive Pixel Count and Nuclear Algorithms. Positivity was calculated on the basis of the ratio of the Positive Pixel Count to the total number of pixels. Results were reviewed and confirmed by a neuropathologist (W.Y.) and neuropathology researcher (L.M.).
Statistical Methods
A test of the proportional hazards assumption was used after fitting uni- and multivariate Cox models, and 95% confidence intervals were generated. The Kaplan-Meier method with a log rank test was used to estimate progression-free survival. For all analyses, a P value of < .05 was accepted as significant. Statistical analysis was performed with Stata 10 2008 (StataCorp, College Station, Texas). The Fisher exact test was used to test gene expression data in which multiple probes showed >2-fold change at the 95% confidence level.
Results
Patient Characteristics and Survival
The patient cohort for this analysis (N = 38) represents a subset of patients used in previous studies (N = 59),11,19 based on the availability of gene-expression data. For this subset, please see Table 1 for baseline patient characteristics and Fig 1 for survival analysis based on ADC histogram data. Note that high-ADC tumors have significantly shorter progression-free and overall survival compared with low-ADC tumors.
Baseline patient demographics

Kaplan-Meier progression-free (A) and overall (B) survival estimates for newly diagnosed patients with GBM treated up-front with bevacizumab on the basis of ADC histogram analysis of enhancing tumor from preoperative scans. High-ADC tumors are associated with poorer outcomes compared with low-ADC tumors.
High-Versus-Low ADC Tumor Gene Expression
Gene-expression levels were compared between high- and low-ADC tumors to identify expression that may be related to the poorer prognosis seen with high-ADC tumors. Thus gene expression enriched in high-ADC tumors at the 2-fold or greater level compared with low-ADC tumors is shown in Table 2. Note that 6 of the 13 genes (some genes have multiple oligonucleotide probes used for the microarray analysis) increased in ADC tumors are either isoforms of collagen or collagen-binding proteins (collagen isoforms: 1A1, 3A1, 6A3, and 11A1 and collagen-binding proteins: decorin and lumican). Multiple probes for collagen 1A, 3A, 11A and decorin were elevated in the high-ADC tumors. With the Fisher exact test based on multiple probes, overexpression of decorin in the high- versus low-ADC tumors was significant at the P = 9 × 10⁻¹⁴ level. DAVID bioinformatics analysis confirmed the overexpression of ECM-related genes (not shown). When samples were ordered according to ADCL values, there was a general trend of increasing extracellular matrix gene expression with increasing ADC. However, not all high-ADC tumors had high levels of ECM gene expression. This is illustrated in the heat map of gene expression levels (Fig 2). Only 3 genes were preferentially expressed in low-ADC compared with high-ADC tumors at the 2-fold or greater level. These are shown at the bottom of the heat map (Fig 2).
List of gene expression enriched >2-fold in high-versus-low ADC tumors at the P < .05 confidence level

Heat map (red corresponds to increased expression) showing gene expression in high-versus-low ADC tumors (1, top bar). Collagen isoforms and collagen-binding proteins are overexpressed in high-ADC tumors (right column, gene symbol). The bottom 3 genes were overexpressed in the low-ADC tumors.
We also assessed gene expression individually to test whether this could stratify survival. We found that in a univariate analysis, increased decorin was associated with increased risk of death (Table 3), whereas VEGF-A, the target of bevacizumab, and lumican (another collagen-binding protein) did not predict outcome in the univariate model.
Univariate Cox modela
Histology: High-versus-Low ADC Tumors
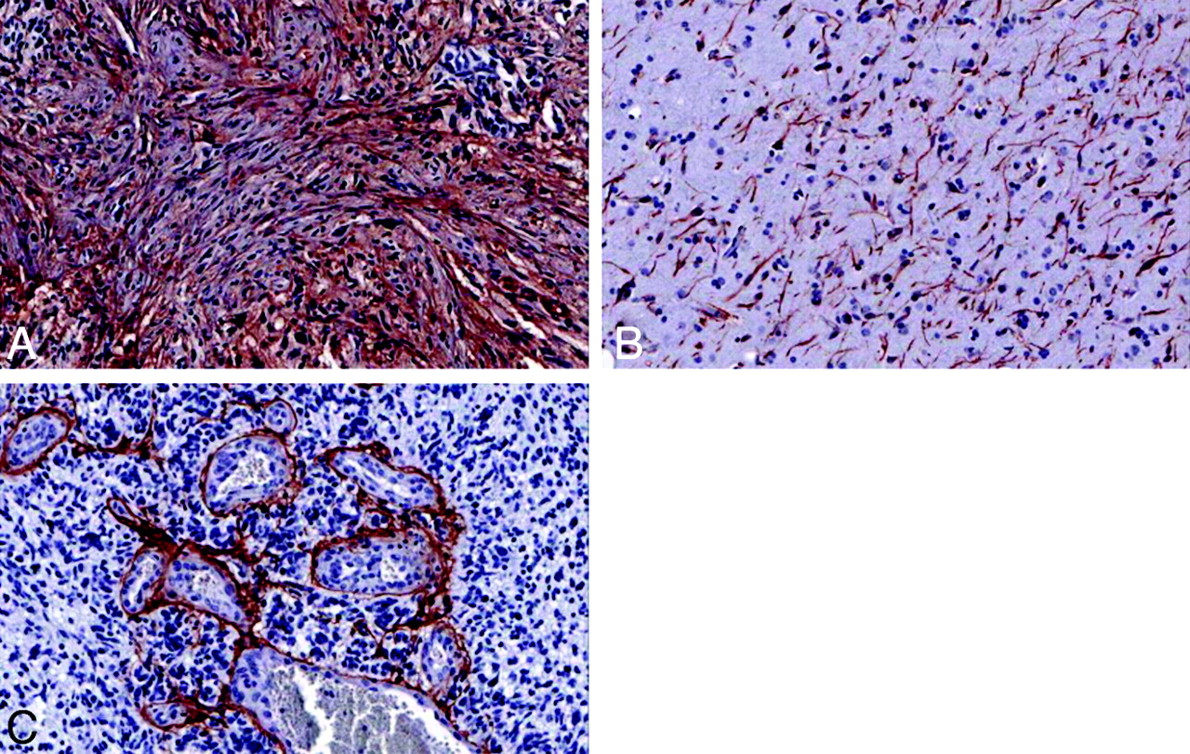
Expression of decorin and collagen 1, 3 and 6 isoforms was highly heterogeneous by immunohistochemistry in both high- and low-ADC tumors (Fig 3). There was no significant correlation between ADCL values and scoring of collagen immunoreactivity (P values ranging from .25 to .8). However, multiple patterns of immunoreactivity, including perivascular, interstitial, and cytoplasmic, were seen (Fig 3).

Patterns of immunohistochemical staining. A, Decorin, ×20. Note the interstitial pattern. B, Collagen 1, ×20. Note the cytoplasmic staining. C, Collagen 3, ×20. Note the perivascular staining.
Discussion
ADC histogram analysis stratifies progression-free survival in patients with GBM subsequently treated with standard therapy and “up-front” bevacizumab, an inhibitor of tumor angiogenesis.16 Treatment of gliomas with antiangiogenic therapy has been associated with a proinvasive phenotype that extends along blood vessels, so-called “vascular co-option.”22 It is also thought that this proinvasive phenotype may impart greater resistance to therapy and ultimately result in death. In the current report, we analyzed histopathologic and genomic differences between high- and low-ADC tumors in newly diagnosed GBM, to further characterize the relationship between ADC values and tumor biology in the setting of antiangiogenic therapy.
The 38 patients in the present study represent a subset of those from our prior published work.16 Progression-free and overall survival for this cohort was stratified by ADC histogram analysis as shown previously. Patients with high-ADC tumors had significantly poorer outcomes compared with those with low-ADC tumors. Therefore, we compared gene expression in the 2 groups, looking for genes whose expression was increased in the high-ADC (poorer survival) cohort. We found that 13 genes were overexpressed in high- compared with low-ADC tumors. Remarkably, 6 of these 13 genes encode for either collagen isoforms or collagen-binding proteins. Fibrillar collagens have previously been shown to be abundant but variably expressed in the extracellular matrix of GBM.23 Collagen and other extracellular matrix proteins are thought to enhance tumor invasion. Epigenetic mechanisms have been described that allow gliomas to deposit an invasion-promoting collagen-enriched matrix and then to use this matrix to rapidly migrate through brain tissue. These collagen isoforms include collagen 1A1, 1 of the genes we found to be overexpressed in high-ADC (poor prognosis) tumors.23,24
As mentioned above, treatment with bevacizumab can result in tumor growth along established vasculature, potentially as a method of antiangiogenic treatment “escape.” This perivascular pattern of invasion is also seen in an orthotopic mouse glioma model that overexpresses glutamate receptors. Overexpression of glutamate receptors results in increased glioma adhesion to collagen (reviewed in de Groot and Sontheimer, 201025). Thus, several lines of evidence suggest a relationship between collagen deposition by gliomas and enhanced invasion. Therefore, it is interesting to speculate that high ADC tumors may occur more rapidly because they are more invasive, due to increased ECM deposition. However, when we assessed collagen expression by immunohistochemistry and trichrome staining in a subset of these patients, there did not appear to be a good correlation between collagen levels and ADC values. Therefore, the correlation between gene and protein expression levels and the relationship to ADC and survival require further evaluation.
We also found that gene expression for the collagen-binding proteins decorin and lumican were up-regulated in high-ADC tumors. Decorin is a small leucine-rich proteoglycan. Both decorin and lumican have been shown to act as tumor repressors by antagonizing tyrosine kinases receptors and inhibiting integrin receptors. This is thought to result in an antisurvival and proapoptotic response (reviewed by Theocharis et al26). Decorin has also been shown to be a potent trophic factor that protects neuronal progenitor cells and glioma cells from oxygen and glucose deprivation.27 It has also been demonstrated that decorin expression is proportional to the quantity of tumor stroma; in patients with ovarian cancer, high decorin expression is associated with a higher incidence of relapse.28 Furthermore, a dominant-negative mutation in U87 cells of the ischemic responsive enzyme “inositol-requiring enzyme 1α” causes a 48-fold increase in decorin gene expression and is associated with a proinvasive and less angiogenic phenotype.29 We found that increased levels of decorin gene expression levels were associated with shorter survival. Thus, there may be several mechanisms by which decorin could impact tumor progression. It might be that it is the balance of these factors that determine whether this is an overall net benefit or detriment to patient outcomes, and decorin expression may be tumor (or treatment) dependent.
We did not find a significant correlation between ECM gene expression and immunohistochemistry staining in selected paraffin sections. The reasons are unclear. While gene expression may be coupled to the rate of protein production, levels of protein staining would be affected by both the rate of protein production and degradation. Rates of ECM protein degradation may be increased in gliomas because proteinases such as matrix metalloproteinases that target collagen are known to be up-regulated in this disease.30 Another potential explanation for this discrepancy is that in our study, tissue used for gene expression and that used for immunohistochemistry may have been from different areas of the tumor because stereotactic-derived biopsy tissue was not available. Additionally, microarray measures relative abundance of gene expression summed over the specimen, while immunohistochemistry reflects the percentage of tumor area with a signal intensity. This, in addition to the heterogeneity of GBM, may contribute to the decoupling of the 2 measures.
There are several caveats to our study, including those involved in ADC histogram generation as noted previously. These include variation in ADC values between different imaging platforms.16 As is typically the case, steroid doses at the time of first imaging are always a challenge to acquire, and we were not able to do so for many patients. Steroid treatment reduces mean ADC by 7% in brain tumors,31 and so the impact of steroids may not be great. Only small portions of tumors were available for histopathologic analysis, and GBMs are known to have significant regional variation. Thus the histology, as well as the samples used for gene expression, may not be representative of the tumor as a whole. Furthermore, not all patients had enough tumor tissue for histopathologic analysis. Future, prospective work with stereotactic biopsies may help to diminish this potential source of error. Additionally, other diffusion parameters acquired from diffusion tensor imaging (which we did not perform) could be useful in understanding the relationship between collagen-related gene expression and tissue microstructure because these metrics are hypothesized to reflect adhesion molecules and cell structure in other necrotic lesions.32
Conclusions
We show the potential utility of combining imaging and genomics to understand tumor biology. High-ADC tumors overexpress genes for collagen and collagen-binding proteins, which could help promote a more invasive phenotype. Mechanisms of invasion are central to the poor prognosis of GBM and likely require a better understanding to improve patient outcomes.
Footnotes
Disclosures: Whitney Pope—RELATED: Consulting Fee or Honorarium: Genentech, UNRELATED: Consultancy: Genentech, Payment for Lectures (including service on Speakers Bureaus): Genentech. Payment for Development of Educational Presentations: Genentech. Albert Lai—RELATED: Roche,* Genentech,* Consulting Fee or Honorarium: Roche, Genentech, UNRELATED: Grants/Grants Pending: Merck, Schering Plough. Phioanh Nghiemphu—UNRELATED: Consultancy: Genentech. William Yong—UNRELATED: Other: Genentech,* Comments: UCLA collaborates with Genentech in glioma genetic studies. Samir Kharbanda—UNRELATED: Employment: Genentech, Comments: full-time employee of Genentech Inc, Stock/Stock Options: Genentech. Robert Soriano—UNRELATED: Employment: Roche, Genentech, Stock/Stock Options: Roche, Genentech. Stanley Nelson—RELATED: Grant: NIH: National Cancer Institute, Comments: for the Cancer Center Core Grant. Heidi Phillips—UNRELATED: Employment: Genentech, Stock/Stock Options: Roche. Timothy Cloughesy—UNRELATED: Consultancy: Roche, Genentech, Agios, Lilly, Novartis. *Money paid to the institution.
References
- Received July 8, 2011.
- Accepted after revision September 17, 2011.
- © 2012 by American Journal of Neuroradiology
In this issue


Jump to section
Related Articles
Cited By...
- Usefulness of apparent diffusion coefficient values and magnetic resonance imaging histogram analysis for identifying histological types of preoperative testicular tumors
- Low Perfusion Compartments in Glioblastoma Quantified by Advanced Magnetic Resonance Imaging and Correlated with Patient Survival
- Diffusion-Weighted Imaging and Diffusion Tensor Imaging for Differentiating High-Grade Glioma from Solitary Brain Metastasis: A Systematic Review and Meta-Analysis
- Diffusion MRI Phenotypes Predict Overall Survival Benefit from Anti-VEGF Monotherapy in Recurrent Glioblastoma: Converging Evidence from Phase II Trials
- Tissue mechanics regulate brain development, homeostasis and disease
- ACRIN 6684: Assessment of Tumor Hypoxia in Newly Diagnosed Glioblastoma Using 18F-FMISO PET and MRI
- Diffusion-Weighted Imaging in Cancer: Physical Foundations and Applications of Restriction Spectrum Imaging
- Diagnostic Utility of Diffusion Tensor Imaging in Differentiating Glioblastomas from Brain Metastases
- Pretreatment ADC Histogram Analysis Is a Predictive Imaging Biomarker for Bevacizumab Treatment but Not Chemotherapy in Recurrent Glioblastoma
- Potential Role of Preoperative Conventional MRI Including Diffusion Measurements in Assessing Epidermal Growth Factor Receptor Gene Amplification Status in Patients with Glioblastoma