
Abstract
BACKGROUND AND PURPOSE: Intramedullary high signal intensity on T2-weighted imaging was frequently observed in patients with CSM, although this finding does not well correlate with severity or prognosis of CSM. Instead of this nonquantitative information, another measure for CSM is desired. The work was focused primarily on assessing the relationships between ADC values and clinical and radiologic severity for the diagnosis of CSM.
MATERIALS AND METHODS: The relationship between ADC values measured in the spinal cord at 322 intervertebral levels of 66 patients and clinical factors were analyzed.
RESULTS: ADC values in the spinal cord significantly increased with the degree of spinal cord compression and decreased with time after decompression surgery. Patients with higher ADC values had lower preoperative JOA scores and tended to show poorer clinical recovery.
CONCLUSIONS: ADC values appear to indicate the severity of spinal cord compression and clinical recovery after decompression surgery, so spondylotic myelopathy may partly be predicted preoperatively by using ADC values.
ABBREVIATIONS:
- CSM
- cervical spondylotic myelopathy
- JOA
- Japanese Orthopaedic Association
CSM is the most common cause of spinal cord dysfunction in the middle-aged and elderly population. CSM is caused by chronic compression of the spinal cord by surrounding bony or ligamentous structures. Surgical decompression is generally considered if the symptoms affect daily life, but early surgical intervention is thought to be more effective. Therefore, early detection may be the key to minimize postoperative sequelae.
Neuroimaging methods, usually axial and sagittal MR imaging, can provide reliable information about spinal cord compression, and more than half of patients with CSM show intramedullary high signal intensity on T2-weighted imaging,1 mainly in the spinal gray matter, but the exact mechanism remains unclear.1–10 Kinetic factors of the spine should also be taken into account, so detection of high T2 signal intensity in the spinal cord of patients with CSM but no prominent spinal cord compression on MR imaging implies the presence of compression during spinal movement. However, the absence of high intensity does not exclude the presence of myelopathy or pathologic changes.6 Patients with high T2 signal intensity areas especially in multiple segments often had poorer outcome3,4 but not always,7 and patients with persistent high T2 signal intensity after decompression surgery achieved clinical recovery similar to that in patients with reduced high intensity. Therefore, such T2 signal-intensity changes might reflect both reversible and irreversible pathologic changes,2 but the relationship between this signal intensity change and clinical severity or improvement remains unclear. Detection of myelopathic changes before any T2 signal-intensity increase could provide a useful way to screen for subclinical myelopathic disorders and to evaluate the severity of myelopathy.11
ADC measured by DWI provides information about the microstructural characteristics of water diffusion in biologic tissue.8 ADC is proportional to the local tissue water mobility, which is strongly affected by molecular viscosity, membrane permeability between the intracellular and extracellular compartments, and the directionality of structures that impede or enhance water mobility.12 ADC values increase in the presence of damage to the tissue microvasculature and subsequent vasogenic edema,13 because edema reduces the viscosity of interstitial fluid and increases extracellular volume. Reduced cell volume after neuronal loss or cystic degeneration of the spinal cord will result in an overall increase in ADC because water molecules move more freely in the extracellular space than in the intracellular space.
An increased ADC value was reported to relate to internal changes in the early stages of chronic spinal cord compression, with higher sensitivity than T2-high intensity.14
The present study investigated our hypothesis that ADC measured by DWI of the spinal cord can provide objective and reliable indications of the severity of CSM, by evaluating the relationship between ADC values and other clinical factors.
Materials and Methods
This prospective study included 66 consecutive patients in our clinic with CSM who were candidates for decompression surgery with DWI from January 2007 to June 2008. DWI was planned before surgery, 7 days after surgery in the early postoperative stage, and >6 months after surgery in the follow-up stage.
This study was approved by the institutional review board of the Interdisciplinary Graduate School of Medicine and Engineering, University of Yamanashi.
MR imaging was performed with a 1.5T system (Signa Excite; GE Healthcare, Milwaukee, Wisconsin) and 3-mm-thick sections on an axial spin-echo single-shot echo-planar system. DWI was obtained by using the array spatial sensitivity encoding technique with the following conditions: reduction factor = 2, TR = 14,000 ms, TE = 81.9 ms, FOV = 24 × 24 cm, image matrix = 128 × 128, 6 noncolinear gradient directions, and b = 1000 s/mm2. Mean ADC was calculated in regions of interest placed in the center of the spinal cord at the C2–3, C3–4, C4–5, C5–6, and C6–7 intervertebral levels on ADC map images. The regions of interest covered most of the cross-section of the spinal cord excluding the CSF space (Fig 1). The mean of ADC values in the 5 intervertebral levels and the maximum value were used for patient-based analysis. Segments with severe signal-intensity loss due to artifacts or with an undetermined spinal cord due to severe deformity were excluded.

Axial view of DWI. The mean ADC was calculated in the region of interest. The region of interest covered most of the cross-section of spinal cord, excluding the CSF space.
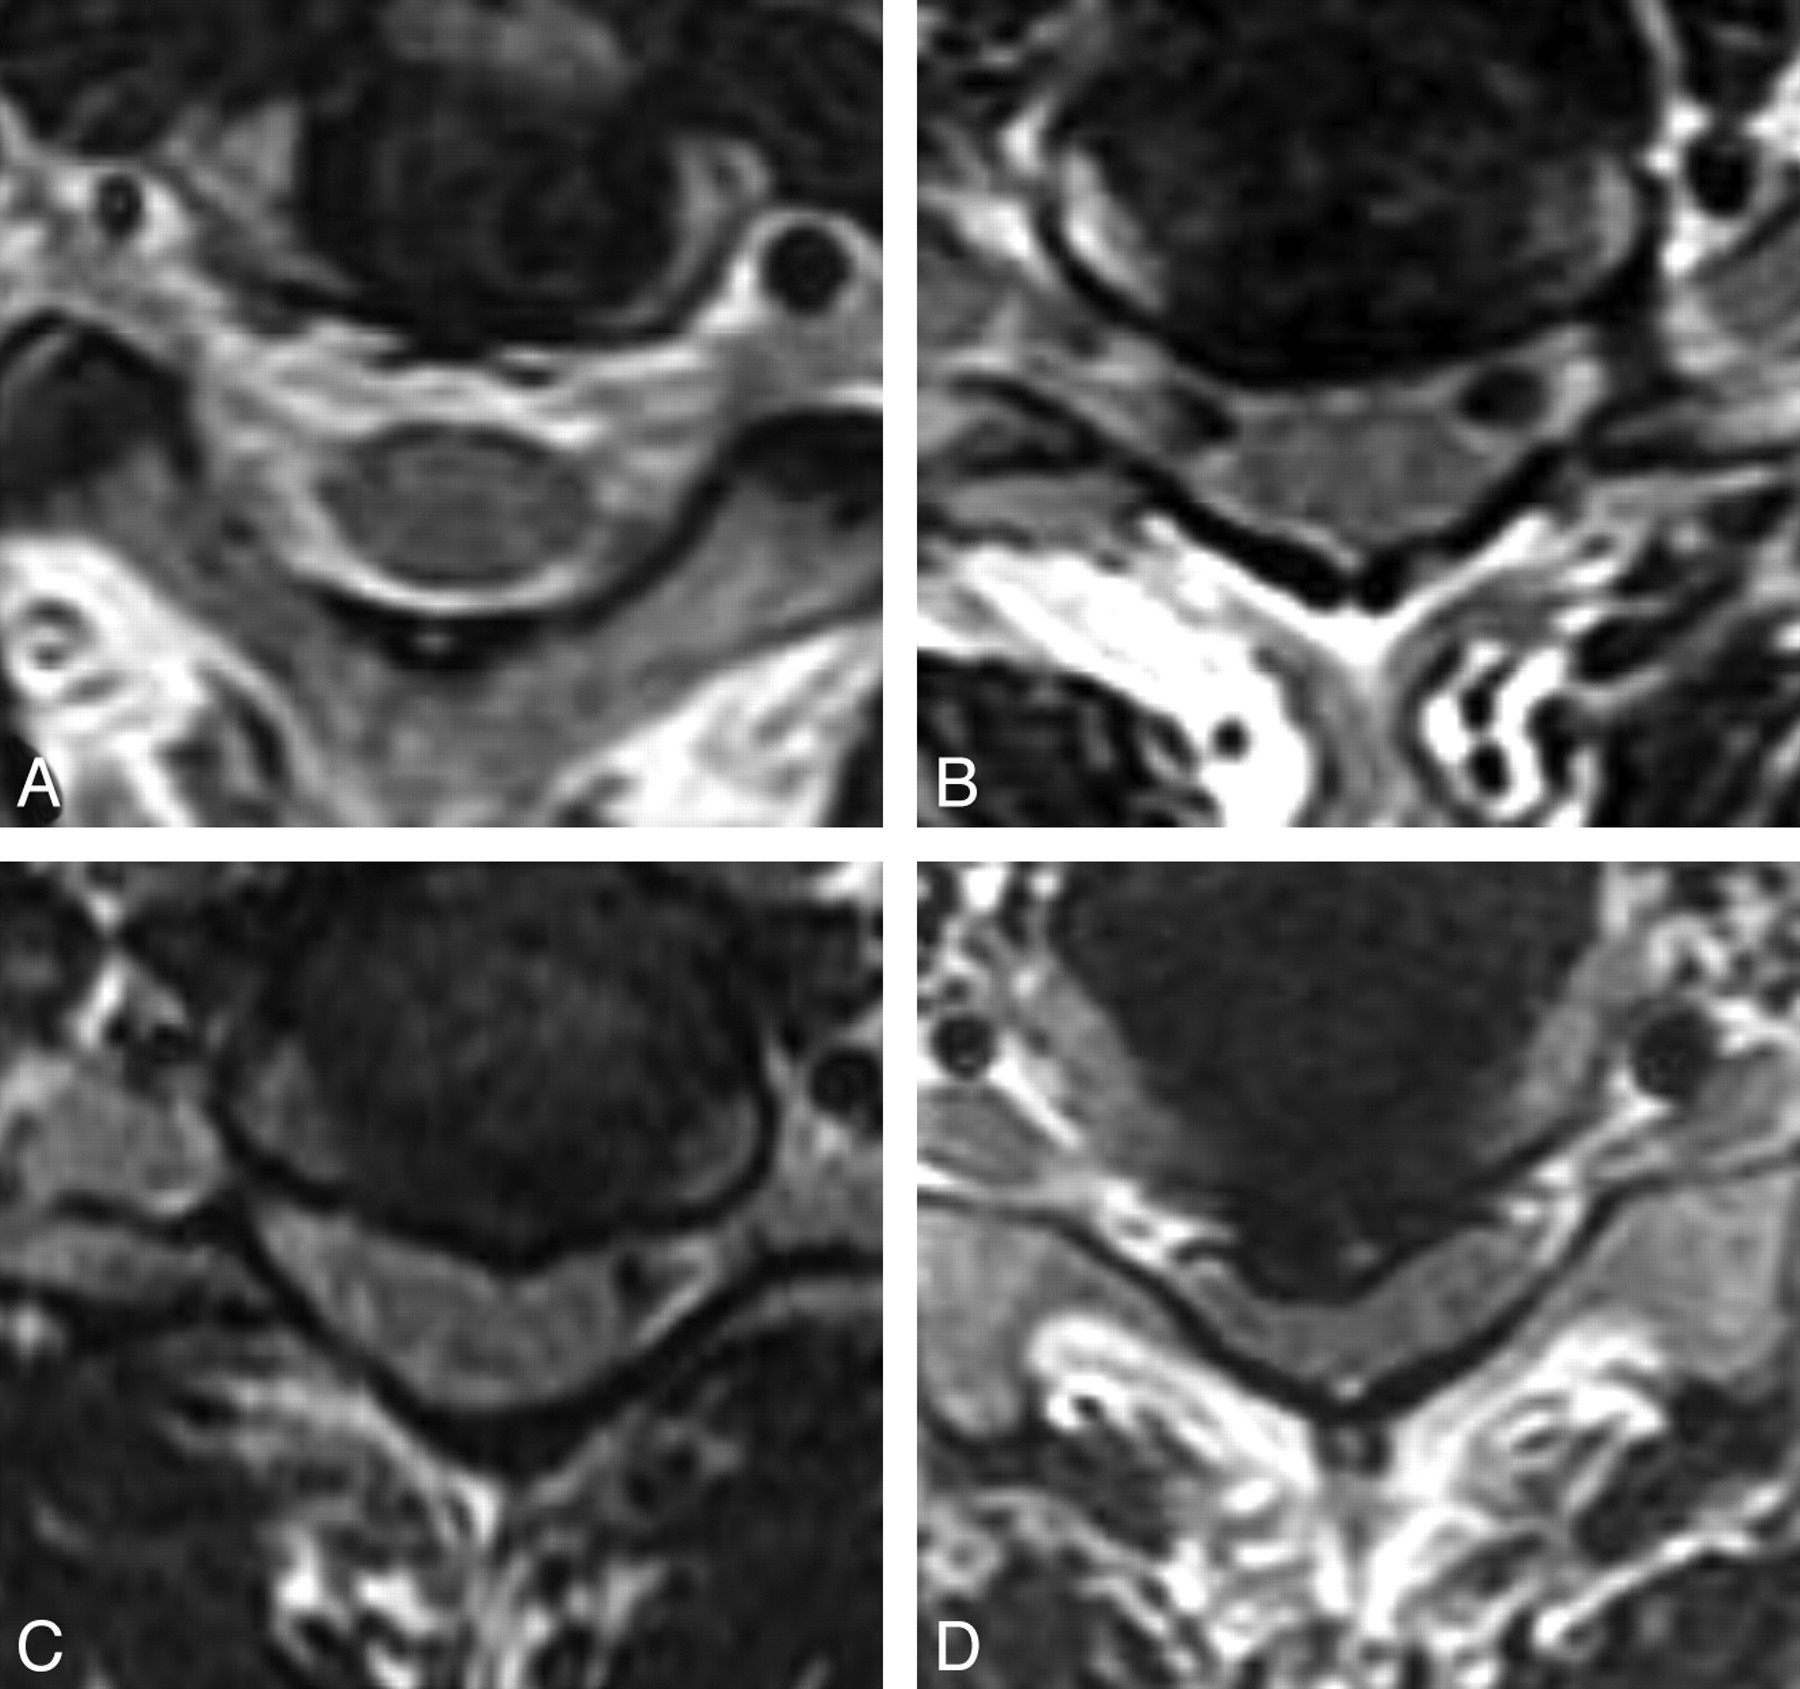
Spinal cord compression was graded on the basis of axial spin-echo MR imaging of the intervertebral levels and categorized as follows: type 0, preservation of CSF surrounding the spinal cord and no spinal cord compression; type I, no visualization of CSF space ventrodorsal to the spinal cord but no deformity of the spinal cord; type II, mild deformity of the spinal cord caused by compression; and type III, marked deformity (flattening) of the spinal cord (Fig 2). The most severe compression type in each patient was used for analysis. Intramedullary high T2 signal intensity was defined as a high-intensity area in the spinal cord observed in both axial and sagittal images.

Grades of spinal cord compression on MR imaging. Type 0 indicates no compression; type 1, disappearance of CSF space; type 2, mild compressive deformity of spinal cord; and type 3, marked deformity (flattening) of the spinal cord.
Neurologic status was assessed with the JOA scoring system for CSM (On-line Table) before and 6 months after surgery. The recovery rate of the JOA score was calculated by using the following formula: (postoperative JOA score − preoperative JOA score / 17 − preoperative JOA score) × 100.15
The relationships between the ADC value and preoperative JOA score, the JOA score recovery rate, the compression grade, and the presence of intramedullary high T2 signal intensity were assessed. The analysis was also applied to limited patients treated with French-door laminoplasty by using a ceramic spacer inserted between laminae. This method required no metal apparatus, which causes considerable artifacts on DWI. These patients were followed up with MR imaging for >6 months because the MR imaging signal intensity is frequently obscured in patients with anterior fusion with metal cages. The Mann-Whitney U test or a paired t test was used for statistical examination, and a P value ≤ .05 was significant.
Results
Preoperative MR imaging was performed in 66 patients (42 men and 24 women) from 40 to 87 years of age (mean, 65.8 ± 11.3 years). MR imaging was performed in 59 patients in the early postoperative stage and in 48 patients in the follow-up stage. Segments with severe signal-intensity loss due to artifacts or with an undetermined spinal cord due to severe deformity were excluded. Consequently, 72 segments were excluded from the postoperative assessment. Finally, MR images were analyzed for 322 segments of 66 patients in the preoperative stage, 272 segments of 59 patients in the early postoperative stage (mean, 6.88 ± 2.61 days), and 213 segments of 48 patients in the follow-up stage (mean, 7.65 ± 2.41 months). Thirty-five patients with laminoplasty were successively followed with MR imaging for >6 months after surgery.
Radiologic Factors and ADC Values
ADC values were measured twice independently by 2 examiners, and excellent reproducibility was obtained with a correlation coefficient of 0.949 (P < .0001).
Preoperative ADC values ranged from 0.315 × 10⁻³ to 1.891 × 10⁻³ mm2/s (mean, 0.813 ± 0.254 × 10⁻³ mm2/s). The mean ADC value was 0.723 ± 0.191 × 10⁻³ mm2/s in the early postoperative stage and 0.691 ± 0.145 × 10⁻³ mm2/s in the follow-up stage, showing a significant difference between the preoperative and the follow-up stages (P < .0001) (Table 1).
Chronologic changes of mean ADC values in each compression type
The grading of spinal cord compression was as follows: 140 type 0 segments, 75 type I, 74 type II, and 33 type III. ADC values tended to increase with cord compression, and a significant difference was seen between type 0 and other types. ADC values decreased after surgery in all types except type III. Accordingly, the differences in ADC values between types were reduced in the follow-up stage except between types 0 and II (Table 1).
Intramedullary high T2 signal intensity was detected in 48 segments preoperatively, and occurrence increased with the severity of compression (Table 2). The mean ADC value in the segments with high T2 signal intensity was 1.002 ± 0.305 × 10⁻³ mm2/s, and it was significantly higher than in those without high T2 signal intensity at 0.775 ± 0.126 × 10⁻³ mm2/s. The mean ADC value was significantly decreased in the follow-up stage, even in the segments with high T2 signal intensity, and no significant difference was found between groups with and without high T2 signal intensity in the follow-up stage (Table 3).
Type of spinal cord compression and occurrence of high T2 signal intensity
Chronologic changes of mean ADC values in high T2 signal intensity
Neurologic Status and ADC values
The mean preoperative JOA score of patients was 11.1 ± 3.6. The JOA score tended to decrease with the severity of compression and was significantly different between types I and III before surgery (Table 4). The mean JOA score significantly increased after surgery in all types. Recovery rates in the early postoperative stage tended to reflect the severity of preoperative spinal compression, but no significant difference was found. Patients with intramedullary high T2 signal intensity had lower preoperative JOA scores, which were related to lower JOA recovery rates in the early postoperative stage (Table 4).
Chronologic changes of mean JOA score and compression group and high T2 signal intensity
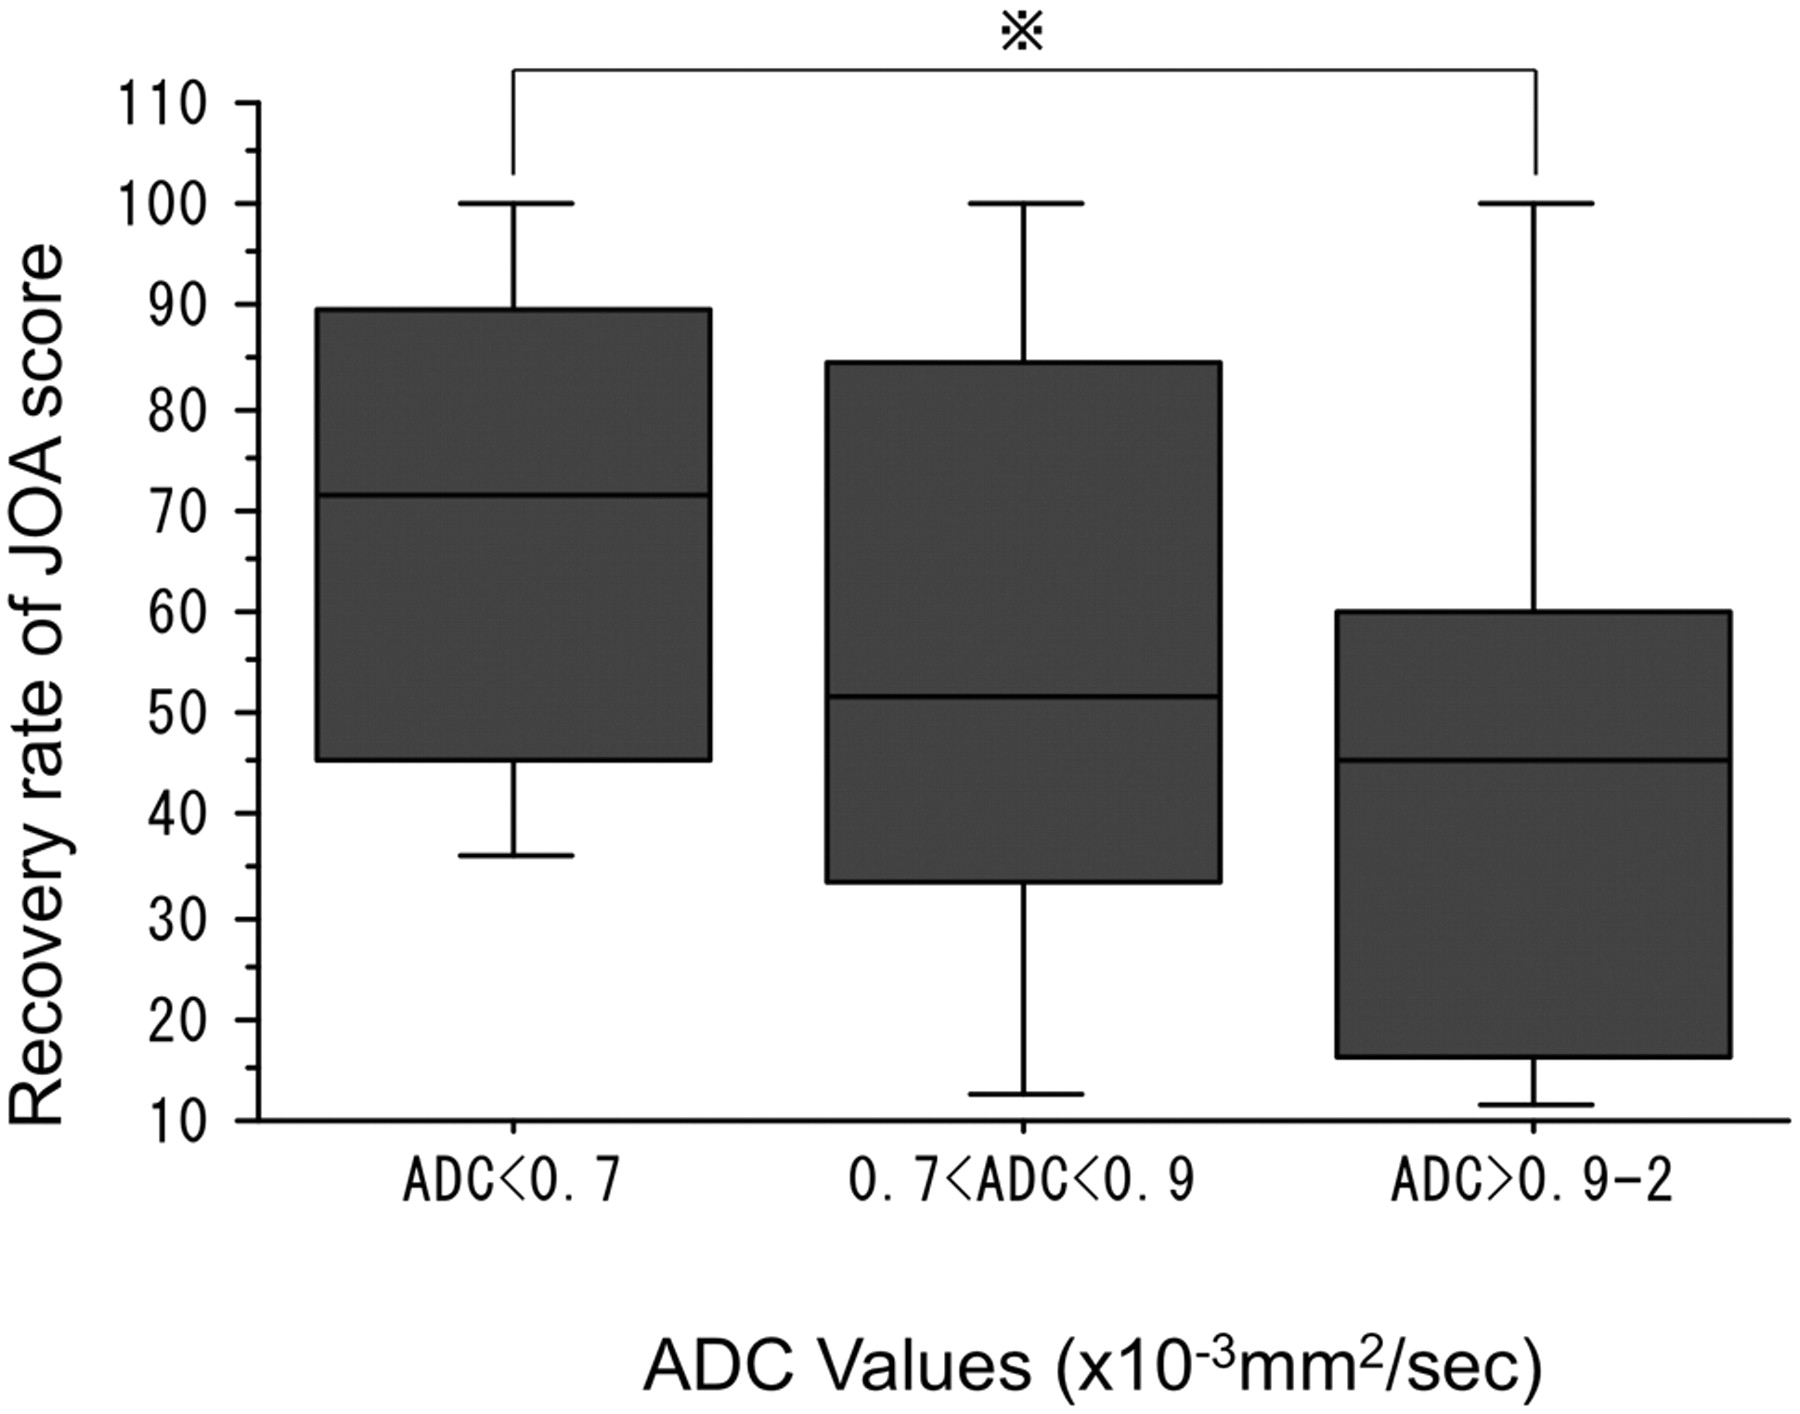
Patients with a preoperative ADC value of ≥0.9 × 10⁻³ mm2/s showed significantly lower preoperative JOA scores than those with preoperative ADC values of <0.9 × 10⁻³ mm2/s (Fig 3). A relationship was found between preoperative ADC values and postoperative JOA scores or recovery rates. Among the 35 patients with laminoplasty, patients with a preoperative ADC of <0.7 × 10⁻³ mm2/s had a better recovery rate than patients with a preoperative ADC of ≥0.9 × 10⁻³ mm2/s. However, the difference was not significant (Fig 4).

The relationship between preoperative JOA scores and ADC values in all patients. Patients with ADC values of ≥0.9 × 10⁻³ mm2/s had lower JOA scores (P = .0085).

Recovery rates of JOA scores and preoperative ADC values in 18 patients followed for >6 months. Patients with an ADC of <0.7 × 10⁻³ mm2/s tended to show better recovery rates than those with an ADC of 0.9 × 10⁻³ mm2/s (P = .0636).
We also evaluated the relationship between the maximum ADC values of each patient and other clinical factors. However, there was no significant difference.
Discussion
The present study demonstrated the relationship between the degree of spinal compression and the increase of ADC values in patients with CSM. Similarly, an increase of ADC values was measured by using a pulse-field gradient multishot echo-planar imaging sequence in a small series of patients with spinal narrowing.13 Previous studies of spinal lesions have indicated that the ADC value measured by DWI has superior sensitivity to intramedullary high signal intensity on T2-weighted MR imaging for the detection of CSM14,16 and that ADC values were higher in a narrowed spinal canal compared with a normal one.16
Chronic ischemia of the spine is speculated to cause increased permeability of the cell membrane. In addition, chronic compression of the spine is suggested to cause changes in the CSF circulation in the subarachnoid space and cause the fluid to enter the spinal parenchyma, resulting in the formation of microcysts.9 Chronic compression may lead to changes in the myelin of the spinal cord, and edematous change may occur in the early stage of spondylosis.17 Therefore, increased ADC values suggest the presence of pathologic changes caused by chronic compression.
The present study found decreases in ADC values after decompression of compressive myelopathy, which may imply that increased ADC values can be reversed, probably due to increased water in the extracellular space of the spinal cord. If the increase in ADC values is exclusively caused by cystic degeneration of the gray matter, such improvement seems quite likely. However, the mechanism of changes in ADC values must be complex, and more study is necessary.
On the other hand, a significant decrease of ADC values after decompression was not proved in type III. This may be due to irreversible change in the spinal cord in this type.
Clinical grades were significantly related to the preoperative ADC values in the present study, and patients with ADC values of ≥0.9 × 10⁻³ mm2/s had lower preoperative JOA scores. Compression grades and the presence of high T2 signal intensity were also related to preoperative clinical grades. High T2 signal intensity was proved to be a predictive factor for a poorer recovery rate during the short postoperative period, but the correlation between preoperative ADC values and JOA recovery rate was not clear.
Aota et al14 reported that ADC decreased in the level of maximal cord compression and increased in the adjacent area. We adopted the mean ADC value of 5 intervertebral levels, and consequently, such signal-intensity change might be underestimated. They speculated that a reduced ADC value might be caused by vascular compromise with cellular swelling as the initial change in the spinal cord. The contour of the spinal cord was sometimes difficult to trace on an ADC map at maximal compression. If the ADC of surrounding structures such as bone or ligaments is contaminated, the ADC value may be apparently decreased, though such a decrease was not observed in our study.
Patients with laminoplasty and ADC values of <0.7 × 10⁻³ mm2/s tended to have better recovery rates than those with ADC values of ≥0.9 × 10⁻³ mm2/s. These results suggest that measurement of preoperative ADC values can predict the functional outcome of patients with CSM. Lack of information about directional diffusivities in our study may make the relationship obscure, and further study by using directional diffusivities parallel and perpendicular to the cord may be necessary to confirm the conclusion.
Early detection of pathologic changes of the spinal cord is important to improve the surgical outcomes of patients with spondylosis. ADC values may be one of the diagnostic methods to evaluate CSM.
Conclusions
We reported that ADC values were valuable factors for interpretation of the clinical severity of patients with CSM. ADC values tended to increase with cord compression and to decrease after decompressive surgery. ADC values may indicate the severity of spinal cord compression and may predict clinical recovery after decompression surgery for spondylotic myelopathy.
References
- Received March 7, 2011.
- Accepted after revision May 28, 2011.
- © 2012 by American Journal of Neuroradiology


