
Abstract
BACKGROUND AND PURPOSE: Ischemic injury to the brain is a common complication of SCA. To better understand the neurologic impact of SCA, TBSS were applied to DTI data to investigate white matter injuries in pediatric patients with SCA.
MATERIALS AND METHODS: TBSS comparisons of a range of anisotropy and diffusion measures were carried out between age- and background-matched population groups: patients with SCA with no visible lesions, patients with SCA with mild gliosis, and normal controls.
RESULTS: TBSS analysis revealed that both SCA populations exhibited reduced anisotropy and increased diffusivity compared with normal controls in multiple brain regions, including the corpus callosum and centrum semiovale. Furthermore, the results suggest that the severity of SCA is positively correlated with the white matter changes in the corpus callosum.
CONCLUSIONS: The study demonstrates that TBSS is a viable technique in detecting subtle white matter damage in patients with SCA whose conventional anatomic MR imaging scans show no, or minimal, abnormalities and has the potential to evaluate the neurologic impact of the treatment of SCA.
ABBREVIATIONS:
- EAR
- ellipsoidal area ratio
- FA
- fractional anisotropy
- FSL
- FMRIB Software Library
- LD
- longitudinal diffusivity
- MD
- mean diffusivity
- MO
- mode of the diffusion tensor
- RD
- radial diffusivity
- SCA
- sickle cell anemia
- SCA-MG
- SCA with mild gliosis
- SCA-NL
- radiologically normal SCA
- TBSS
- tract-based spatial statistics
SCA is a hereditary red blood cell disorder that is characterized by chronic hemolytic anemia and vaso-occlusion that result in irreversible organ damage. Ischemic injury to the brain is one of the most devastating complications of SCA, with overt stroke occurring at an overall prevalence of 5%1 and subclinical infarction occurring in 24%–35% of children on screening MR imaging.2 While several studies have demonstrated neurocognitive deficits in the presence of overt3⇓–5 and silent stroke,6⇓–8 recent studies of large numbers of neurologically asymptomatic children and adults with SCA have demonstrated that cognitive impairment occurs even in the absence of brain abnormalities on conventional MR imaging.9⇓⇓–12 Even though the method of neurocognitive assessment varied in these studies, the shared evidence supports both global IQ deficits, as well as domain specific deficits, in executive function and visual-spatial memory.13 These observations support an emerging consensus that brain injury in SCA is diffuse and insidious,14 and that conventional neuroimaging often underestimates the extent of injury.
The ability of advanced neuroimaging techniques to detect subtle brain matter changes missed by conventional MR imaging has been demonstrated by several groups. Notably, Steen et al10 used segmented data from T1, T2, and proton attenuation-weighted images to detect significant difference in gray matter volumes in patients with SCA compared with healthy controls. Kirk et al15 used surface-based morphometry to demonstrate bilateral cortical thinning in children with SCA who had normal anatomy on standard MR imaging. White matter differences were found by voxel-based morphometry in patients with SCA, even in the absence of overt stroke.16 A study comparing mean MD values from patients with sickle cell with and without prior stroke showed WM “attenuation” changes in multiple anatomic regions.17 While these studies support diffuse, multiregional gray matter and WM injury in SCA, the location and extent of abnormalities are inconsistent. Registration error from data segmentation and alignment may account for some of these differences.18 In addition, group heterogeneity, either as result of incompletely matched controls or limited exclusion criteria for the patients, may have distorted the detected levels of significance.
TBSS is an analysis technique that can be applied to the data derived from DTI and has been utilized to investigate many neurologic disorders.19 It enables the investigation of white matter damage from a totally different perspective compared with standard morphometry, as it registers the white matter, as opposed to the whole brain, between subjects, resulting in improved registration, and overcomes the uncertainty about the extent of smoothing. TBSS allows diffusion measure(s) to be compared statistically among many groups based on permutation testing.19 The technique registers all individual FA maps to a common template and then applies the resulting transformations to any measure derived from the tensor analysis. Regionally specific reductions in anisotropy and/or increases in diffusivity are generally interpreted as indications of changes in the white matter in the form of demyelination or changes in number and attenuation of axons. Unfortunately, as the number of axons/axon attenuation and myelin volume are often related, the separation of the contributing factors is problematic.
The purpose of this study was to evaluate and compare the ability of multiple diffusion measures to detect subtle changes in the WM integrity in 3 pediatric population groups: 1) normal controls, 2) SCA-NL subjects, and 3) SCA-MG subjects. We hypothesized that the different measures derived from the DTI data, which probe different aspects of the white matter structure, would provide complementary information on the white matter injury occurring in SCA, allowing the severity of the disease to be assessed.
Materials and Methods
Participants
The study was institutional review board–approved and included both prospective and retrospectively acquired data. For the prospective study, the SCA-NL subjects had the homozygous form of SCA, no history of stroke, normal blood velocities on routine screening with transcranial Doppler sonography, and no reported developmental delay. In addition, any prior neuroimaging performed as part of their standard of care had to be normal. The lower age limit for this study was chosen as 10 years, and the upper limit was 21 years. To limit potential confounds, the control group was composed of siblings or demographically matched peers of children in the prospective SCA-NL group, who either had the sickle cell trait or were healthy, and had no history of serious illness, brain surgery, or developmental delay. The SCA-MG subjects were identified either during the evaluation of SCA-NL candidates or retrospectively from standard of care examinations performed on children with SCA (which included the DTI sequence). The retrospective SCA-MG subjects were chosen so as to achieve the best age match between the control and SCA-NL groups. All anatomic images from all study subjects were read by experienced pediatric radiologists to verify the absence of radiologically evident pathology in either the normal controls or the SCA-NL subjects. In the cases where gliosis was detected, a second pediatric neuroradiologist with specific expertise in white matter disease independently confirmed the diagnosis of mild gliosis and graded the severity of the gliosis.
Neuropsychology
Neuropsychological testing was administered to SCA-NL subjects, controls, and a portion of SCA-MG patients. The variables involved in this study include demographic information, including general intelligence, executive functioning, and attention. A measure of intelligence was obtained using the 2-subtest version of the Wechsler Abbreviated Scale of Intelligence, which provides a quick and accurate estimate of intellectual functioning. The Delis-Kaplan Executive Functioning System was used to measure executive functioning and a computerized measure, Conners' Continuous Performance Test, 2nd ed., was used to investigate attention.
Image Acquisition
MR images from all participants were acquired on 3T Trio scanners (Siemens, Erlangen, Germany); the control and SCA-NL groups were all scanned on a single scanner. To maximize the number of potential subjects for the SCA-MG group, patients scanned on either of 2 Trio scanners were reviewed. Both scanners are equipped with the same hardware, run the same software, and give comparable SNR values in the American College of Radiology Quality Assurance tests. Standard clinical diagnostic sequences, including T1 3D magnetization-prepared rapid gradient echo (TR/TE/TI = 2300/2.98/900), T2 (TR/TE = 5500/75), FLAIR (TR/TE/TI = 9000/86/2500), and a TOF MRA were used by the neuroradiologist for clinical diagnosis and verification of subject conditions. For the DTI data, we used an EPI sequence with 5 b = 0 scans and 30 directions with b = 1000 seconds/mm2 in an axial plane with TR/TE = 8900/96, a parallel imaging factor of 2, and a nominal spatial resolution of 2 mm3.
Data Analysis
The imaging data from each subject were assigned to one of the following groups: controls, SCA-NL, SCA-MG, or rejected. The data were rejected from the prospective study if any pathology other than mild gliosis was identified. The TBSS processing of the data was performed using the software routines in the FSL (http://www.fmrib.ox.ac.uk/fsl). The DTI data were first converted from Siemens DICOM format to the Neuroimaging Informatics Technology Initiative (NIfTI) format and were then input into FSL to correct for eddy current effects, to align the diffusion volumes, and to then calculate the diffusion tensor. In addition to the regular DTI measures generated by FSL, the RD and EARs20 were generated using in-house software written in Matlab (Mathworks, Natick, Massachusetts). The RD was computed as the arithmetic average of the second and third eigenvalues. The EAR, with value ranges from 0 to 1, has recently been shown to have superior SNR and comparable contrast-to-noise ratio to the FA.20 The different indices of anisotropy (FA, MO, and EAR) reflect the anisotropy of water diffusion in WM fibers, but there are subtle differences in how particular aspects of the anisotropy affect each of these indices. To prepare the FA, MD, longitudinal diffusivity (first eigenvalue), RD, MO, and EAR data for voxelwise statistical analysis in TBSS, the FA images were skull-stripped and then aligned into the common Montreal Neurological Institute space using nonlinear registration. A mean FA image was created and thinned to create a mean FA skeleton representing the centers of all tracts common to the group. Each subject's aligned FA (or any other DTI measure) was then projected onto this skeleton and the resulting data fed into voxelwise cross-subject statistics.
The group statistical comparison was performed using the general linear model and randomize tool available in FSL. Firstly, a general linear model with 2 explanatory variables, group (control, SCA-NL or SCA-MG) and age (continuous variable), was set up. The contrasts of interest are the differences between group means, whereas age was treated as a confounding variable and regressed out. Six contrasts of interests were generated and analyzed in the current study: control minus SCA-NL, control minus SCA-MG, SCA-MG minus SCA-NL, SCA-NL minus SCA-MG, SCA-NL minus control, and SCA-MG minus control. A thousand permutations were performed for each contrast to test for statistically significant differences in the DTI measures. To alleviate the multiple comparison issues associated with voxelwise statistics, threshold-free cluster enhancement filtering21 was used when generating the statistical map and a 95% significance level was chosen for statistical inference. In several instances, a lower threshold was used to test for trends in the data.
To study the changes in diffusion in more detail, a region of interest was defined in the corpus callosum, which encompassed most of the left, center, and right corpus callosum, and which was not restricted to the region bounded by the mean FA skeleton. The region of interest was extracted from coregistered DTI maps with the fslroi tool from the FSL suite of programs and analyzed with custom Matlab codes. As fslroi only allows cuboid ROI extraction, it was necessary to restrict the size of the region of interest to minimize partial volume effects. The FA, MD, RD, MO, and EAR values were calculated for all subjects.
Results
Demographic Information
All participants in the current study identified themselves as African Americans. The demographics of each of the 3 groups are summarized in Table 1. A previously published classification22 was adopted to define the SCA-MG group. Subjects with no visible lesion (grade 0) were assigned to the SCA-NL group; those with mild gliosis (grade 1) were assigned to the SCA-MG group. Mild gliosis was defined as a few small areas of elevated signal intensity on T2-weighted imaging with no associated volume loss. Subjects with moderate to severe gliosis, asymptomatic/symptomatic lacunae, or infarction (ie, grades 2–4) were considered to represent more severe forms of the disease and were excluded. The biomarkers of disease (total hemoglobin, white blood cell count, and percent fetal hemoglobin) were not statistically different for the 2 SCA groups.
Demographic and neuropsychological data
Neuropsychology
Because neuropsychological test scores were only available for 33% (5 of 15) of the patients with SCA-MG, the results for this group are excluded from the statistical analysis. One patient with SCA-NL did not participate in neuropsychological testing for personal reasons. Therefore, our neuropsychological results were based on the 15 controls and 14 patients with SCA-NL. Independent samples t tests revealed significant mean differences between the SCA-NL and control groups in full-scale, but not verbal, IQ scores (Table 1). Specifically, on full-scale IQ, the control group mean (standard score) of 107.5 (±14.95), was significantly greater (P = .025) than the score of 98.1 (±9.16) from the SCA-NL group. This difference is consistent with previous studies indicating that children with SCA significantly underperform their typically functioning peers on measures of intellectual functioning, even in the absence of radiographic abnormality by conventional MR imaging of the brain. Similarly, on a commonly used computerized measure of sustained attention (Conners' Continuous Performance Test, 2nd Edition), patients with SCA-NL (M [mean age] = 58.51, ±25.79) performed significantly more slowly (P = .039) than controls (M = 39.80, ±7.63). On executive functioning measures, results (Delis-Kaplan Executive Functioning System) indicated that patients with SCA-NL performed significantly more poorly in areas of cognitive flexibility (M = 88.75, ±17.94, P = .023), speeded naming (M = 91.88, ±13.52, P = .042), and inhibition (M = 90.63, ±15.59, P = .041) compared with controls (M = 100.77, ±7; M = 103.33, ±14.67; M = 101.67, ±9.85, respectively).
TBSS Analysis
Anisotropic Measures.
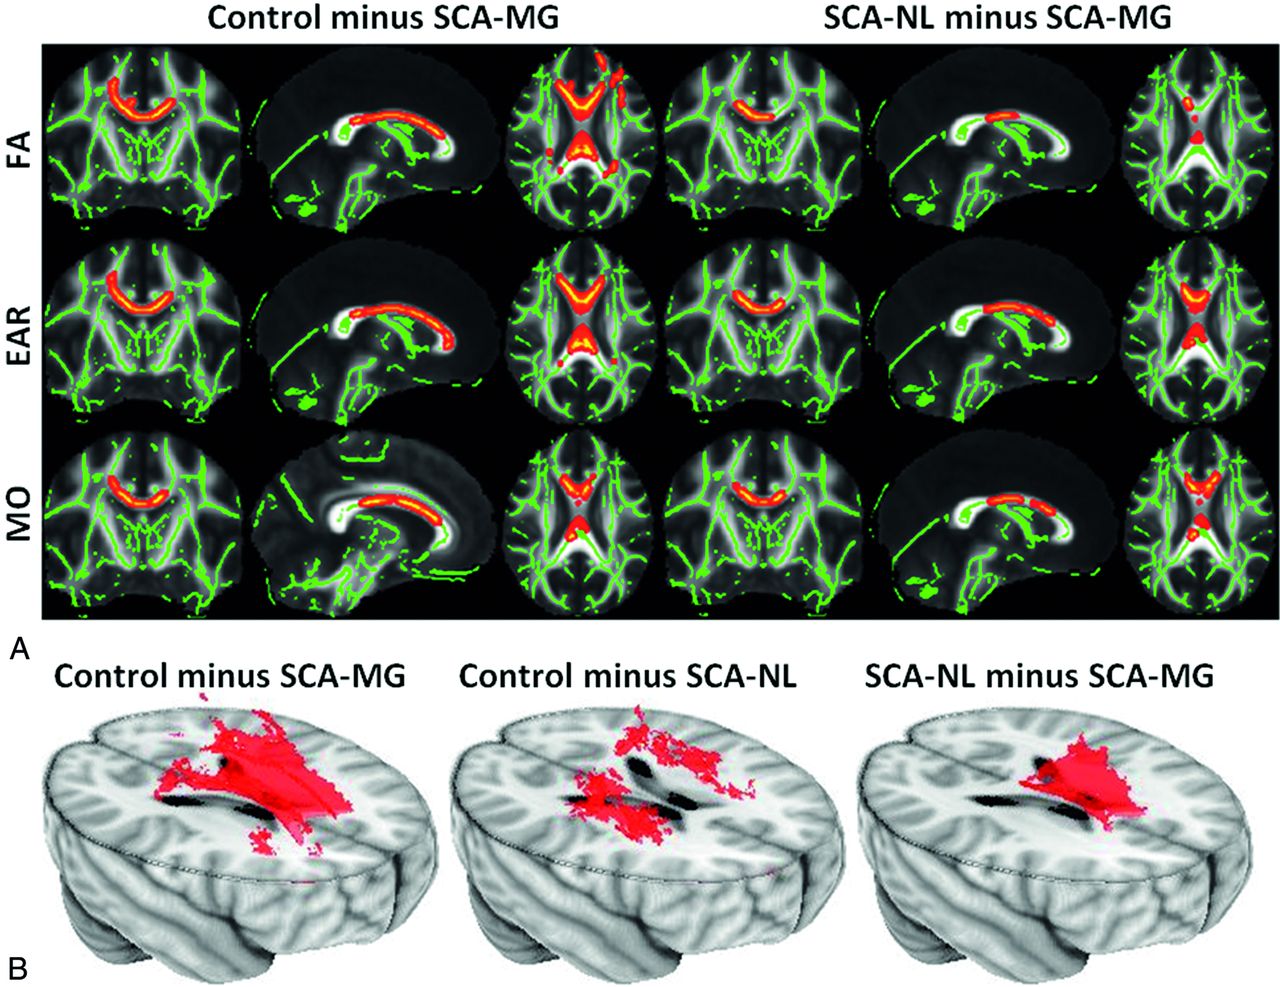
The different anisotropy measures gave converging results, but with some variability between regions. No areas of significantly increased anisotropy were identified in the 2 SCA groups, compared with the control group. Significant reductions in anisotropy were found in the SCA-MG group compared with control and SCA-NL groups for all 3 measures. Fig 1A shows the FA, EAR, and MO images for the control minus SCA-MG and SCA-NL minus SCA-MG contrasts. Reduced anisotropy occurred in the corpus callosum; in agreement with the previous study of Baldeweg et al.16 The extent of the reduction in anisotropy for the SCA-MG group was more prominent, indicating that the magnitude of injury is greater in these patients. Significant anisotropy reduction occurred in corpus callosum (body, genu, and portions of the splenium) and centrum semiovale (posterior, superior, and anterior) for the control minus SCA-MG contrast. In contrast, a reduction was only detectable in the body and the posterior genu of corpus callosum in the SCA-NL minus SCA-MG contrast. None of the areas identified by the control minus SCA-MG contrast showed a significant reduction for any of the 3 anisotropy measures comparing the patients with SCA-NL to the controls. The small sample size may have reduced our ability to detect differences between the groups. For this reason, we also analyzed the data by using a reduced threshold to determine whether any trends were present in the data. Slightly reducing the level of significance for the statistical testing to 90% for the control minus SCA-NL contrast caused most of these regions that were significant for the control minus SCA-MG contrast, except for the body of corpus callosum, to achieve significance. In Fig 1B 3D views of the control minus SCA-MG, the control minus SCA-NL, and the SCA-NL minus SCA-MG contrasts at 90% significance level for the FA are shown. No other contrast measured by any of the 3 anisotropy measures identified significant changes between any 2 of the 3 groups.

A, The control minus SCA-MG (left panel) and the SCA-NL minus SCA-MG (right panel) contrasts derived with FA (upper row), EAR (middle row), and MO. The tracts (thickened for better visualization) exhibiting significant anisotropy reduction were overlaid on top of the skeletonized WM tracts (green lines). The anisotropy reduction was identified in corpus callosum (body, genu, and part of splenium) and centrum semiovale (posterior, superior, and anterior) for the control minus SCA-MG contrast. In contrast, a reduction was only detectable in the body and the posterior genu of corpus callosum in the SCA-NL minus SCA-MG contrast. B, The 3D views of the control minus SCA-MG (left), the control minus SCA-NL (middle), and the SCA-NL minus SCA-MG contrasts at the 90% significance level using the FA. The body of corpus callosum exhibited a trend toward reduced anisotropy only in the patients with SCA-MG, while patients with SCA-NL exhibited anisotropy reduction mainly in the centrum semiovale (not statistically significant at a 95% confidence level).
Diffusivity Measures.
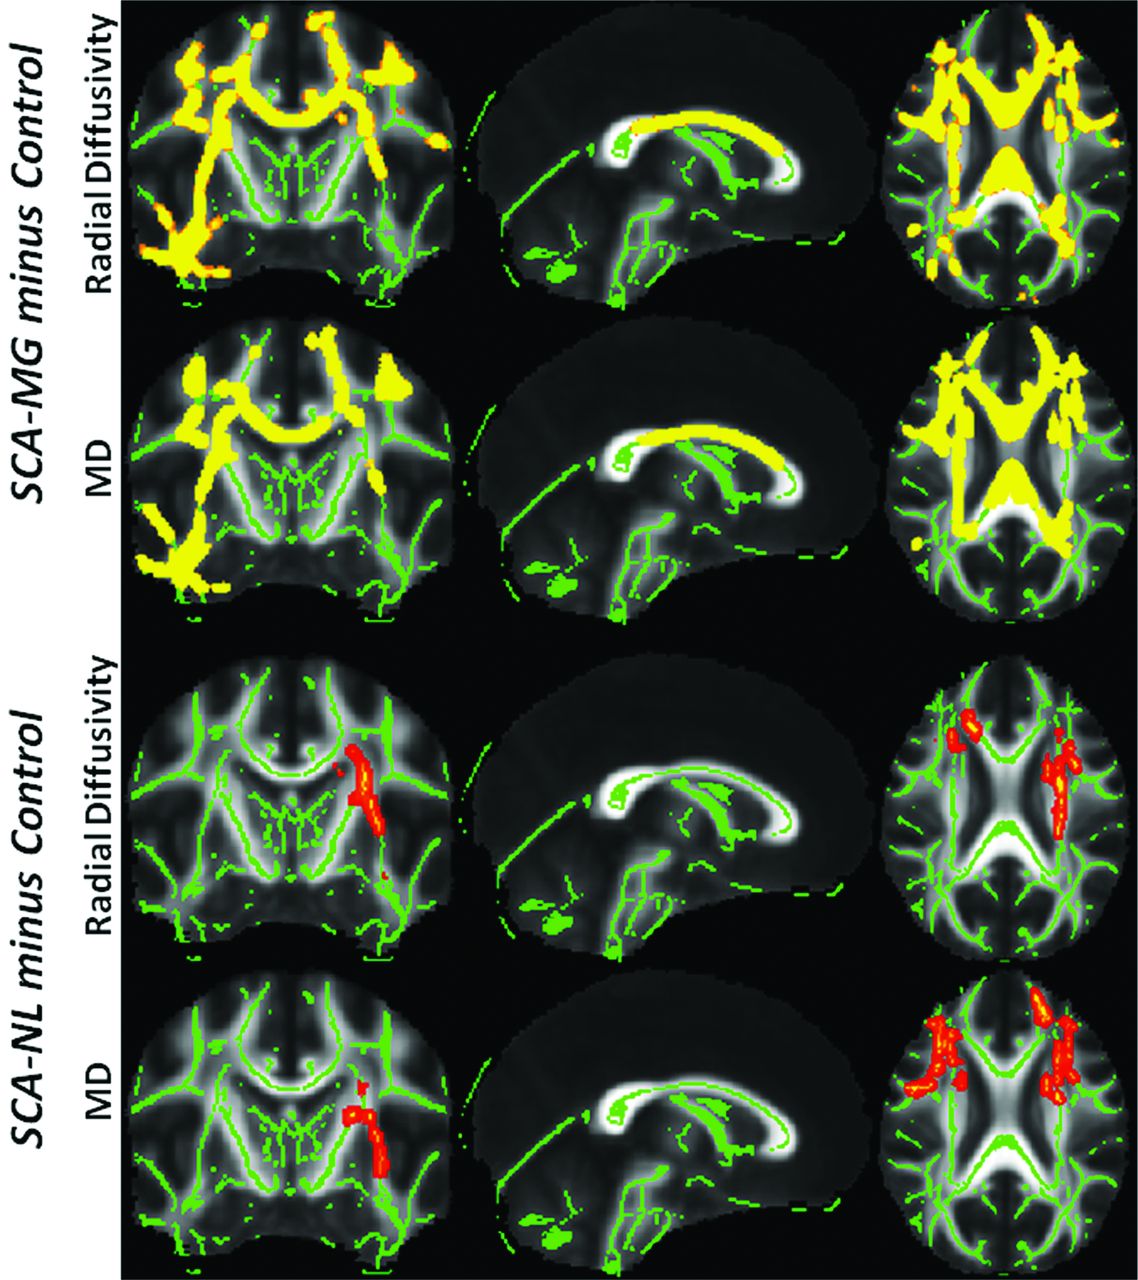
The 3 diffusivity measures explored in the current study are MD, LD, and RD. The MD linearly combines the information from the longitudinal and radial diffusivities. There were no significant decreases in the RD, LD, or MD in either of the 2 SCA groups compared with the controls, nor were there any regions of significantly increased LD for any of the contrasts, which implies that SCA does not alter significantly the diffusivity along the fiber. For both MD and RD, the 2 contrasts where significant differences were detected were SCA-MG minus control and SCA-NL minus control. The RD and MD contrasts showed comparable results, as the MD essentially becomes a “proxy” of RD when there is no significant change in the LD. In the SCA-MG group (first and second rows in Fig 2), the increase in diffusivity was extensive and spanned from corpus callosum to peripheral tracts. The increased diffusivity in patients with SCA-NL (third and fourth rows in Fig 2) was more moderate and occurred primarily in the left centrum semiovale. At the 95% confidence level, no statistically significant increase of diffusivity was identified when contrasting SCA-MG to SCA-NL groups. When reducing the significance level to 85% a trend toward increased diffusivity was identified in the corpus callosum for the patients with SCA-MG.

For both SCA groups, tracts (thickened for better visualization) exhibiting significant diffusivity enhancement were overlaid on top of the skeletonized WM tracts (green lines). In the SCA-MG group (first and second rows), diffusivity increase was extensive and spans from corpus callosum to peripheral tracts including the fasciculus. The increase of diffusivity in the patients with SCA-NL (third and fourth rows), in contrast, was more moderate, primarily in the left centrum semiovale. At the 95% confidence level, no statistically significant increase of diffusivity was identified when contrasting SCA-MG to SCA-NL groups. However, when reducing the significance level to 85%, a trend toward increased diffusivity was identified in the corpus callosum for the patients with SCA-MG.
Overall, increased radial and mean diffusivities were observed not only in all the regions identified by anisotropy measures but also in adjacent regions for both patient groups. However, it should be noted that no significant radial and MD changes were observed at the default 95% confidence level when contrasting SCA-MG and SCA-NL groups, though reduction of anisotropy was noticed in the same contrast (Fig 1A). Table 2 summarizes the major cortical regions that exhibit reduced anisotropy and/or elevated diffusivity in the patients with SCA for the various DTI measures.
Summary of main regions exhibiting reduced anisotropy and increased diffusivity in patients with SCA compared with the control population
Region-of-Interest Analysis
The region-of-interest analysis was conducted as an alternative method of examining the DTI values in the corpus callosum. Rather than constraining the analysis to the FA skeleton identified by the TBSS analysis, the region of interest reports the results of all voxels included in a 50 mm (left-right) × 120 mm (anterior-posterior) × 10 mm (superior-inferior) region (in the standard Montreal Neurological Institute space) that covers most of the left, middle, and right corpus callosum. The mean and standard deviation of the FA, EAR, MO, and MD values for all 3 groups are reported in Table 3. When contrasting SCA-NL and control groups, MD was the only metric that identified statistically significant differences (with higher MD for the SCA-NL group). An additional comparison between the SCA-NL and SCA-MG groups using this metric revealed the latter has statistically higher MD (P < .001). Overall, a trend of decreasing anisotropy and increasing MD was identified as the disease progressed from the control to the SCA-NL to the SCA-MG stage, consistent with the TBSS results.
Mean and standard deviations of the FA, EAR, MO, and MD values of the ROI measurements
Discussion
In the current study, we applied TBSS analysis to multiple DTI measures for both groups of patients with SCA and matched controls. The SCA-NL group contains patients with no visible lesions, while the SCA-MG group is composed of patients with small regions of mild gliosis who are considered to be at increased risk of stroke and cognitive deficits. The purpose of this study was to examine the following questions: 1) Is TBSS a viable technique for detecting WM injuries in patients with SCA, especially those with radiologically normal brains? If so, where are the affected WM regions located? 2) How do TBSS analyses on different DTI measures compare in evaluating the neurologic consequences of SCA?
WM Modifications in Patients with SCA
This study demonstrates that TBSS is capable of detecting subtle WM damage in patients with SCA in whom conventional anatomic MR imaging scans showed either no (SCA-NL) or minimal (SCA-MG) abnormalities. In general, the modified WM regions showed changes in 1 or more measures of anisotropy and increased radial (and mean) diffusivity in the patients with SCA. Notably, the centrum semiovale, which connects many cortical structures with the anterior cingulate cortex, was affected and the WM changes in this region may contribute, in part, to the processing deficits observed in SCA.
The changes in anisotropy and diffusivity could imply myelin loss, due to injury, myelin changes in the context of abnormal myelin development, due to chronic inflammation and anemia, or a change in axonal architecture. Animal studies have shown that changes in the number of axons/axon attenuation and the myelin volume often occur in parallel, making it difficult to separate out these effects.23,24 In a complex disease, such as SCA, where inflammatory endothelial and tissue injury is an important component of the disease, it is unclear how directional diffusivities relate to specific insults. In addition, care must be taken when using axial or radial diffusivity in areas in areas of low anisotropy, in voxels affected by partial volume, in areas of crossing fibers, or where the diffusion ellipsoid is oblate, because the eigenvalues of the diffusion tensor do not necessarily reflect the same underlying structural characteristics in different datasets, due to a different orientation of the corresponding principal eigenvector. Whether the measured direction of the principal eigenvector differs between subjects because of pathology, crossing fibers, or residual misalignment, any comparisons between subjects of the average of the second and third eigenvalues can be meaningless, as the same physical quantity may represent different biophysical substrates in different diffusion tensor datasets. This may be the result of a real change of the main structure, a sorting bias, or simply the effect of structural differences between subjects not eliminated by the registration step.25 It should be noted that age was treated as a cofounding factor and regressed out of our analysis. This approach was adopted because it is known that multiple white matter regions exhibit age-dependent changes in RD and anisotropy throughout adolescence.26
The Severity of SCA Condition and WM Injuries
Our analysis revealed many differences in the pattern of WM modification between different stages of SCA (SCA-NL vs SCA-MG). For the SCA-NL subjects, only tracts of the centrum semiovale showed a statistically significant reduction in MD and RD. In contrast, both decreased anisotropy and increased diffusivity were detected in additional WM regions for the SCA-MG subjects, implying disease severity is inversely related to WM integrity.
The primary region of divergence between the SCA-MG and SCA-NL groups was the body of corpus callosum, where the SCA-MG subjects showed significantly lower anisotropy (and a trend toward increased diffusivity) than the patients with SCA-NL. The SCA-NL group also exhibited a trend toward reduced anisotropy in the centrum semiovale. In a voxel-based morphometry study, Baldeweg et al16 observed that this region showed more extensive WM “attenuation” decline in subjects with SCA with silent infarction than in patients without lesions. Our findings support this result and imply that the observed “attenuation” decreases might be due to structural changes in the WM. Another relevant finding from earlier research is that corpus callosum size was smaller for children with SCA with silent and overt stroke compared with both those without visible infarcts and normal controls.27 Together, these studies support the hypothesis that the morphologic and diffusion properties of the corpus callosum may serve as markers for the severity of SCA.
Comparisons of DTI Measures
Our results imply that the different DTI measures offer different sensitivity in detecting changes in WM integrity. All the measures used in the context of this study are derivatives of the 3 eigenvalues from the diffusion tensor matrix. Diffusivities are simply linear combinations of the eigenvalues, whereas anisotropic measures are more complex (generally nonlinear) transformations that capture the disparities of the diffusivities. Both radial and mean diffusivities exhibit better sensitivities than anisotropic measures in the group comparison between patients with SCA-NL and the controls; however, both diffusivity measures failed to identify differences between SCA-NL and SCA-MG groups at the standard (95%) significance level and were inferior to anisotropic measures in this respect. Of the anisotropic measures, EAR appears to be most sensitive, followed by MO, and then FA (Table 2). EAR was only recently developed and has been shown to provide similar contrast-to-noise ratio, but better SNR, than FA on both simulated and real-world datasets. The current study supports this claim. These findings should, however, not be used simply to rank DTI measures, because they reflect different characteristics of the diffusion ellipsoid. Rather, a more comprehensive understanding of WM injury can be achieved when multiple measures of anisotropy are compared.
Limitations and Future Research
A major limitation of the current study is the comparatively small sample size for the study population. In order for the groups to be homogeneous and comparable, we used strict selection criteria. As a result, we were only able to enroll 15 participants for each of the 3 study groups. This limitation makes our comparison results sensitive to the possible outliers in the data, though the extent and strength of statistical results makes it highly unlikely that a handful of outliers will significantly skew the results. Finally, the technical limitation of TBSS restricts the application of this technique to only group-level study and hence an individual level analysis could not be performed. Despite such restrictions, TBSS analysis still provided an insight into the neurologic complications of SCA and can potentially be used as a valuable tool for assessing SCA treatment.
Conclusions
TBSS appears to be a viable technique for detecting subtle WM damage in patients with SCA whose conventional MR imaging scans show no (SCA-NL) or minimal (SCA-MG) abnormalities. Furthermore, applying TBSS to multiple DTI measures yields complementary information that aids in the evaluation of WM injuries in patients with SCA. Further investigations using TBSS are warranted in an effort to identify subtle white matter changes, thereby assisting in both the diagnosis and assessment of treatment response in children with SCA.
Footnotes
EBM2 indicates Evidence-Based Medicine Level 2 as designated by peer reviewers.
References
- Received December 1, 2011.
- Accepted after revision March 5, 2012.
- © 2012 by American Journal of Neuroradiology
In this issue


Jump to section
Related Articles
Cited By...
- Cerebral Oxygen Metabolic Stress, Microstructural Injury, and Infarction in Adults With Sickle Cell Disease
- White matter integrity and processing speed in sickle cell anemia
- Regional oxygen extraction predicts border zone vulnerability to stroke in sickle cell disease
- Silent cerebral infarction: Not so silent after all
- Differences in Activation and Deactivation in Children with Sickle Cell Disease Compared with Demographically Matched Controls
- White Matter Damage Relates to Oxygen Saturation in Children With Sickle Cell Anemia Without Silent Cerebral Infarcts
- A Prospective Longitudinal Brain Morphometry Study of Children with Sickle Cell Disease
- Cerebral Diffusion Tensor MR Tractography in Tuberous Sclerosis Complex: Correlation with Neurologic Severity and Tract-Based Spatial Statistical Analysis