
Abstract
BACKGROUND AND PURPOSE: Fatigue affects up to 90% of patients with MS. We assessed the regional distribution of lesions and atrophy of the normal-appearing WM and GM in patients with RRMS with fatigue compared with HC and patients with similar characteristics, but without fatigue.
MATERIALS AND METHODS: From 14 patients with RRMS without fatigue, 10 with RRMS with fatigue, and 14 HC, we acquired brain dual-echo and high-resolution T1-weighted scans. Voxel-wise distributions of GM, WM damage, and T2 lesions were compared between patients with fatigued and nonfatigued MS by using SPM5 software. We report results at P < .05, FWE corrected.
RESULTS: T2 lesion distribution and regional WM atrophy did not differ between patients with fatigued and nonfatigued MS. Compared with HC, patients with MS had significant WM atrophy in the posterior part of the corpus callosum and significant GM atrophy of the left superior frontal sulcus, left precentral gyrus, posterior cingulate cortex, right thalamus, and left middle frontal gyrus. No additional areas of atrophy were found in patients with nonfatigued MS compared with HC, whereas patients with fatigued MS also had atrophy of the left central sulcus. Atrophy in the left central sulcus and the precentral gyrus was more severe in patients with fatigued versus nonfatigued MS. In patients with MS, significant correlations were found between fatigue severity and GM atrophy in the left precentral gyrus (r = −0.73, P < .0001 uncorrected).
CONCLUSIONS: Atrophy of the primary sensorimotor area is likely to contribute to MS-related fatigue.
Abbreviations
- DARTEL
- Diffeomorphic Anatomical Registration Through Exponentiated Lie Algebra
- EDSS
- Expanded Disability Status Scale
- FSS
- Fatigue Severity Scale
- FWE
- family-wise error
- GM
- gray matter
- GMV
- gray matter volume
- HC
- healthy controls
- ICV
- intracranial volume
- LPM
- lesion probability map
- LV
- lesion volume
- MNI
- Montreal Neurologic Institute
- MPRAGE
- magnetization-preparation rapid gradient echo
- MS
- multiple sclerosis
- NBV
- normalized brain volume
- RRMS
- relapsing-remitting MS
- SPM
- statistical parametric mapping
- WM
- white matter
- WMV
- white matter volume
Fatigue, defined as an overwhelming sense of tiredness, lack of energy, or feelings of exhaustion,1 is a frequent and disabling symptom in patients with MS, affecting up to 90%. Considering the impact that MS-related fatigue has on working activities and quality of life,2 we believe that the clarification of the factors associated with it and the identification of valuable markers to monitor its progression are critical issues because they might lead to future therapeutic strategies.
Dysregulation of the immunologic system, abnormalities of neuroendocrine and neurotransmitter profiles, impaired nerve conduction, and energy depletion are among the factors that have been proposed to explain MS-related fatigue.2,3 Due to its sensitivity to MS abnormalities, MR imaging has also been used to improve the understanding of the factors related to this disabling symptom. Seminal studies failed to find a relationship between the presence and severity of fatigue in patients with MS and several MR imaging−derived quantities, such as the presence and number of gadolinium-enhancing lesions,4 T2-visible lesion burden,5 the severity of brain atrophy,5 and microscopic damage to the normal-appearing WM6 and GM, as a whole.7
Conversely, the application of functional imaging techniques, including positron-emission tomography8 and functional MR imaging,9–12 has demonstrated abnormalities of functions in several cortical and subcortical areas, mainly located in the frontal lobes and basal ganglia in patients with fatigued MS compared with HC and those with nonfatigued MS, suggesting that fatigue in MS might be related to a dysfunction of distinct corticosubcortical circuits. Voxel-wise assessment of the topographic distribution of damage in the different compartments of the central nervous system is an appealing strategy for defining whether such functional changes might be associated with structural changes in critical brain regions or pathways of patients with fatigued MS.
Against this background, we hypothesized that the involvement of selected brain regions might contribute to explaining, at least partially, fatigue in patients with MS. To this aim, we applied a whole-brain voxel-wise analysis to assess the patterns of regional distribution of lesions, as well as atrophy of the normal-appearing WM and GM in patients with RRMS and fatigue compared with HC and patients with similar clinical characteristics, but without fatigue. The correlation between the regional distribution of damage and the severity of fatigue was also assessed.
Materials and Methods
Subjects
We studied 24 patients with RRMS13 and 14 sex- and age-matched HC (8 men, 6 women; mean age = 38.7 years, range = 21–54 years) with no history of neurologic and psychiatric disease, no complaint of fatigue, and normal neurologic examination findings.
To be included, patients had to have the following: 1) absence of clinical relapses for at least 6 months before the study entry; 2) no concomitant therapy with antidepressants, psychoactive steroids, or other immunomodulant/immunosuppressive drugs; 3) no mood or sleep disorders and no evidence of depression (assessed by using the depression rating scale of Montgomery and Asberg14); 4) no or only mild overall neurologic impairment, defined as an EDSS15 score of ≤2.0; and 5) no other major medical conditions or substance abuse. These inclusion criteria were used to minimize the effect of possible confounding factors (such as the presence of moderate-to-severe disability or side effects of immunomodulant treatments) on the assessment of fatigue.
At the time MR imaging was performed, all subjects were assessed clinically by a single neurologist who was unaware of the MR imaging results, and disability was assessed by using the EDSS.
Approval was received from the local ethics standards committee on human experimentation, and written informed consent was obtained from all subjects participating in the study.
Fatigue Assessment
In all patients, fatigue was assessed by using the FSS16 within 24–48 hours of MR imaging. This is a 9-statement interview with a 7-point scale response per statement. Patients who obtained an FSS score of ≥4 were considered fatigued, whereas those with an FSS score <4 were considered nonfatigued.16
MR Imaging Acquisition
Using a 1.5T scanner (Vision; Siemens, Erlangen, Germany), we obtained the following sequences of the brain from all subjects: 1) dual-echo turbo spin-echo images (TR = 3300 ms, TE = 16/98 ms, echo-train length = 5, 24 axial sections, section thickness = 5 mm, matrix size = 256 × 256, and FOV = 250 × 250 mm2), and 2) sagittal 3D T1-weighted MPRAGE images (TR/TE = 11.4/4.4 ms, TI = 300 ms, flip angle = 15°, FOV = 250 × 250 mm2, matrix size = 256 × 256, slab thickness = 160 mm, voxel size = 1 × 1 × 1 mm3). For dual-echo scans, the sections were positioned to run parallel to a line that joins the most inferoanterior and inferoposterior parts of the corpus callosum.
Image Analysis and Postprocessing
LVs were measured on dual-echo scans by using a local thresholding segmentation technique (Jim 4.0, Xinapse Systems; www.xinapse.com).
On 3D MPRAGE images, NBVs, WMVs, GMVs, and ICVs were calculated by using the Structural Image Evaluation with Normalization of Atrophy software.17
Voxel-based morphometry analysis was performed by using the SPM5 software (http://www.fil.ion.ucl.ac.uk/spm). First, 3D MPRAGE images were segmented into GM, WM, and CSF by using the standard unified segmentation model in SPM5.18 Then, GM and WM segmented images of all subjects, in the closest possible rigid-body alignment with each other, were alternatively used to produce GM and WM templates and to drive the deformation to the templates. To produce templates, we applied, at each iteration, the deformations, calculated by using the DARTEL registration method,19 to GM and WM, with an increasingly good alignment of subject morphology. Spatially normalized images were then modulated to ensure that the overall amount of each tissue class was not altered by the spatial-normalization procedure, and were smoothed with an 8-mm Gaussian kernel. To better align the final templates with the MNI space, we also calculated an affine registration between the customized GM and WM templates and the SPM GM and WM templates (in the MNI space).
In DARTEL, segmentation and normalization steps are performed one after the other iteratively to obtain the best matching between subjects' scans. This procedure is done automatically during the production of the template and does not allow controlling for the presence of WM lesions (which appear as hypointense on T1-weighted scans and might be misclassified as GM during the segmentation step). To exclude from the statistical analysis misclassified pixels belonging to WM T1 hypointense lesions, single subject GM maps were thresholded at 0.2 and lesions segmented manually were masked out from these single-subject maps. The resulting masks were implemented to create a GM mask that was used as an explicit mask during the statistical analysis.
T2 LPMs were produced for each group of patients with MS. Thus, binarized lesion masks from T2-visible lesions were produced, coregistered to the 3D MPRAGE (by using the rigid transformation calculated between the T2-weighted and the 3D MPRAGE images), normalized to the GM template (by using the DARTEL nonlinear transformation), and averaged to produce T2 LPMs. Lesion masks were smoothed with a 6-mm Gaussian kernel before their use as input for statistical analysis.
Statistical Analysis
Between-group differences in demographic, clinical, and structural MR imaging variables were assessed by using the Statistical Package for the Social Sciences, Version 13.0 (SPSS, Chicago, Illinois) and an analysis of variance model.
LPMs and the smoothed GM and WM images were analyzed in a multiple regression design by using SPM5. Age, sex, and ICV were entered into the design matrix as nuisance variables. GM and WM differences were assessed by using an FWE correction at P < .05 for multiple comparisons. Common patterns of GM atrophy between the different groups (fatigued MS and nonfatigued MS versus HC, and fatigued MS versus nonfatigued MS and HC) were identified by a conjunction analysis (P value adjustment = 0.05, FWE). Finally, a linear regression analysis was used to assess the correlations between regional tissue and the FSS score as well as T2 LV (P < .001, uncorrected for multiple comparisons).
Results
Ten patients were classified as fatigued. The Table summarizes the main demographic, clinical, and conventional MR imaging characteristics of the 2 groups of patients with MS and HC. The only significant difference between the 2 groups of patients was the FSS scores (P < .0001). All controls had normal findings on brain MR imaging. No significant differences in T2 LV, NBV, WMV, GMV, or ICV were found between patients with fatigued and nonfatigued MS (Table).
Main demographic, clinical, and structural MR imaging characteristics of patients with fatigued and nonfatigued MS and HC
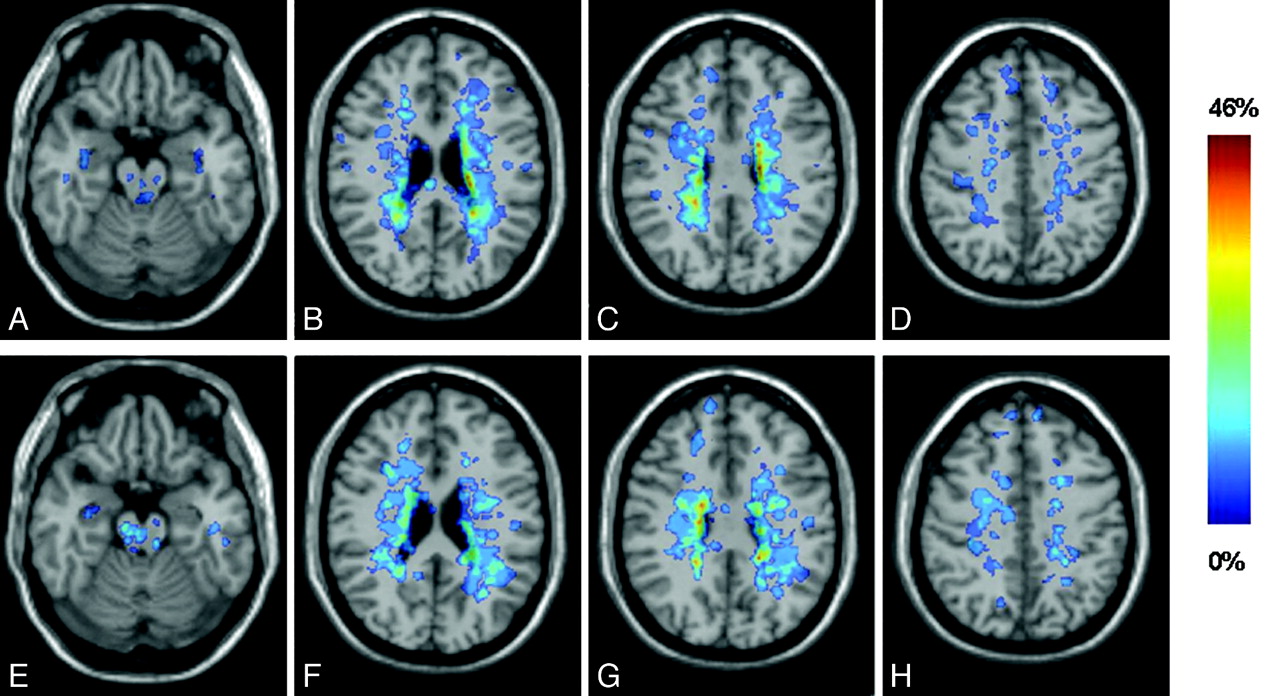
Figure 1 shows the T2 LPMs in the 2 groups of patients with MS, separately. In both groups, T2-visible lesions were mostly located in the brain stem and periventricular and juxtacortical areas. The between-group comparisons of lesion frequency showed no difference between patients with fatigued and nonfatigued MS.

Representative sections showing T2 lesion probability maps superimposed on a T1-weighted scan in the standard MNI space of patients with nonfatigued (A-D) and fatigued (E-H) RRMS. The frequency of occurrence of brain lesions in each group (%) is a color-coded scale.
Compared with healthy controls, patients with MS had significant WM atrophy in the posterior part of the corpus callosum (MNI coordinates: 4, −37, 21; and −6, −37, 21; P < .05, FWE corrected) (Fig 2). No difference was found in WM atrophy distribution between patients with fatigued versus nonfatigued MS.

SPM regions with WM atrophy, superimposed on a T1-weighted scan in the standard MNI space, in patients with RRMS compared with HC (P < .05, FWE corrected). Images are in neurologic convention.
Compared with healthy controls, patients with MS had significant GM atrophy (P < .05, FWE) of the left superior frontal sulcus (MNI coordinates: −14, 20, 46), the left precentral gyrus (MNI coordinates: −38, −4, 36), the posterior cingulate cortex (MNI coordinates: −5, −46, 30), the right thalamus (MNI coordinates: 9, −33, 4), and the left middle frontal gyrus (MNI coordinates: −33, 9, 52) (Fig 3). All these areas were significantly atrophied in patients with nonfatigued and fatigued MS, separately, in comparison with HC. No additional areas were found in patients with nonfatigued MS versus controls, whereas patients with fatigued MS also experienced atrophy of the left central sulcus (MNI coordinates: −27, −30, 55), and an additional cluster was detected in the left middle frontal gyrus (MNI coordinates: −26, 21, 51) (Fig 3). Atrophy in the left central sulcus (MNI coordinates: −32, −34, 61) and the precentral gyrus (MNI coordinates: −30, −15, 57) was more significant in patients with fatigued versus nonfatigued MS.

SPM regions of GM atrophy superimposed on a high-resolution T1-weighted image, contrasting patients with nonfatigued MS, fatigued MS, and HC at a threshold of P < .05, FWE corrected. A, Regions with reduced GM volume in patients with RRMS compared with HC. B, Regions with reduced GM volume in patients with fatigued MS compared with HC. C, Regions with reduced GM volume in patients with fatigued MS compared with nonfatigued MS. Images are in neurologic convention.
The conjunction analysis confirmed that compared with patients with nonfatigued MS and HC, patients with fatigued MS had significant atrophy of the left central sulcus (MNI coordinates: −32, −33, 61).
In patients with MS, a significant correlation was found between the following: FSS and GM atrophy in the left precentral gyrus (r = −0.73, P < .0001) and T2 LV and GM atrophy in the right thalamus (r = −0.68, P < .0001).
Discussion
In this study, we applied a voxel-wise approach to investigate the regional distribution of T2-visible lesions and atrophy of the WM and GM in patients with RRMS with fatigue compared with patients with similar clinical (in terms of age, disease duration, and overall disability) characteristics, but without fatigue. Attention was paid to minimize possible confounding factors that might be related to fatigue and thus influence its assessment, such as severe disability or depression.
The analysis of T2 LPMs showed no difference between patients with fatigued and nonfatigued MS in the occurrence of macroscopic lesions in the different brain regions. Previous studies, which evaluated the distribution of T2-visible lesions at a lobar/regional level in patients with fatigue compared with those without, gave conflicting results, because some authors found no difference,5 whereas others described a higher burden of MS lesions in the parietal lobe, trigone, and internal capsule in patients with fatigued MS.20 Differences in the methods of analysis (visual rating in the previous studies versus automated quantitative evaluation in the present one), in the number of patients enrolled, and in their clinical characteristics might help explain such discrepancies.
The analysis of WM atrophy distribution showed an involvement of the posterior part of the corpus collasum in the entire sample of patients with MS compared with HC. However, also in this case, no difference was found between patients with fatigued and nonfatigued MS. A previous study21 in a large group of patients with RRMS with low disability found a significant atrophy of the whole WM in patients with fatigued versus nonfatigued MS, which was associated with a high FSS. However, there was no attempt21 to define the topographic distribution of WM atrophy within groups. Clearly, the relatively small sample of patients we studied might have limited our ability to detect between-group differences in WM involvement. Such a factor might indeed contribute to also explaining why, though different from previous findings,21 we did not detect between-group differences in WMV. Our results do not exclude a possible microscopic involvement of critical WM pathways in the pathogenesis of fatigue in patients with MS. Indeed, we assessed atrophy, which is an end-stage phenomenon in the disease; as a consequence, it is likely to have a minimal role in patients with RRMS and low disability.22 This has also been suggested by a large longitudinal study,23 which showed no association between fatigue severity and brain atrophy at baseline, whereas such a correlation emerged after 6 years of follow-up. In this respect, the use of other quantitative, MR imaging−based techniques, which can track the structure of the major WM fiber bundles, such as diffusion tensor MR tractography, might help shed light on this aspect.
The comparison of regional GM atrophy distribution was more intriguing because it showed striking differences between patients with fatigued and nonfatigued MS. Considered as a whole, patients with MS had significant atrophy of several corticosubcortical regions, including the superior frontal sulcus, the precentral gyrus, the posterior cingulate cortex, and the thalamus, in comparison with HC. These results are in agreement with those of previous voxel-based morphometry studies in patients with RRMS,24–26 pediatric MS,27 and other MS clinical phenotypes at an early disease stage,28 which described a precocious involvement of the thalamus in the disease (possibly due to the phenomenon of wallerian degeneration of fibers passing through macroscopic visible lesions, as suggested by the analysis of correlation of this and the previous studies).
The analysis of the effect of fatigue in patients with MS, performed through a between-group comparison and an analysis of correlation, showed an association between the presence and severity of fatigue and selective atrophy of the central sulcus and precentral gyrus. The notion that patients with fatigued MS might have an impairment of structures involved in movement programming and execution is in agreement with the results of previous neurophysiologic29 and functional imaging studies,9 which have demonstrated an abnormal recruitment of regions of the sensorimotor network in these patients during the execution of voluntary movements.
Recently, Sepulcre et al30 showed an association between atrophy of the superior frontal sulcus and middle frontal sulcus and fatigue severity in a heterogeneous groups of patients with MS, including patients with clinically isolated syndromes suggestive of MS and those with the progressive forms of the disease. These authors suggested that such a regional distribution of atrophy in patients with fatigued MS might be related to retrograde degeneration of axons passing through WM lesions, because these patients had a higher occurrence of lesions in regions of the frontal lobes. Our results argue against this hypothesis because lesion distribution did not differ between patients with and without fatigue and we found no relation between T2 LV and regional GM atrophy. Most remarkable, the notion that tissue loss in selected regions of the frontal lobes might be related to fatigue is also supported by a study in patients with chronic fatigue syndrome, which showed a volume reduction of the bilateral prefrontal cortex.31
This study has limitations. First, we enrolled a relatively small number of patients with homogeneous clinical characteristics and a narrow range of clinical disability. As a consequence, the generalizability of our results to the whole MS population needs to be verified, and our results should be confirmed in larger groups of patients. Second, we did not administer the FSS to HC. Third, we limited our investigation to a single MR imaging finding (ie, atrophy). Voxel-wise analysis of different MR imaging modalities, including diffusion tensor MR imaging and magnetization transfer MR imaging, might have allowed us to detect further mechanisms involved in the pathogenesis of fatigue. Fourth, we did not quantify macroscopic lesions in the GM, which are known to be frequent among the various disease clinical phenotypes and have been associated with clinical and cognitive disability.32,33 Finally, although there is strong evidence that the basal ganglia play an important role in the origin of fatigue,34 we were unable to show an association between basal ganglia structural abnormalities and fatigue in the present study. This latter finding might be due to the fact that these structures, in particular the thalami, are involved early in the course of the disease (indeed all our patients had thalamic atrophy, independent of the presence of fatigue).
Conclusions
In this study, we hypothesized that the involvement of selected brain regions might help to explain, at least partially, the occurrence of fatigue in patients with MS. Voxel-wise assessment of the regional distribution of damage showed no difference between patients with fatigued and nonfatigued RRMS in the location of lesions and normal-appearing WM atrophy, whereas atrophy of the central sulcus and precentral gyrus was found in patients with fatigue.
References
- Received September 8, 2010.
- Accepted after revision October 7, 2010.
- Copyright © American Society of Neuroradiology
In this issue


Jump to section
Related Articles
Cited By...
- Gray Matter alterations in MS and CIS: a Coordinate based Meta-analysis and regression
- Brain MRI atrophy quantification in MS: From methods to clinical application
- Third ventricular enlargement in early stages of multiple sclerosis is a predictor of motor and neuropsychological deficits: a cross-sectional study
- Investigating Axonal Damage in Multiple Sclerosis by Diffusion Tensor Spectroscopy