
Abstract
BACKGROUND AND PURPOSE: MRN is an emerging diagnostic method for disorders of peripheral nerves. However, it is unclear whether the influence of the MA on intraneural T2 signal is severe enough to provoke false-positive findings.
MATERIALS AND METHODS: Twenty-five healthy subjects underwent MRN of the sciatic nerve of the proximal thigh at 3T. The T2app was calculated from a DE-TSE sequence (TR = 3000 ms, TE1 = 12 ms, TE2 = 69 ms) at 7 angles of the sciatic nerve relative to B0 = 0°, 30°, 35°, 40°, 45°, 50°, and 55°. Precise angle adjustments were performed with a dedicated in-bore positioning aid. Qualitative evaluation of intraneural T2-weighted contrast between this group of healthy subjects and 14 patients with neuropathic lesions was performed by comparing CNRs of a TIRM sequence (TR = 5000 ms, TE = 76 ms, TI = 180 ms).
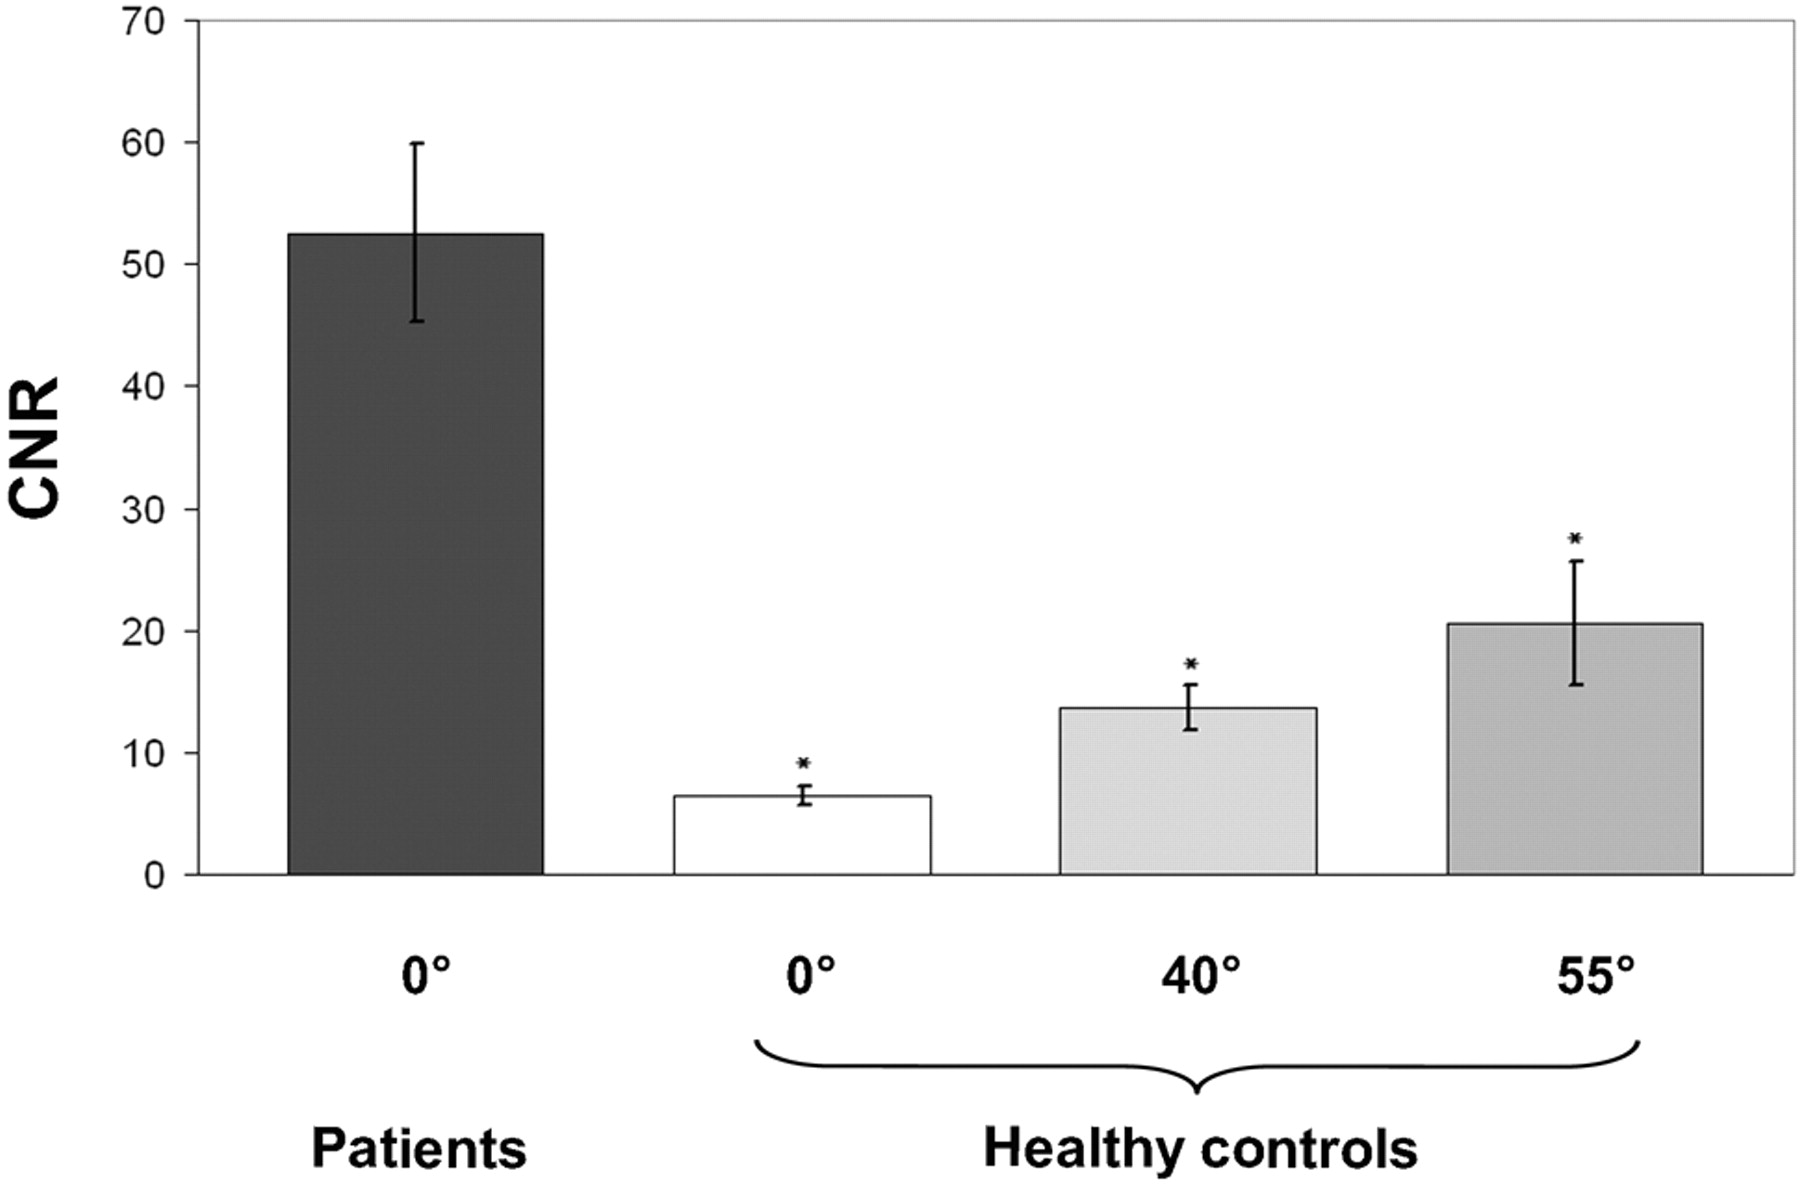
RESULTS: In healthy subjects, the prolongation of T2app from 0° to 55° was from 74.5 ± 13.4 to 104.0 ± 16.9 ms (P < .001). The increase in T2app relative to baseline (0°) was 9.6% (30°), 18.4% (35°), 25% (40°), 27.6% (45°), and 37% (55°). Intraneural CNR increased by 1.98 ± 0.69 at 40° and 2.93 ± 0.46 at 55°. Nevertheless, the mean CNR of healthy subjects was substantially lower than that in patients at 40° (P < .0001) and even at the position of maximum MA (55°: 20.6 ± 5.11 versus 52.6 ± 7.12, P < .0001).
CONCLUSIONS: Neuropathic lesions are clearly distinguishable from an artificial increase of intraneural T2 by the MA. Even at a maximum MA (55°), the false-positive determination of a neuropathic lesion is unlikely.
Abbreviations
- CNR
- contrast-to-noise ratio
- DE-TSE
- dual-echo turbo-spin-echo
- lROI
- larger intraneural region of interest with a pixel-size of 21
- MA
- magic angle effect
- MRN
- MR neurography
- NCS/EMG
- nerve conduction studies/electromyography
- sROI
- small intraneural region of interest with a pixel size of 5
- T2app
- apparent intraneural T2 relaxation time
- TIRM
- turbo inversion-recovery magnitude
- TSE
- turbo spin-echo
Disorders of the peripheral nervous system reach up to 8% prevalence in individuals older than 55 years of age and are among the most common neurologic diseases.1 Furthermore, as a secondary condition of many underlying systemic diseases, they are often independent and substantial contributors to morbidity.2,3 Correct and timely diagnostic classification of these disorders depends critically on the objective determination and precise localization of neuropathic lesions. However, in the peripheral nervous system, lesion localization by conventional clinical examination, NCS/EMG, is dependent on the investigator, is notoriously difficult, can often only approximate the anatomic region of the affected nerve segment, and may not be obtained reliably for certain peripheral nerves or muscle groups.4
High-resolution MRN has become an important diagnostic adjunct to the clinical and NCS/EMG examination.5,6 If appropriately imaged at 3T with the use of dedicated coil arrays, its pixel resolution approaches 100 × 100 μm, enabling the reliable in vivo visualization of most nerve fascicles not only within proximal large nerve trunks but also within digital nerves at distal extremity sites.6 At the same time, considerable anatomic coverage along the investigated peripheral nerves can be achieved during a routine clinical examination.
Most important, the intraneural hyperintense T2-weighted contrast on fat-saturated sequences provides a valuable diagnostic criterion for the precise determination of the site and extension of intraneural and fascicular pathology.5,6 However, the clinical use of MRN is still restricted, and its value to assess peripheral nerve lesions and guide therapy (eg, in precisely targeting surgical decompression in entrapment neuropathies) is largely underestimated.
This problem may be related in part to the controversial debate as to whether the clinical usefulness of MRN may be impaired by the MA as an artifact that has never been investigated for peripheral nerves at 3T.7,8 The MA is associated with a hyperintense T2 signal-intensity alteration in tissues densely composed of collagen, was first observed in tendons and ligaments, and was later reported also to occur in peripheral nerves.9–12 It is conceived as a T2 signal-intensity increase related to the suppression of dipole-dipole interactions of the hydrogen protons bound to quasicrystalline structures such as tropocollagen, the triple-helical main compound of various types of fibrillary collagen.13 The dipole-dipole interaction between the highly ordered protons produces local magnetic fields with a field strength in the z-direction:

where r is the distance between the interacting protons and Θ is the angle between the collagen fiber and direction of the magnetic field. Due to these local magnetic fields, the transverse relaxation time (T2) is reduced as long as Bz ≠ 0. For Θ = 55°, Bz = 0, thus resulting in a maximum MA effect on T2.
In this study, we systematically investigated the intraneural MA effect on T2 in a group of 25 healthy subjects. To this end, the angle-dependent change in magnitude was measured at stepwise-increasing precisely adjusted angle positions. Finally, by comparing intraneural CNR measurements between patients with neuropathic lesions and healthy subjects, we aimed to answer to what extent the MA may lead to false-positive findings in MRN at 3T.
Materials and Methods
Subjects, Hardware Prerequisites, and Positioning
This study was approved by the ethics committee of the Medical Faculty of the University of Heidelberg (reference S-057/2009). Twenty-five adult healthy volunteers (mean age, 25 years; range, 19–31 years; men = 5, women = 13) without any history of peripheral nerve disease and 14 patients (mean age, 51 years; range, 53–46 years; men = 5, women = 9) with confirmed neuropathic lesions participated in the study and gave written informed consent. All measurements were performed by using a 3T whole-body MR imaging scanner (Magnetom Tim Trio; Siemens, Erlangen, Germany). The integrated body coil was used as a radio-frequency transmitter; as a radio-frequency receiver, we used a 2 × 4 element surface-array coil (multipurpose 2 × 4 channel surface-array coil, Model MR 8300; Noras MRI Products, Hoechberg, Germany). The 2 coil arrays were firmly attached opposite each other on the anterior and posterior surfaces of the proximal right thigh. For an exact positioning of the thigh and, by implication, of the sciatic nerve at defined angle positions (Θ) relative to the main magnetic field, an MR imaging−compatible polyvinyl chloride construction built in-house was used. Its design consisted of a 10-cm-wide baseboard on top of which an isosceles triangle was formed by 1 adjustable thigh board and 1 additional support board. These 2 flexible boards could be raised from the horizontal position into 7 predefined distance locks at angles of Θ = 0°, 30°, 35°, 40°, 45°, 50°, or 55° between the thigh board and the baseboard, which in turn was aligned to B0 (Fig 1). The accuracy of the device for the adjustment of the desired angle positions was estimated by finding the true anatomic angle of the sciatic nerve with the thigh board (abbreviated by [I] in Fig 1) adjusted at the 55° position. The mean angular deviation of the sciatic nerve in the group of healthy subjects from the Θ = 55° position of the device was 4.6° ± 2.9°.

Construction chart of in-bore positioning aid. Distance locks (a–f) precisely define 7 angle positions between the thigh (I) and base board (II) relative to B0: 0°, 30°, 35°, 40°, 45°, 50°, and 55°. This polyvinyl chloride device was firmly positioned under the gluteal and thigh region of the supine patient and aligned in the z-direction, parallel to the static magnetic field B0. Angulations were achieved by stepwise erection of the thigh board relative to the baseboard. The insert on the upper right displays an oblique top view of the device.
MR Imaging Protocol
After the survey scan in 3 planes, a T1-weighted TSE sequence in an axial orientation (perpendicular to the femur) was performed for a detailed anatomic overview of the sciatic nerve at the proximal thigh. For quantitative analysis of the change in intraneural T2, we used a DE-TSE sequence, and for the qualitative visual assessment of intraneural T2-weighted contrast, we used a T2-weighted TIRM sequence for fat saturation (TI = 180 ms). The latter is the most commonly used sequence in clinical diagnostic imaging of peripheral nerve disorders. Table 1 provides the applied pulse sequences and corresponding measurement parameters. Additionally, for selected angle positions, we performed T1-weighted TSE and T2-weighted TIRM measurements in a parasagittal orientation relative to the femur for assessment of the longitudinal course of the sciatic nerve in the sagittal plane (Fig 2). Table 2 shows the sequences performed at the respective angle positions Θ.

Parasagittal MR images of the sciatic nerve of 1 representative healthy subject at Θ = 55°. A, T1-weighted TSE image shows that the sciatic nerve (arrows) courses parallel to the femur among the adductor magnus, semitendinosus, and biceps femoris muscles. B, Sagittal T2-weighted TIRM image at the position of maximum occurrence of the MA at Θ = 55° shows hyperintense alteration of the nerve.
Pulse sequences in chronologic order of execution from left to right and their corresponding parameter settings
Angulations in chronologic order of measurement (from top to bottom)a
Calculation of Outcome Measures
Quantitative outcome measures and CNR were calculated from 2 predefined circular regions of interest: sROI, comprising only the connective tissue of the interfascicular compartment (interfascicular space), and lROI, including the interfascicular space and intraneural nerve fascicles.
Both regions of interest were consistently placed within the sciatic nerve without contact with its epineural borderzone to exclude any extraneural tissue. The sROI was always placed within the lROI, but care was taken to exclude intraneural nerve fascicles from the sROI—that is, to obtain only the connective tissue within the interfascicular space (interfascicular space) by placing the sROI between intraneural nerve fascicles. Finally, small and large regions of interest of equal size were placed in adjacent muscular (short head of the biceps femoris muscle) and fatty soft tissue (adjacent intermuscular fat). Measurements were performed only on axial 2D images (DE-TSE, T2-TIRM) with perpendicular orientation to the longitudinal course of the sciatic nerve to avoid significant partial volume effects.
The T2app was determined for each region of interest from the DE-TSE sequence according to the following equation:
S1 denotes the mean signal intensity of the first (TE1 = 12 ms) and S2 of the second echo (TE2 = 69 ms). The term “apparent T2” reflects the fact that several echoes with different echo times contribute to the signal intensity of TSE sequences, from which a true T2 cannot be calculated.
In addition, the angle-dependent increase of T2, as would be expected from theoretic modeling based on the angle-dependent dipole-dipole interaction (equation 1), was calculated. For the given tissue-specific T2 relaxation time, estimated by this study for the sciatic nerve, further angle-dependent T2 change is given by equation 3,14 with A and K being tissue-specific constants:

A and K were estimated by fitting the curve as given by equation 3 to the measured T2 (Θ) by using a Levenberg-Marquardt algorithm. R2 was calculated to measure the goodness-of-fit.
T2-weighted TIRM is the sequence of choice for a clinical MRN examination but does not allow calculation of quantitative tissue parameters. Its signal intensity is influenced by the filling factor of the coil or inhomogeneous radio-frequency attenuation, for example. Therefore we calculated CNR values according to equation 4 by using the signal intensities of the sciatic nerve (Sn) and muscle (Sm), respectively:

where σref is the SD of the signal intensity outside the thigh.
Statistical Analyses
For group analysis, T2app and CNR values were averaged over all obtained axial sections for each Θ. Nonparametric statistical analyses were then performed by using the Wilcoxon signed rank test.
Comparison with Clinical Findings
The CNR results obtained in healthy subjects were finally compared with those of patients with peripheral neuropathy involving neuropathic lesions localized by clinical and NCS/EMG examination. As in healthy subjects, CNR was obtained from identical intraneural and muscular regions of interest from the T2-weighted TIRM sequence on 5 contiguous sections. CNR values from patients are given in Table 3. In the patient comparison group, the measurement of T2app was not accomplished because of constraints of measurement time and patient positioning. Only in an additional small sample of patients with confirmed cubital tunnel syndrome (n = 5) was the measurement of T2app achievable. In this group, only mild or moderate degrees of disease severity, defined by the absence of muscle atrophy or higher grade muscle weakness (Medical Research Council score of >3 in all ulnar target muscles of the hand), were included.
Calculated intraneural T2-weighted CNR values of peripheral nerves from patients with neuropathic lesions of known etiology, localized by clinical examination and ENG/EMG studies
Results
Intraneural T2 Time Constant (T2app)
Table 4 displays mean intraneural T2app values (milliseconds) and corresponding standard errors at all angulations of Θ. T2app increased by 32.8 ms for sROI and by 29.5 ms for lROI when Θ was raised from 0° to 55°. With respect to the relative increase of T2app, we found a substantial increase in T2 exceeding 10% only at angulations >30°. Figure 3 shows the T2app as a function of Θ and demonstrates the results of pair-wise comparisons of each angulation versus the baseline position at 0°.

Intraneural variations of the T2app time constant at all measured angulations of Θ and the calculated theoretic course for both region-of-interest sizes (sROI, lROI). Note that there is a marked increase in T2app when increasing the angle from Θ = 30° to Θ = 55°. For each angulation above 0°, the difference of T2app was tested against its baseline value at 0° (asterisk = P < .05, double asterisks = P < .001). The theoretically assumed angular dependency of T2 (compare with equation 3) was fitted to the measured values by using a Levenberg-Marquardt algorithm. R2 is 0.94 for sROI and 0.95 for lROI, respectively.
Quantitative intraneural T2app values of the sciatic nerve at every angle orientation (DE-TSE sequence) and CNR values of the sciatic nerve at the angle positions 0°, 40°, and 55° (T2-TIRM sequence) averaged over 25 subjects
Fitting of the theoretically assumed T2 (Θ) according to equation 3 yielded A = 102.5 ms and K = 15.1 ms for sROI; the respective values for lROI were A = 101.6 ms and K = 13.5 ms.
CNR in Healthy Subjects and Patients on T2-Weighted TIRM Images
The calculated mean CNR for the sciatic nerve in the group of 25 healthy subjects was 6.5 ± 0.9 at 0°. The CNR increased to 13.6 ± 1.8 at 40° (P < .001) and 20.6 ± 2.3 at 55° (P < .001) (Fig 4).

Bar charts of intraneural contrast variations on T2-weighted TIRM imaging (CNR, y-axis) at all measured angle positions (0°, 40°, 55°) averaged over 25 healthy subjects and 14 patients (x-axis). Given that CNR values reflect mean contrast differences between nerve and adjacent muscle, the mean CNR in patients (dark gray) was significantly higher than in healthy subjects for all measured angle positions (versus 0°, 45°, and 55°: asterisk = P < .0001). Double asterisks indicate that the peripheral nerve orientation in patients was at 12° ± 2.5° relative to B0. Error bars denote standard error of the mean.
This group of healthy volunteers was compared with 14 patients with peripheral neuropathies of known etiology and lesion site confirmed by clinical examination and NCS/EMG studies (Table 3). The mechanisms of injury were entrapment neuropathy at the elbow (n = 4), blunt or sharp trauma (n = 4), and chronic inflammatory neuropathy (n = 6). The mean intraneural CNR of all neuropathic lesions was 54.3 ± 8.7. This was significantly higher compared with the maximum angle position of 55° in healthy subjects (20.6 ± 2.3, P < .0001), also compared with 40° (13.6 ± 1.8, P < .0001) and with 0° (6.5 ± 0.9, P < .0001) (Fig 4). The averaged angle misalignment of the extremities over all patients was measured with 12° ± 2.5° relative to B0.
Figure 5 shows representative images of intraneural T2-weighted contrast for 1 healthy subject at the baseline position (Fig 5A, -B) and the position of maximum MA at 55°(Fig 5C, -D), both compared with a neuropathic lesion of 1 representative patient (Fig 5E, -F).

Sciatic nerve of 1 representative healthy subject at the baseline position of 0° relative to B0 (A and B) at the position of maximum MA occurrence of 55°(C and D) and 1 representative neuropathic lesion in a patient (62-year-old man) aligned with B0 (0°). Transversal T2-weighted TIRM images (left column: A, C, and E) are displayed with corresponding zoomed views focusing on the nerve (right column: B, D, and F). Note the hyperintense intraneural T2-weighted contrast relative to surrounding muscle at 55°(C and D) as opposed to the baseline position at 0° (A and B). A clearly stronger T2-weighted hyperintense contrast is noted in a true neuropathic lesion (E and F; 62-year-old male patient). In addition, fascicles of the affected nerve appear markedly swollen as a typical finding of severe neuropathic injury, confirmed by ENG/EMG as axonal injury.
An additional small sample of 5 patients with confirmed mild or moderate cubital tunnel syndrome was investigated. In this group, the mean T2app of the ulnar nerve at the center of the cubital tunnel was 89 ± 9.5 ms at the neutral angle position of 0°. In another 5 healthy control subjects, the mean T2app of the ulnar nerve equally aligned in a neutral position was 68 ± 7.8 ms.
Discussion
In MRN, the MA is a potential artifact mimicking a hyperintense (ie, pathologic) signal intensity in a normal peripheral nerve. To what extent the MA within a peripheral nerve can contribute to false-positive findings by increasing the intraneural T2 signal intensity has not been addressed so far. Furthermore, the MA has never been investigated in MRN at 3T.
In this study, we systematically investigated the intraneural MA in a large group of healthy subjects at predefined and precisely adjusted incrementing angle positions (Θ) provided by a dedicated in-bore positioning aid. It was confirmed that variations of quantitative intraneural T2app values clearly depend on Θ.
On the basis of the angle-dependent dipole-dipole interaction (equation 1), we would expect T2 to depend on Θ as given by equation 3.14
Within the range of angles covered in this study, we found an angle dependency of T2app, which is in accordance with equation 3. This may serve as a strong suggestion that this dependence is related to the MA.
The statistical significance of the change in T2app was reached for all angle positions of >0° tested versus the baseline position at 0°. However, a relevant signal-intensity increase of ≥10%, determined as the threshold for reliable visual recognition of change in signal intensity, was observed only at angle positions Θ > 30°. This is important because usually peripheral nerves can be aligned at angulations that are clearly lower than 30° relative to B0. In clinical examinations, an exceptionally oblique anatomic course of neural tissue and resulting misalignment of Θ > 30° is expected only in the case of the brachial or lumbosacral plexus. In fact, the healthy brachial plexus, as opposed to other peripheral nerves, which conveniently align well with B0, regularly exhibits a noticeable hyperintense T2-weighted contrast.12
Furthermore, our findings show that the interfascicular connective tissue within a peripheral nerve (measured with a small interfascicular region of interest) does not contribute differentially to the MA—that is, nerve fascicles and their surrounding intraneural tissue each contribute to a similar degree to the overall intraneural T2 increase by the MA. This has been raised as an important issue before and is particularly relevant because intrafascicular axonal degeneration or demyelination is a major pathologic mechanism in most peripheral neuropathies.9
Further qualitative CNR measurements were obtained to reflect clinical judgment and were compared between healthy subjects and a group of patients with neuropathic lesions of known etiology and localization. These results suggest that patients with neuropathic lesions are clearly discernable from healthy controls by exhibiting a stronger intraneural T2-weighted hyperintense contrast, even in comparison with controls exposed to an angle position of 55°, at which the maximum MA is expected to occur. However, that mild disease is associated with only a minor increase in intraneural T2-weighted contrast, possibly within the range of the MA effect, cannot be excluded.
Furthermore, a mean deviation of the peripheral nerves in the patient group from a B0 of 12°± 2.5° could not be avoided. However, it may be supposed from the theoretic model of the T2 (Θ) curve (equation 3) and the empirically observed T2 values at precisely adjusted angle positions (Fig 3) that between this angle range (0°-12°) only a minor contribution to the CNR of neuropathic lesions is made artificially by the MA.
In contrast to peripheral nerves, tendons and ligaments are known to exhibit a very short T2 relaxation time and thus appear markedly hypointense on T2-weighted MR images. Du et al15 investigated the MA of the Achilles tendon on a clinical 3T scanner and found an increase of T2* from 1.94 ± 0.28 ms at 0° to 15.25 ± 2.13 ms at 55°.
In another study using ultrashort TE spectroscopic imaging, T2* was estimated for collagen-rich tissue such as, for example, tendons or menisci, between 1.96 ± 0.47 and 4.19 ± 0.68 ms.16 The intraneural T2 relaxation time at the neutral baseline position was estimated by this study at 3T by the parameter T2app at 75 ms. Even though T2* is <T2 in all tissues, it can be assumed that the intraneural T2 at the neutral angle position of 0° is substantially longer (by a factor of >10) than all respective components of T2 for tendons and ligaments.15,17 However, as was also found by this study, with increasing angle positions this discrepancy resolves so that the T2 relaxation time of peripheral nerves, compared with tendons and ligaments, remains longer only by a factor of approximately 5. This extreme increase in the T2 relaxation for tendons and ligaments at magic angle positions can be readily associated with their histologic structure: densely packed type I collagen. In contrast, the connective tissue of peripheral nerves is predominantly set up by epineurial collagen type I (and to a lesser extent by endoneurial type III) covering a comparatively small cross-sectional area in the sciatic nerve of approximately 70%–80% and, to an even lesser degree, in other regions, as low as 22% in the ulnar nerve.18,19
On the basis of their ultrashort T2 relaxation time, it is technically feasible to suppress the MAs in tendons and ligaments by increasing TE to approximately 40 ms in spin-echo, 70 ms in fast spin-echo, and 30 ms in gradient-echo sequences.20 In contrast, as 1 important result of this study, we can conclude that it will not be possible to efficiently suppress the intraneural MA, due to the comparatively long T2 relaxation time measured with 74.5 ± 13.4 ms. To avoid sensitivity to the MA, TE would have to be prolonged to values of >200 ms, which, in turn, would inevitably lead to an exponential signal-intensity loss. However, our results strongly support the finding that the potential of the MA to contribute to the false-positive detection of a neuropathic lesion is low. First, diagnostically relevant signal-intensity alterations will not occur until extreme angulations above 30° are reached. This should be avoidable in most MRN investigations of peripheral nerves of the extremities and appears to be of concern only in the investigation of the brachial or lumbosacral plexus. Second, even if the maximum MA occurs at 55° relative to B0, true neuropathic lesions should be clearly discernable because they exhibit a far stronger intraneural T2-weighted hyperintense contrast.
Conclusions
Our study contributes to settling the controversy as to whether the MA in peripheral nerves is a relevant diagnostic artifact in MRN, suggesting that the potential of this artifact for false-positive findings is low. First, alignment of peripheral nerves at <30° relative to B0 avoids a substantial MA. Peripheral nerves except for the nerval plexus of the extremities are usually aligned well enough with B0—that is at <30°. Second, neuropathic lesions exhibit a clearly stronger T2-weighted signal intensity, even if contrasted against artificially T2-weighted hyperintense healthy nerves with the maximum MA at 55°.
In addition, it may be anticipated that increasing the TE in a T2-weighted pulse sequence, unlike in the MA of tendinous tissue, will not be a successful approach to suppressing the MA in peripheral nerves; this relates to the observation of a comparatively long intraneural T2 relaxation time of 75 ms.
Footnotes
-
Previously presented in part at: Annual Meeting of the German Society of Neuroradiology, October 8-10, 2009; Köln, Germany.
Indicates open access to non-subscribers at www.ajnr.org
References
- Received July 25, 2010.
- Accepted after revision September 24, 2010.
- Copyright © American Society of Neuroradiology
In this issue


Jump to section
Related Articles
Cited By...
- Comparing Orientation-Dependent Transverse Relaxation at 3T and 7T: Deciphering Anisotropic Relaxation Mechanisms in White Matter
- On the origin of R2 orientation dependence angle offsets in white matter
- Orientation dependent proton transverse relaxation in the human brain white matter: The magic angle effect on a cylindrical helix
- Peripheral nervous system alterations in infant and adult neurofibromatosis type 2