Advertisement

Main menu

  • Home
  • Content
    • Current Issue
    • Accepted Manuscripts
    • Article Preview
    • Past Issue Archive
    • Video Articles
    • AJNR Case Collection
    • Case of the Week Archive
    • Case of the Month Archive
    • Classic Case Archive
  • Special Collections
    • Advancing NeuroMRI with High-Relaxivity Contrast Agents
    • AJNR Awards
    • Low-Field MRI
    • Alzheimer Disease
    • ASNR Foundation Special Collection
    • Photon-Counting CT
    • View All
  • Multimedia
    • AJNR Podcasts
    • AJNR SCANtastic
    • Trainee Corner
    • MRI Safety Corner
    • Imaging Protocols
  • For Authors
    • Submit a Manuscript
    • Submit a Video Article
    • Submit an eLetter to the Editor/Response
    • Manuscript Submission Guidelines
    • Statistical Tips
    • Fast Publishing of Accepted Manuscripts
    • Graphical Abstract Preparation
    • Imaging Protocol Submission
    • Author Policies
  • About Us
    • About AJNR
    • Editorial Board
    • Editorial Board Alumni
  • More
    • Become a Reviewer/Academy of Reviewers
    • Subscribers
    • Permissions
    • Alerts
    • Feedback
    • Advertisers
    • ASNR Home

User menu

  • Alerts
  • Log in

Search

  • Advanced search
American Journal of Neuroradiology

American Journal of Neuroradiology

ASHNR American Society of Functional Neuroradiology ASHNR American Society of Pediatric Neuroradiology ASSR
  • Alerts
  • Log in

Advanced Search

  • Home
  • Content
    • Current Issue
    • Accepted Manuscripts
    • Article Preview
    • Past Issue Archive
    • Video Articles
    • AJNR Case Collection
    • Case of the Week Archive
    • Case of the Month Archive
    • Classic Case Archive
  • Special Collections
    • Advancing NeuroMRI with High-Relaxivity Contrast Agents
    • AJNR Awards
    • Low-Field MRI
    • Alzheimer Disease
    • ASNR Foundation Special Collection
    • Photon-Counting CT
    • View All
  • Multimedia
    • AJNR Podcasts
    • AJNR SCANtastic
    • Trainee Corner
    • MRI Safety Corner
    • Imaging Protocols
  • For Authors
    • Submit a Manuscript
    • Submit a Video Article
    • Submit an eLetter to the Editor/Response
    • Manuscript Submission Guidelines
    • Statistical Tips
    • Fast Publishing of Accepted Manuscripts
    • Graphical Abstract Preparation
    • Imaging Protocol Submission
    • Author Policies
  • About Us
    • About AJNR
    • Editorial Board
    • Editorial Board Alumni
  • More
    • Become a Reviewer/Academy of Reviewers
    • Subscribers
    • Permissions
    • Alerts
    • Feedback
    • Advertisers
    • ASNR Home
  • Follow AJNR on Twitter
  • Visit AJNR on Facebook
  • Follow AJNR on Instagram
  • Join AJNR on LinkedIn
  • RSS Feeds

AJNR Awards, New Junior Editors, and more. Read the latest AJNR updates


Improved Turnaround Times | Median time to first decision: 12 days

Research ArticleBrain

Distinguishing Recurrent Primary Brain Tumor from Radiation Injury: A Preliminary Study Using a Susceptibility-Weighted MR Imaging−Guided Apparent Diffusion Coefficient Analysis Strategy

A. Al Sayyari, R. Buckley, C. McHenery, K. Pannek, A. Coulthard and S. Rose
American Journal of Neuroradiology June 2010, 31 (6) 1049-1054; DOI: https://doi.org/10.3174/ajnr.A2011
A. Al Sayyari
  • Find this author on Google Scholar
  • Find this author on PubMed
  • Search for this author on this site
R. Buckley
  • Find this author on Google Scholar
  • Find this author on PubMed
  • Search for this author on this site
C. McHenery
  • Find this author on Google Scholar
  • Find this author on PubMed
  • Search for this author on this site
K. Pannek
  • Find this author on Google Scholar
  • Find this author on PubMed
  • Search for this author on this site
A. Coulthard
  • Find this author on Google Scholar
  • Find this author on PubMed
  • Search for this author on this site
S. Rose
  • Find this author on Google Scholar
  • Find this author on PubMed
  • Search for this author on this site
  • Article
  • Figures & Data
  • Info & Metrics
  • Responses
  • References
  • PDF
Loading

Article Figures & Data

Figures

  • Tables
  • Fig 1.
    • Download figure
    • Open in new tab
    • Download powerpoint
    Fig 1.

    A−C, Representative images from a patient with recurrent GBM: CE-T1 (A), CE-SWI (B), and ADC maps (C). D−F, Automatically defined enhancement masks are overlaid on the corresponding maps seen in the top row. Note the regions of nonspecific BBB leakage within the CE-T1 mask, which correlate to areas of necrosis and vascular structures on the SWI maps (arrow).
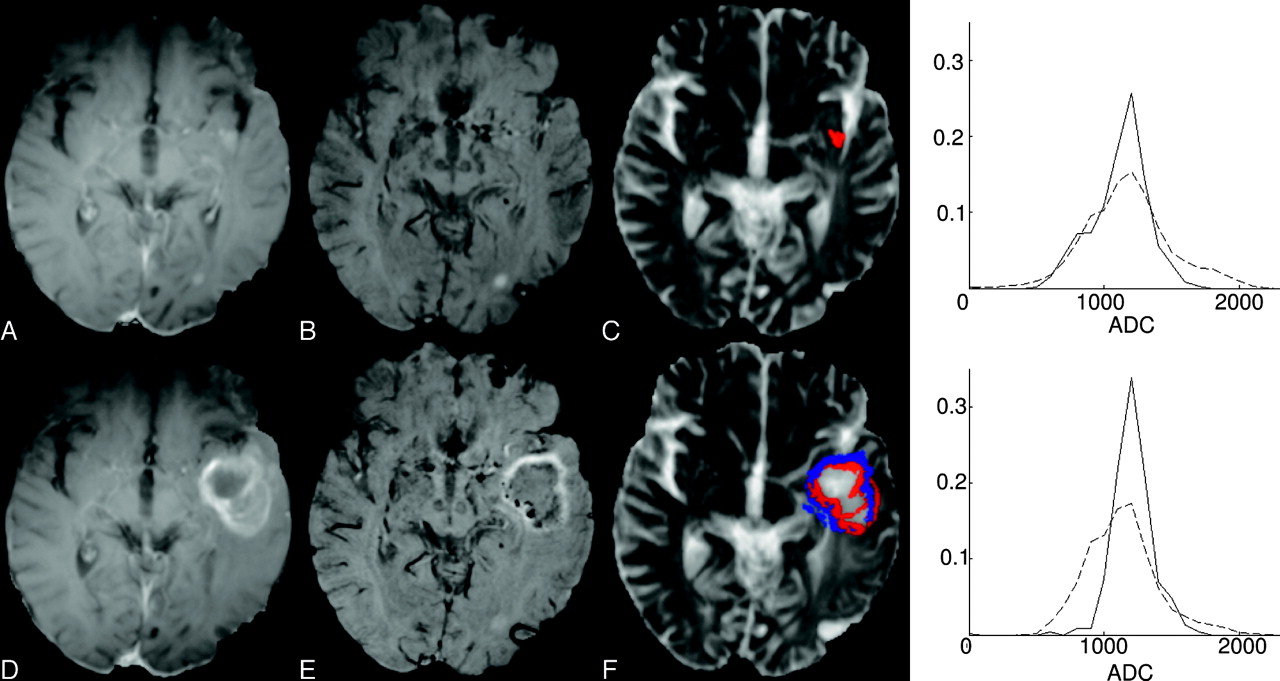
  • Fig 2.
    • Download figure
    • Open in new tab
    • Download powerpoint
    Fig 2.

    Representative CE-T1 (A and D), CE-SWI (B and E), ADC maps (C and F), and ADC frequency plots for patient 14, with a biopsy-defined recurrent anaplastic oligoastrocytoma. The top frequency plot presents ADC values found within the CE-T1 enhancement mask (red), while the bottom plot shows ADC values contained within the CE-SWI mask (blue). Images on the top row correspond to the initial time point, while those on the bottom row show the follow-up scans. For the ADC frequency plots, the continuous line corresponds to data acquired at the initial time point, while the dashed line is from the follow-up data. These combined data highlight the correlation between an increase in enhancement volume (for both T1 and SWI) with a significant reduction in ADC value within the CE-SWI enhancement mask for recurrent tumor. Most interesting, there is an apparent increase in ADC within the CE-T1 enhancement mask, possibly reflecting the inclusion of necrosis within the ADC analysis.

  • Fig 3.
    • Download figure
    • Open in new tab
    • Download powerpoint
    Fig 3.

    Representative CE-T1 (A and D), CE-SWI (B and E), ADC maps (C and F), and ADC frequency graphs for patient 10 with SD most likely associated with radiation-chemotherapy−induced changes. The top frequency plot presents ADC values found within the CE-T1 enhancement mask (red), while the bottom plot shows ADC values contained within the CE-SWI mask (blue). Images on the top row correspond to the initial time point, while those on the bottom row show the follow-up scans. For the ADC frequency plots, the continuous line corresponds to data acquired at the initial time point, while the dashed line is from the follow-up data. For this patient, there is little change in enhancement volume between time points, but a significant increase in ADC values within the CE-SWI enhancement mask. Follow-up scans revealed no further increase in enhancement volume (data not shown). This pattern of change may represent radiation injury within the perilesional boundary.

Tables

  • Figures
    • View popup
    Table 1:

    Patient demographics, diagnosis, and clinical course

    No.Age (yr)SexInitial Pathology (date)Follow-Up Intervalsa (mo)DiagnosisbReference Standard
    130FGBM, May 20036 and 9RTBiopsy
    230MOligodendroglioma, March 20084 and 8RTClinical/MRI follow-up
    359FOligodendroglioma, May 200524 and 26SDClinical/MRI follow-up
    463FGBM, February 200810 and 12SDClinical/MRI follow-up
    561MGBM, June 20082 and 4RTClinical/MRI follow-up
    657MAstrocytoma,c August 20081 and 3RTClinical/MRI follow-up
    755MGBM, May 20087 and 9SDClinical/MRI follow-up
    844FOligodendroglioma, 19966 and 8RTBiopsy
    929FGBM, October 20066 and 8RTBiopsy
    1048FGBM, September 20054 and 5SDdClinical/MRI follow-up
    1192FGBM, November 20073 and 7RT PseudoDeceased
    1236MGBM, November 20074 and 5SDdClinical/MRI follow-up
    1353FAstrocytoma,c May 20086 and 10SDClinical/MRI follow-up
    1462MAstrocytoma,c October 20086 and 8RTBiopsy
    1560MGBM4 and 7RTBiopsy
    1642FGBM, April 20091 and 3RTClinical/MRI follow-up
    1771MGBM, October 20081 and 3RTClinical/MRI follow-up
    • a Scanning follow-up intervals after treatment for new enhancing lesions.

    • b Most probable diagnosis of new lesions: GBM, RT, SD (most likely radiation-chemotherapy change).

    • c Anaplastic astrocytoma.

    • d Patients underwent additional MR imaging showing no change in radiologic features or change in clinical status.

    • View popup
    Table 2:

    Lesion volumes and ADC measuresa

    No.T1SWI
    Time Point 1Time Point 2Time Point 1Time Point Z
    Vol (mm3)ADC (median)Vol (mm3)ADC (median)Vol (mm3)ADC (median)Vol (mm3)ADC (median)
    131591211448b31560121506b
    26122851214b2127011092b
    36612281221270c491267751338c
    448902.2796b0.38830.1990b
    51980920852c396012931c
    66124510.51232212505.61233
    73106121148No E—No E—
    82.494781020b0.311534.41026
    92112491190b0.7119421283b
    100.410340.51396b0.210950.11752c
    11261076411132c6.6106651419c
    124111216.51091b3.611316.41162b
    130.214040.11636b0.117480.11830
    14512001912183125710.51174c
    1529119456.61145b101219281090c
    164.71352291268b21384181350b
    171313603.5954c513774970c
    • a ADC units are seconds per square millimeter.

    • b P < .005.

    • c P < .0005.

PreviousNext
Back to top

In this issue

American Journal of Neuroradiology: 31 (6)
American Journal of Neuroradiology
Vol. 31, Issue 6
1 Jun 2010
  • Table of Contents
  • Index by author
Advertisement
Print
Download PDF
Email Article

Thank you for your interest in spreading the word on American Journal of Neuroradiology.

NOTE: We only request your email address so that the person you are recommending the page to knows that you wanted them to see it, and that it is not junk mail. We do not capture any email address.

Enter multiple addresses on separate lines or separate them with commas.
Distinguishing Recurrent Primary Brain Tumor from Radiation Injury: A Preliminary Study Using a Susceptibility-Weighted MR Imaging−Guided Apparent Diffusion Coefficient Analysis Strategy
(Your Name) has sent you a message from American Journal of Neuroradiology
(Your Name) thought you would like to see the American Journal of Neuroradiology web site.
CAPTCHA
This question is for testing whether or not you are a human visitor and to prevent automated spam submissions.
Cite this article
A. Al Sayyari, R. Buckley, C. McHenery, K. Pannek, A. Coulthard, S. Rose
Distinguishing Recurrent Primary Brain Tumor from Radiation Injury: A Preliminary Study Using a Susceptibility-Weighted MR Imaging−Guided Apparent Diffusion Coefficient Analysis Strategy
American Journal of Neuroradiology Jun 2010, 31 (6) 1049-1054; DOI: 10.3174/ajnr.A2011

Citation Manager Formats

  • BibTeX
  • Bookends
  • EasyBib
  • EndNote (tagged)
  • EndNote 8 (xml)
  • Medlars
  • Mendeley
  • Papers
  • RefWorks Tagged
  • Ref Manager
  • RIS
  • Zotero
0 Responses
Respond to this article
Share
Bookmark this article
Distinguishing Recurrent Primary Brain Tumor from Radiation Injury: A Preliminary Study Using a Susceptibility-Weighted MR Imaging−Guided Apparent Diffusion Coefficient Analysis Strategy
A. Al Sayyari, R. Buckley, C. McHenery, K. Pannek, A. Coulthard, S. Rose
American Journal of Neuroradiology Jun 2010, 31 (6) 1049-1054; DOI: 10.3174/ajnr.A2011
del.icio.us logo Twitter logo Facebook logo Mendeley logo
  • Tweet Widget
  • Facebook Like
  • Google Plus One
Purchase

Jump to section

  • Article
    • Abstract
    • Abbreviations
    • Materials and Methods
    • Results
    • Discussion
    • Conclusions
    • References
  • Figures & Data
  • Info & Metrics
  • Responses
  • References
  • PDF

Related Articles

  • No related articles found.
  • PubMed
  • Google Scholar

Cited By...

  • Utility of Intravoxel Incoherent Motion MR Imaging for Distinguishing Recurrent Metastatic Tumor from Treatment Effect following Gamma Knife Radiosurgery: Initial Experience
  • Histogram Analysis of Intravoxel Incoherent Motion for Differentiating Recurrent Tumor from Treatment Effect in Patients with Glioblastoma: Initial Clinical Experience
  • Crossref
  • Google Scholar

This article has not yet been cited by articles in journals that are participating in Crossref Cited-by Linking.

More in this TOC Section

  • Optimal MRI Sequence for Identifying Occlusion Location in Acute Stroke: Which Value of Time-Resolved Contrast-Enhanced MRA?
  • Evaluating the Effects of White Matter Multiple Sclerosis Lesions on the Volume Estimation of 6 Brain Tissue Segmentation Methods
  • Quiet PROPELLER MRI Techniques Match the Quality of Conventional PROPELLER Brain Imaging Techniques
Show more Brain

Similar Articles

Advertisement

Indexed Content

  • Current Issue
  • Accepted Manuscripts
  • Article Preview
  • Past Issues
  • Editorials
  • Editor's Choice
  • Fellows' Journal Club
  • Letters to the Editor
  • Video Articles

Cases

  • Case Collection
  • Archive - Case of the Week
  • Archive - Case of the Month
  • Archive - Classic Case

More from AJNR

  • Trainee Corner
  • Imaging Protocols
  • MRI Safety Corner
  • Book Reviews

Multimedia

  • AJNR Podcasts
  • AJNR Scantastics

Resources

  • Turnaround Time
  • Submit a Manuscript
  • Submit a Video Article
  • Submit an eLetter to the Editor/Response
  • Manuscript Submission Guidelines
  • Statistical Tips
  • Fast Publishing of Accepted Manuscripts
  • Graphical Abstract Preparation
  • Imaging Protocol Submission
  • Evidence-Based Medicine Level Guide
  • Publishing Checklists
  • Author Policies
  • Become a Reviewer/Academy of Reviewers
  • News and Updates

About Us

  • About AJNR
  • Editorial Board
  • Editorial Board Alumni
  • Alerts
  • Permissions
  • Not an AJNR Subscriber? Join Now
  • Advertise with Us
  • Librarian Resources
  • Feedback
  • Terms and Conditions
  • AJNR Editorial Board Alumni

American Society of Neuroradiology

  • Not an ASNR Member? Join Now

© 2025 by the American Society of Neuroradiology All rights, including for text and data mining, AI training, and similar technologies, are reserved.
Print ISSN: 0195-6108 Online ISSN: 1936-959X

Powered by HighWire