
Article Figures & Data
Figures
- Fig 1.
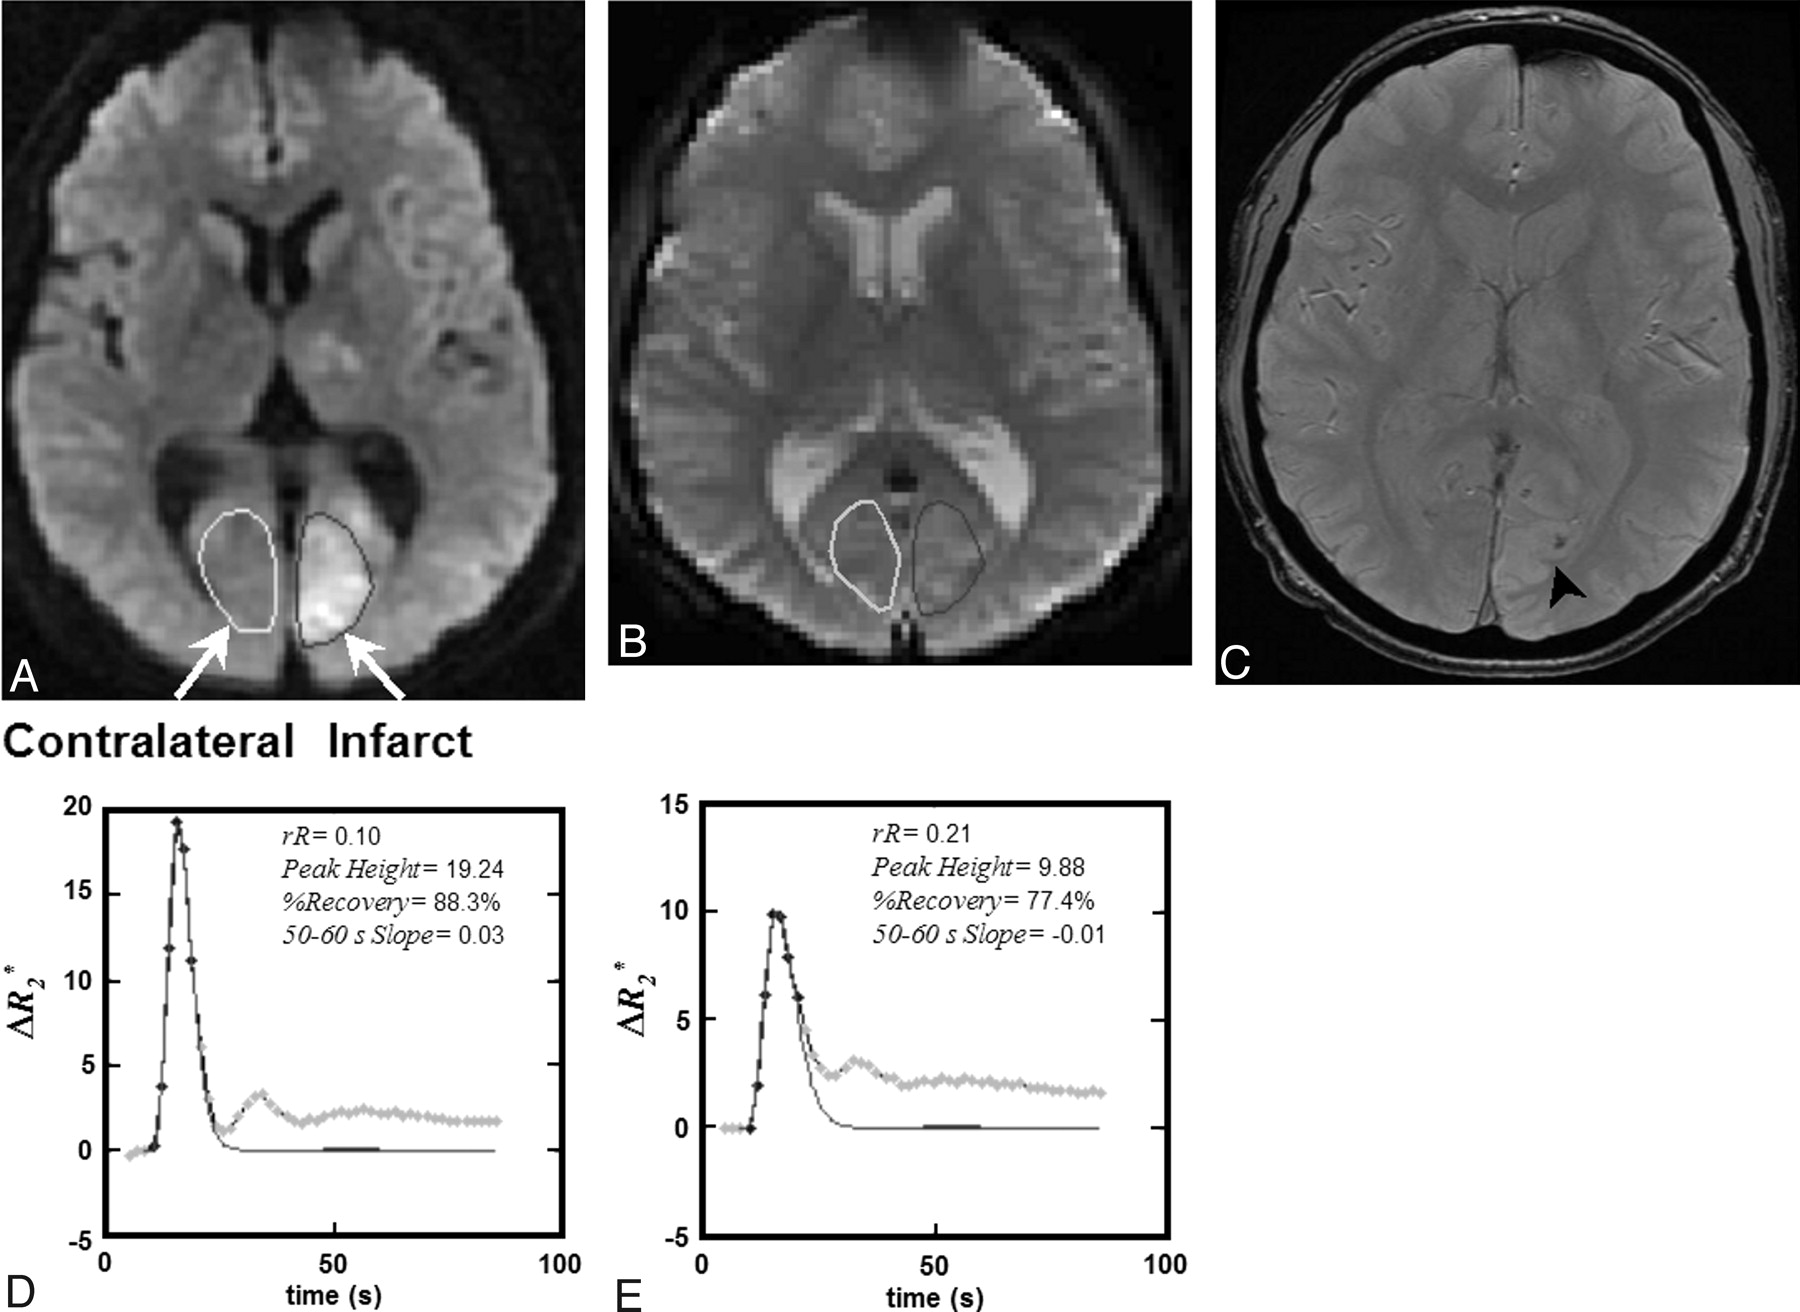
A, A 40-year old male patient with AIS, visible as hyperintensity on DWI obtained at 4 hours 6 minutes post-symptom onset. rtPA was not administered in this case. B, A region of interest was placed within the infarct, defined as the core area of reduced diffusion, and then copied to the equivalent T2*-weighted single-shot EPI sections. C, The equivalent follow-up gradient recalled-echo MR image obtained 24 hours later indicates an area of HT (HI1, arrowhead). D and E, Four T2*-based measures (rR, Peak Height, %Recovery, and Slope) were extracted from the ΔR2*measured versus time curves for both contralateral (D) and infarct (E) regions of interest and are provided on the inset of each plot.
- Fig 2.
A schematic representing a typical ΔR2* versus time curve (ΔR2*measured), as well as its γ-variate fit (ΔR2*theoretical), where ΔR2*max is the maximum of ΔR2*theoretical, A is the dynamic phase corresponding to the onset of the recirculation phase measured at half height of the descending aspect of the ΔR2*theoretical curve, and N is the final dynamic phase. The difference in area encompassed by the ΔR2*measured and ΔR2*theoretical curves is indicated by C. Four DSC parameters were calculated for each region of interest: rR = [C/ΔR2*max], Peak Height, %Recovery = [100% × (Peak Height − mean postbolus ΔR2*measured)/Peak Height], and Slope = slope of ΔR2*measured (t) between 50 and 60 seconds postinjection. Note that for %Recovery, the mean postbolus ΔR2*measured, was the average ΔR2*measured from phases A through N, inclusive.
- Fig 3.
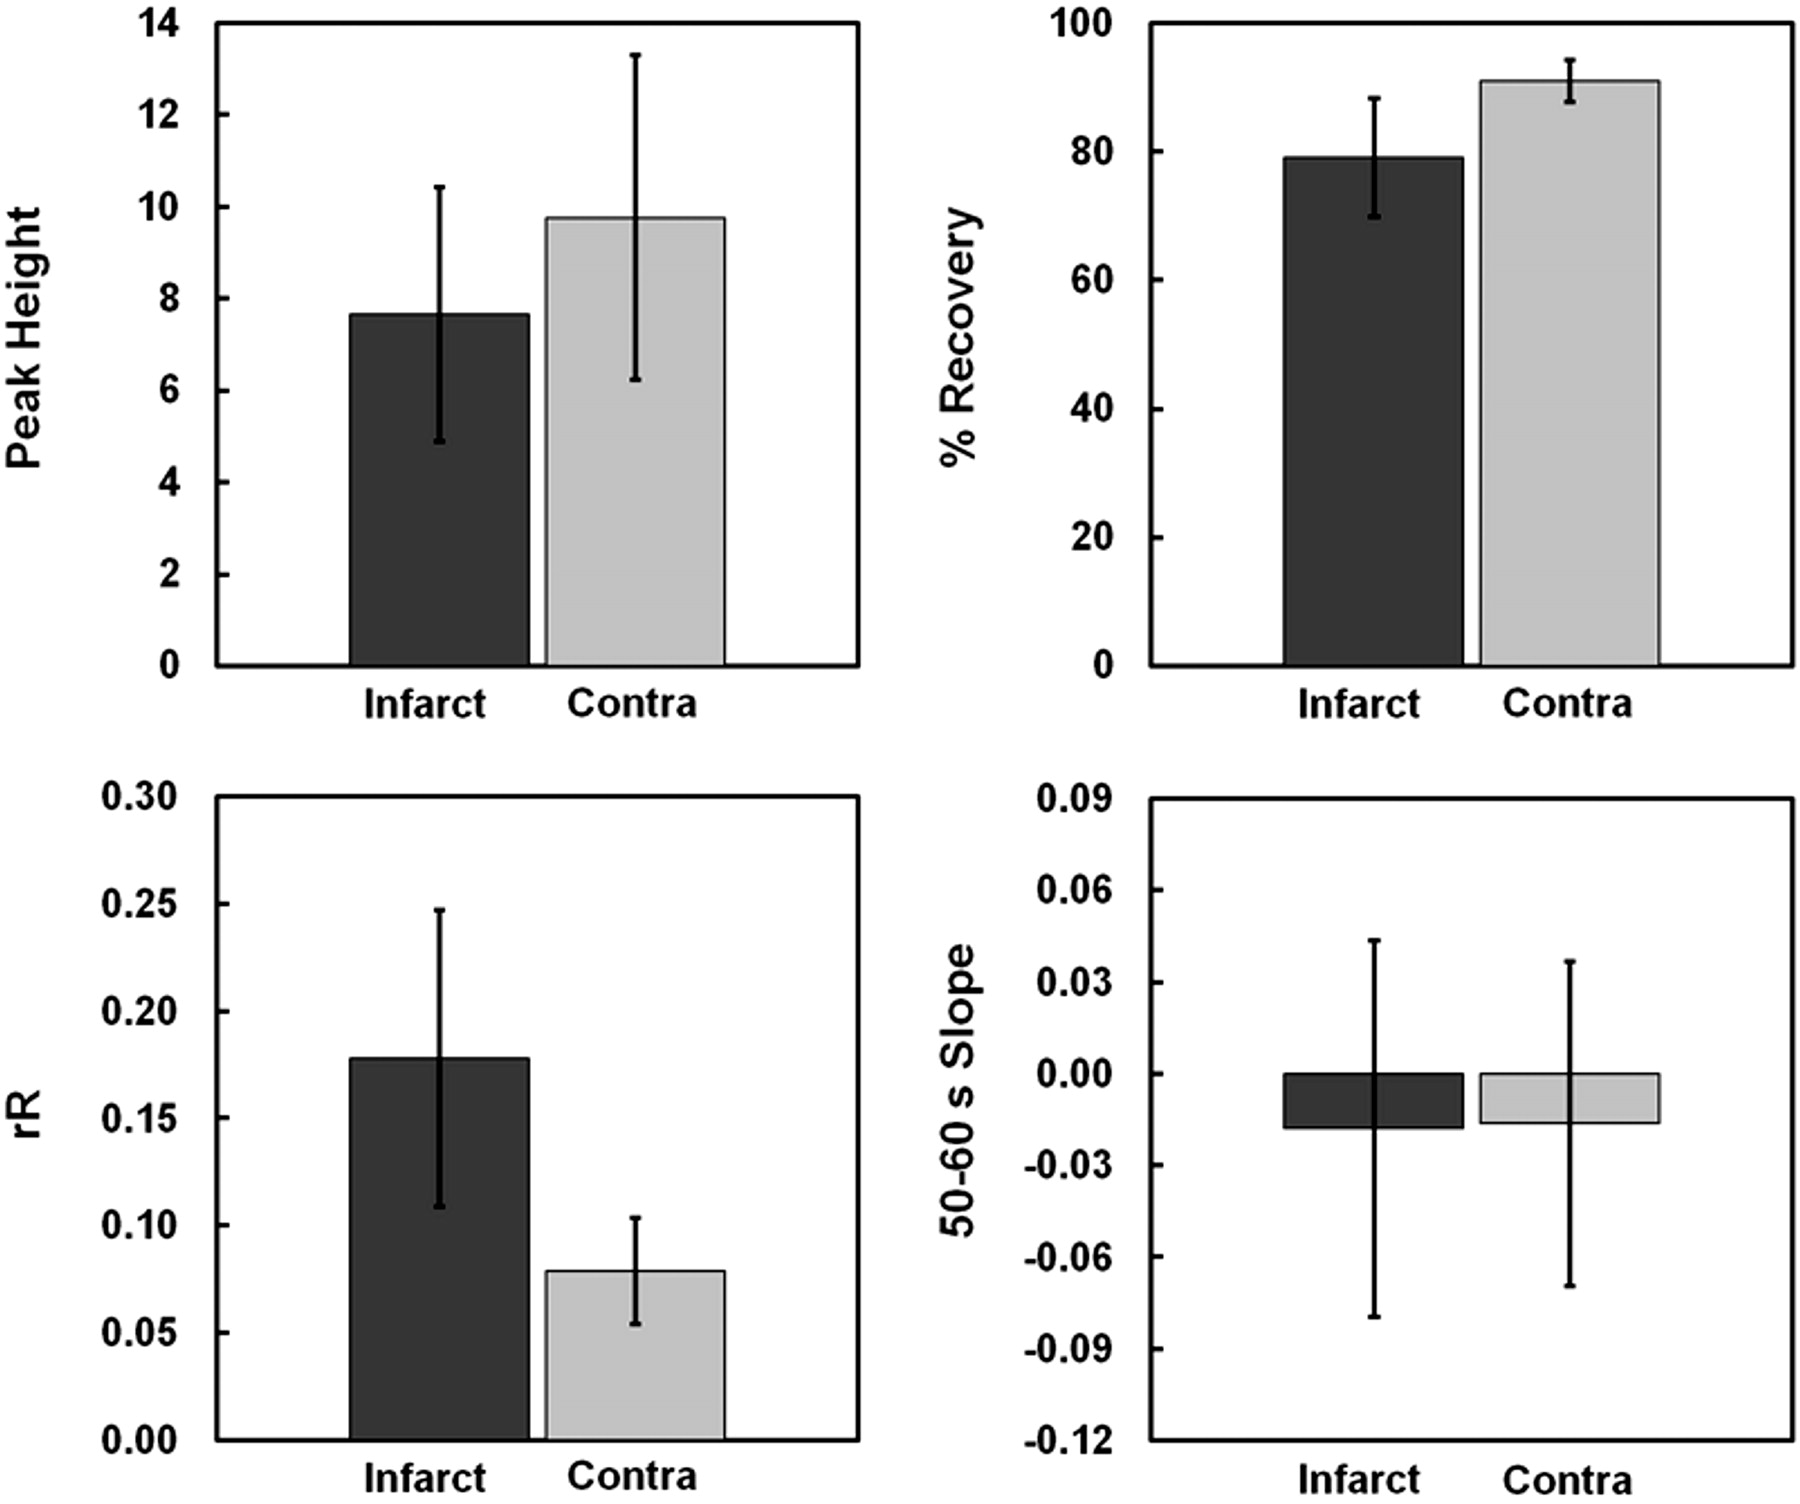
Mean values for the 4 candidate T2*-based surrogate measures (rR, Peak Height, %Recovery, and Slope) are displayed for both infarct and contralateral regions of interest. Wilcoxon signed rank tests revealed that Slope was the only T2*-based metric unable to delineate infarct from contralateral regions of interest (P = .84). The mean infarct rR was significantly elevated (P < .0001), while both Peak Height and %Recovery were significantly reduced, relative to contralateral regions of interest (P = .028 and P < .0001, respectively).
- Fig 4.
Mean values for the 4 candidate T2*-based surrogate measures (rR, Peak Height, %Recovery, and Slope) are displayed for infarct regions of interest corresponding to patients who subsequently hemorrhaged (HT) and those who did not (non-HT). Mann-Whitney U testing indicated that rR was capable of discriminating between HT and non-HT infarcts. While the mean rR for patients with HT was significantly elevated (P = .006 versus non-HT infarcts), there was a trend toward decreased %Recovery (P = .092 versus non-HT infarcts).
- Fig 5.
Scatterplots depict the relationship between KPS and each T2*-based measure: rR (A), Peak Height (B), %Recovery (C), and Slope (D). Of the 4 T2*-based measures investigated, only rR was significantly correlated with KPS (r = 0.64, P = .004). No significant correlations were identified between KPS and any of the other 3 T2*-based measures (%Recovery: r = −0.44, P = .07; Peak Height: r = 0.11, P = .65; Slope: r = −0.31, P = .22).
- Fig 6.
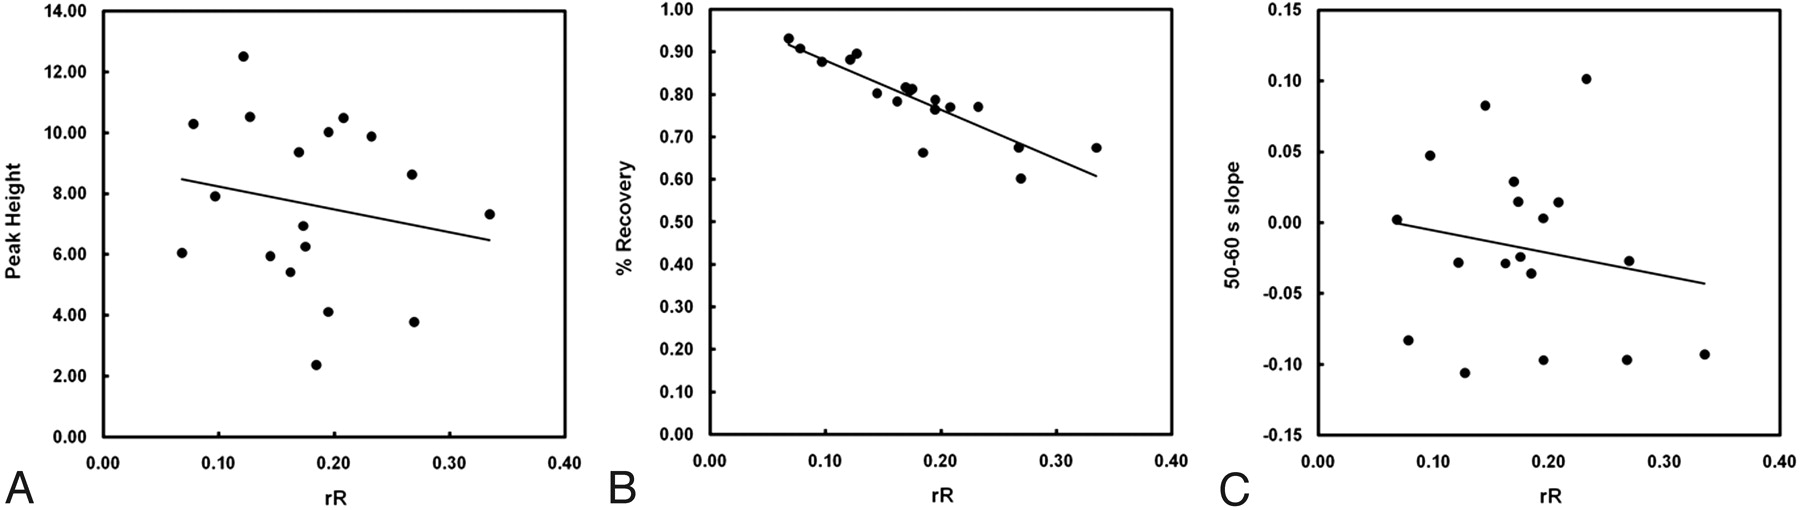
Scatterplots depict the relationship between rR and each of the other 3 candidate T2*-based measures: Peak Height (A), %Recovery (B), and Slope (C). Linear regression revealed a significant negative correlation between %Recovery and rR (r = −0.88, P < .001). No significant correlations were determined for either Peak Height or Slope with rR (r = −0.19, P = .46 and r = −0.18, P = .48, respectively).
- Fig 7.
Box-and-whisker plots display the distributions of infarct KPS (A) and rR (B) for patients with negative and positive Slope values (dotted-line indicates mean; dashed-line, median; box range, 25th–75th percentile; whiskers, 10th and 90th percentiles). While the mean and median KPS values appear greater in the negative Slope group, these differences were not significant (P = .15). The rR values measured in the negative Slope group were not significantly different from those in the positive Slope group (P = .27).


In this issue


Jump to section
Related Articles
Cited By...
- Pretreatment Blood-Brain Barrier Damage and Post-Treatment Intracranial Hemorrhage in Patients Receiving Intravenous Tissue-Type Plasminogen Activator
- Association of CT Perfusion Parameters with Hemorrhagic Transformation in Acute Ischemic Stroke
- Effects of Microvascular Permeability Changes on Contrast-Enhanced T1 and Pharmacokinetic MR Imagings After Ischemia
- Serum tight-junction proteins predict hemorrhagic transformation in ischemic stroke patients