
Abstract
BACKGROUND AND PURPOSE: SWI is known for its detailed visualization of the cerebral venous system and seems to be a promising tool for early detection of cerebrovascular pathologies in children, who are frequently sedated for MR imaging. Because sedation influences cerebral hemodynamics, we hypothesized that it would affect cerebral venous contrast in SWI.
MATERIALS AND METHODS: SWI (125 examinations) of 26 patients (age, 2–16 years) was reviewed in this study. Images were acquired of patients sedated with propofol. Reviewers classified the images by weak or strong venous contrast. Physiologic data, such as etCO2, BP, age, and CBF by arterial spin-labeling, were monitored and collected during MR imaging. A generalized estimating equation approach was used to model associations of these parameters with venous contrast.
RESULTS: EtCO2 and CBF were found to correlate with venous contrast, suggesting that patients with high etCO2 and CBF have weak contrast and patients with low etCO2 and CBF have strong contrast. BP was also found to correlate with the venous contrast of SWI, suggesting that patients with high BP have strong venous contrast. No significant correlations were found for any other physiologic parameters.
CONCLUSIONS: We found that the venous contrast in SWI is affected by propofol sedation in spontaneously breathing patients. We also found that low etCO2, low CBF, and high BP are associated with strong venous contrast. Reviewing SWI data in light of physiologic measures may therefore help prevent potential misinterpretations of weak venous contrast in SWI examinations under propofol sedation.
Abbreviations
- ASL
- arterial spin-labeling
- BOLD
- blood oxygenation level–dependent
- BP
- blood pressure
- CBF
- cerebral blood flow
- etCO2
- end-tidal carbon dioxide
- FA
- flip angle
- GEE
- generalized estimating equations
- PET
- positron-emission tomography
- Q2TIPS
- quantitative imaging of perfusion using single subtraction, second version, with thin-section TI1 periodic saturation
- RBC
- red blood cell count
- RR
- respiration rate
- SWI
- susceptibility-weighted imaging
Susceptibility-weighted imaging reveals the cerebral venous system with great anatomic detail.1,2 The signal intensity, which determines the contrast of venous vessels in SWI, depends on the deoxyhemoglobin concentration in the blood and is referred to as the BOLD signal intensity.3 Under normal physiologic conditions, cerebral venous blood has an oxygenation level of ∼50%,4 and venous vessels appear hypointense on SWI, with good contrast to their surrounding brain tissue. Variations of the BOLD signal intensity depend mainly on changes in the CBF. With increased global CBF due to carbogen (95% O2, 5% CO2) inhalation,5 the venous blood oxygenation level is increased, causing a higher venous BOLD signal intensity. Therefore, cerebral veins appear almost isointense in SWI, and their contrast to the surrounding tissue vanishes.6 On the other hand, CBF can be easily decreased globally by, for example, common doses of caffeine,7 decreasing venous blood oxygen saturation, lowering BOLD signal intensity, and thereby increasing venous contrast in SWI.8 Detection of neuronal activation is also commonly achieved by repeated measurements of BOLD signal intensity changes. Here, CBF in activated areas increases, exceeding the actual demand for oxygen of the activated neurons,9 resulting in a higher blood oxygenation level and consequently a higher BOLD signal intensity.10
SWI is a powerful diagnostic tool for early detection and better characterization of cerebrovascular malformations, hemorrhages, iron deposits, and calcifications in children.11 However, MR imaging examinations of very young children are frequently performed under sedation by using the common anesthetic propofol.12,13 It was shown by a 15O-PET study in propofol-sedated healthy men14 that cerebral metabolism and CBF were comparably decreased, keeping the oxygen extraction fraction constant. Therefore, venous blood oxygen saturation and BOLD signal intensity should not be directly affected due to propofol sedation. However, CO2 reactivity of cerebral vessels and autoregulation of brain perfusion are retained under propofol sedation.15-18 As pediatric patients breathe spontaneously during sedation while undergoing MR imaging, their respiration is depressed by propofol.19 Therefore, propofol indirectly increases the partial pressure of CO2 in the arterial blood, causing cerebral vessel dilation,20 leading to an increase in CBF21 and a consequent rise in the BOLD signal intensity, which in turn attenuates the contrast of cerebral veins on SWI.6 This effect was recently observed in a limited number of cases without sufficient evidence.22 Although the authors hypothesized that this finding could be caused by a change of cerebral metabolism and arterial oxygen saturation due to sedation, they were not able to prove or refute this. Nevertheless, a correlation between sedation and venous contrast in SWI is likely, and this relationship needs to be better understood to allow correct interpretation of SWI data. Even though it is not anticipated that prominent (ie, clinically relevant) pathologies such as arteriovenous malformations23,24 or Sturge-Weber syndrome25,26 would be missed if venous contrast were attenuated due to propofol sedation, it is possible that the exact extent or degree of the disease could be underestimated. On the other hand, with SWI becoming more widely available, it is conceivable that different levels of venous contrast might be used in the future to better differentiate diagnoses or to stage diseases, as recently presented by Newbern et al27 at the 2009 annual meeting of the American Society of Neuroradiology.
Therefore, the purpose of this study was to investigate the effect of sedation with propofol on venous contrast in SWI. We hypothesized that physiologic measures such as blood pressure, heart rate, respiration rate, and etCO2, which reflect the effect of sedation on respiration and the cardiovascular system, would correlate with the apparent contrast of cerebral veins in SWI. We thereby assumed that other physiologic parameters such as patient age or time of treatment should not correlate with the venous contrast in SWI images exhibiting healthy brain tissue. Testing these hypotheses should help to prevent potential misinterpretation of SWI images acquired under sedation.
Materials and Methods
SWI data were collected from 26 patients (14 girls, 12 boys; age at diagnosis, 2–16 years) who were enrolled between May 2006 and February 2009 in an institutional review board-approved clinical phase I trial at our institution. The patients had diagnoses of diffuse pontine glioma and were being treated with local radiation therapy to the brain stem (n = 25) or to the whole brain (n = 1). Radiation was fractionated and administered over 6 weeks (30 fractions, 54 Gy total dose).28 During the study, patients received vandetanib (Zactima; ZD6474), an antiangiogenic drug.29 A secondary objective of the phase I trial was to assess vascular changes during therapy by advanced MR imaging techniques. SWI images were acquired on a 3T clinical MR imaging scanner (Magnetom Trio; Siemens Medical Solutions, Erlangen, Germany). Imaging parameters were: TE/TR/FA, 25 ms/56 ms/20°; FOV, 230 × 115 × 144 mm3; matrix, 512 × 254 × 72; voxel size, 0.45 × 0.45 × 2 mm3; parallel imaging acceleration factor, 2. Six consecutive scans were acquired in 14 patients, and 12 patients received from 1 to 5 MR imaging examinations in our study. Follow-up examinations were performed about 2 weeks and about 1, 2, 4, and 6 months after the first scan. In total, 125 SWI examinations covering the whole brain were rated in consensus by 2 reviewers. The venous contrast in SWI was classified in 2 groups: group 1 showing good to strong contrast and group 2 showing weak to almost no venous contrast between cerebral veins and parenchyma (Fig 1). The characteristic criterion for strong contrast was good delineation of cortical venous vessels. Examinations with missing contrast of cortical veins while maintaining intermediate deep venous vessel contrast were categorized as weak venous contrast.

Example of SWI data demonstrating venous contrast classification. All images were generated and visualized by using identical parameters. Examinations with obviously vanished veins (A) as well as examinations showing missing contrast of cortical veins (thin arrow) while maintaining intermediate contrast of deep veins (thick arrow) (B) were categorized as weak venous contrast. Examinations showing strong contrast of deep veins while maintaining intermediate contrast of cortical veins (C) and examinations with obviously strong venous contrast for all veins (D) were categorized as strong venous contrast.
As confirmed by radiation therapy dose maps, inferior parts of the brain (ie, medulla oblongata, brain stem, and cerebellum) were subject to high doses, making radiation-induced vasculopathy likely. Therefore, only veins of the cerebrum were used for evaluation to minimize any compromising effect of high radiation doses.
The complete set of diagnostic images of the patient who received radiation to the whole brain was carefully reviewed for abnormal features that might be related to radiation therapy. Because no abnormalities were evident, this patient's SWI examinations were not excluded from our study.
One patient presented with supratentorial and infratentorial tumor dissemination via CSF (leptomeningeal disease) at the time of the fourth MR imaging examination. Because of this, the patient was taken off the clinical trial and his last examination was also excluded from further evaluation in our study, because it is possible that leptomeningeal tumor spread may compromise venous contrast on SWI through compromising venous outflow and causing congestion within transmedullary veins.
Of the 125 SWI scans performed, 114 were acquired under sedation with the patient breathing spontaneously. Eleven examinations were not performed with the patient under sedation and were not formally evaluated. Sedation was maintained by infusion of propofol (150–300 μg/kg/min). The individual doses were adjusted by the anesthesiologists to allow a smooth MR imaging examination with minimal risk for the patient. Due to different individual sensitivities to the anesthetic, the actual dose of propofol was not correlated with venous contrast. We instead investigated physiologic measures, which are potential measures of the actual effect of propofol on the subject. During the SWI scan, the following physiologic parameters were monitored and recorded: pulse, systolic and diastolic BP, respiration rate, and etCO2. To further investigate whether nonsedation-related physiologic parameters also affect venous contrast in SWI, we correlated patient age at examination and red blood cell count with venous contrast. As an additional measure of the effect of sedation on CBF, ASL perfusion data by using a Q2TIPS sequence was evaluated along with the SWI data.30 ASL sequence parameters were: TE/TR, 23 ms/2280 ms; TI1/TI2, 700 ms/1400 ms; FOV, 210 × 210 mm2; matrix = 64 × 64; section thickness, 5 mm; 11 sections. Quantitative CBF values were calculated for sections located above the anteroposterior commissure line following a method proposed by Wang et al.31 The mean CBF value for gray matter was calculated by using a histogram-based segmentation algorithm (ie, thresholding technique) of the upper brain CBF values.
Statistical Methods
Logistic regression models32 were used to investigate the association of physiologic measurements with venous contrast at single time windows (eg, baseline scans, week 2 scans, and week 4 scans) in a cross-sectional fashion to guide the rest of the statistical analyses. In such models, venous contrast was a dichotomous response, and each physiologic variable was investigated independently. After identifying physiologic variables of interest that were associated with venous contrast in at least 1 time window, the investigation was performed in a longitudinal fashion, by using GEE models,33 which take into account intrapatient variability as patients have serial examinations over time. In the GEE models, venous contrast in SWI was again a dichotomous response, assuming binomial distribution with a logit link function, which is commonly used for binary data. Because the time intervals between the subsequent examinations were not equally spaced and not identical between patients, a spatial-power covariance structure was used to take into account intrapatient correlations. As this was an exploratory analysis, P values reported were not adjusted for multiplicity, and the results must be considered in the context of an exploratory analysis and should be confirmed with larger prospective studies.
Results
All of the 11 MR imaging examinations acquired without sedation showed strong venous contrast. Because physiologic data were not monitored during those scans, they were excluded from further statistical analysis. MR imaging examinations under sedation showed weak venous contrast by our classification in 55 SWI scans and strong contrast in 59. As shown in Fig 2 , this variation of contrast was observed even in the same subjects on different examination dates. Only 3 patients showed consistently weak venous contrast for all examinations.

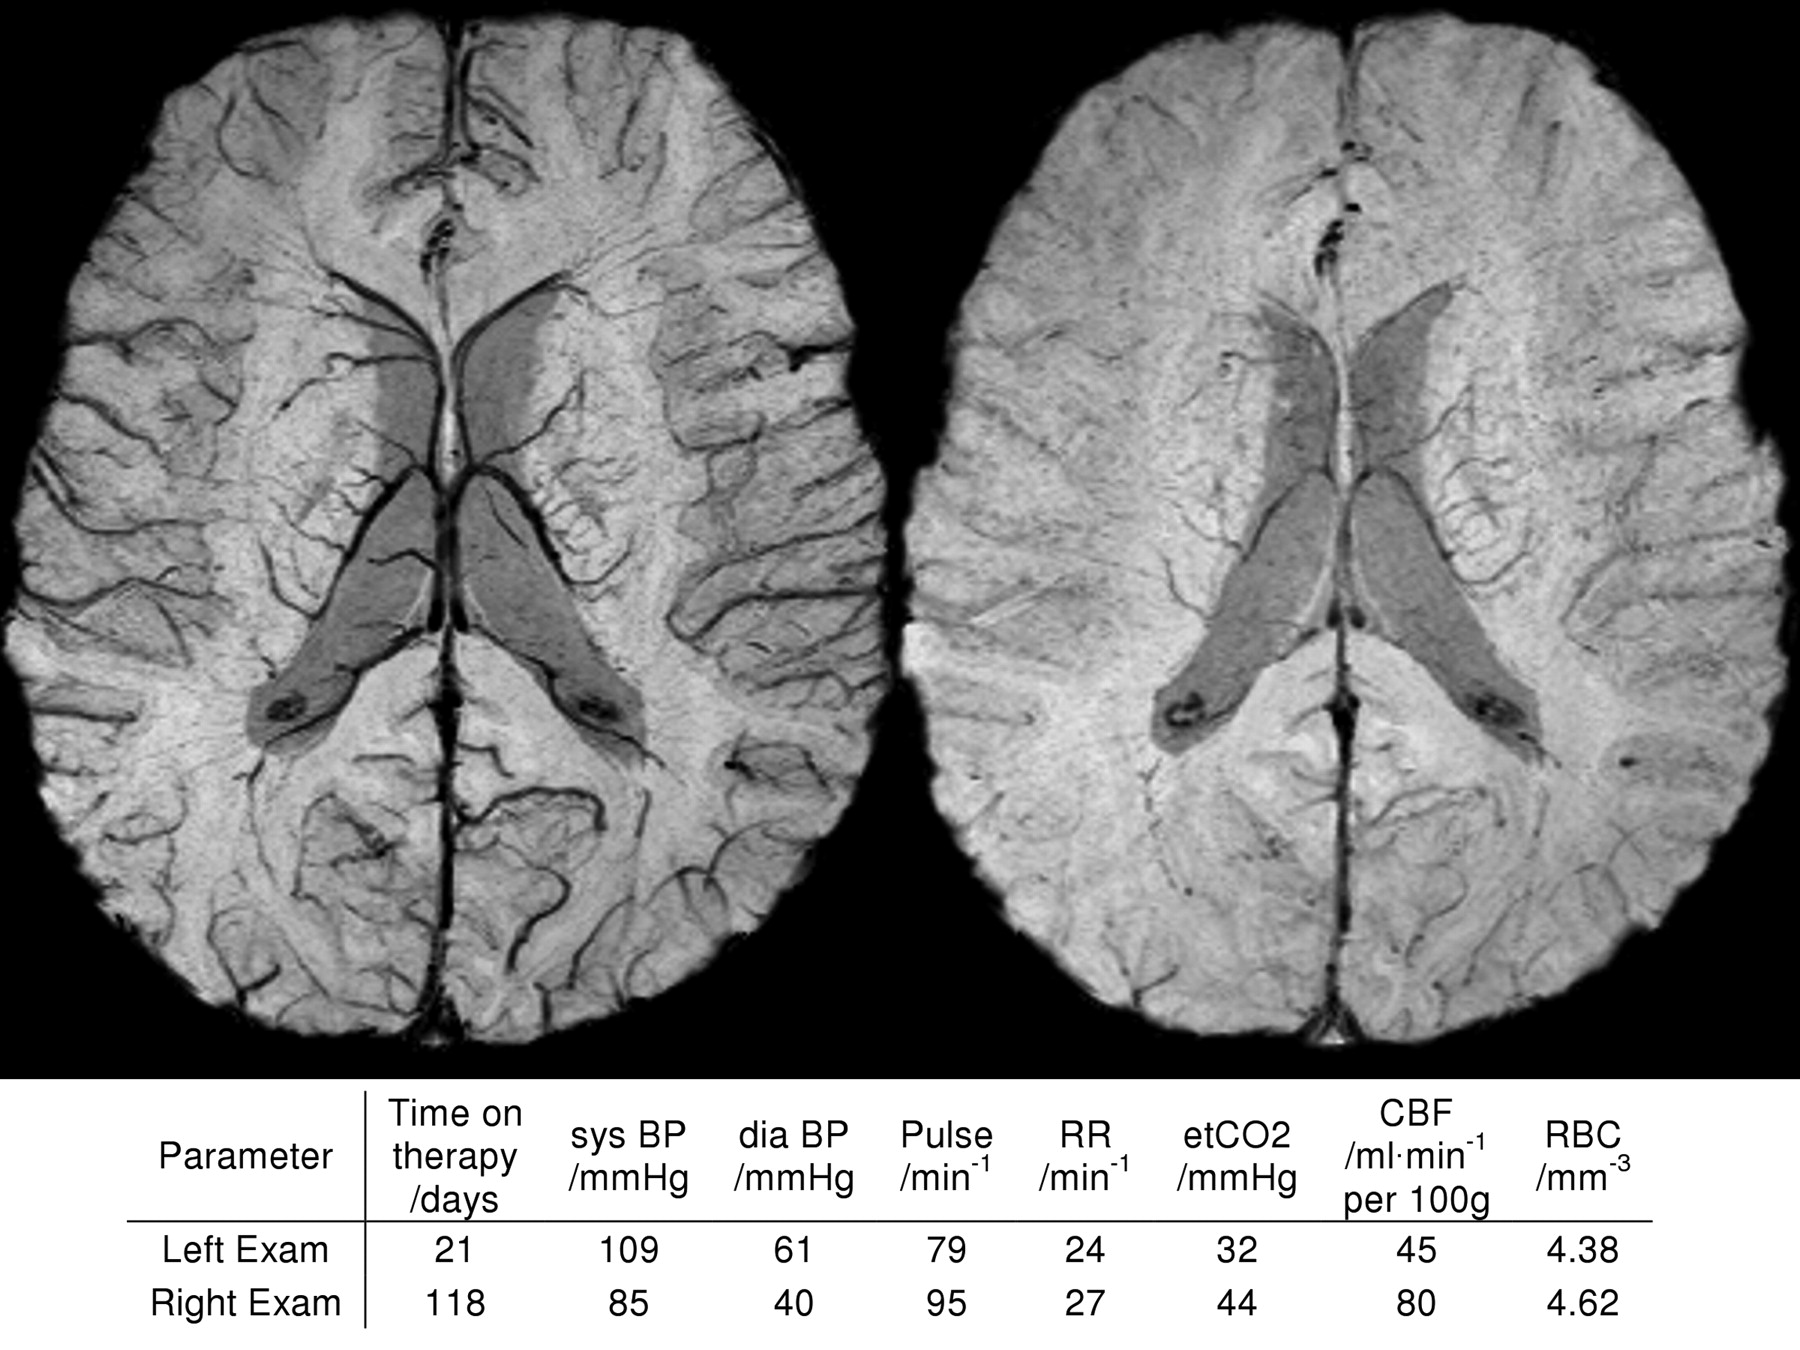
Example SWI data of a 7-year-old patient on 2 different examination dates to demonstrate the intrasubject variation of venous contrast. The patient was sedated for both MR imaging examinations. Physiologic measures (BP, RR, etCO2, CBF, RBC) at both examinations are shown for comparison. The images were generated and visualized by using identical parameters.
Figure 3 shows the variation in etCO2 between the 2 contrast groups at all MR imaging examination dates. For etCO2, a clear trend was observed. The mean and median values were always smaller in the group with good venous contrast. The results of the cross-sectional analysis with logistic regression models for all physiologic measures are summarized in Table 1. The previous visual finding for etCO2 (Fig 2) was supported by a significant association of etCO2 at every time point. As also shown in Table 1, segmented gray matter CBF measures were significantly associated with low SWI contrast for the second to the fifth MR imaging examinations. Systolic and diastolic BP showed significance only at the second time point. All other parameters showed no significant association in the cross-sectional analysis and thus were not further evaluated with the GEE models. Systolic BP and gray matter CBF were also excluded from further evaluation because they were highly correlated with diastolic BP and etCO2, respectively. As expected, however, gray matter CBF was strongly associated with venous contrast in a univariate GEE model (odds ratio = 0.94, P = .0003). Here, the odds ratio suggests that patients with higher gray matter CBF have poorer venous contrast.
Odds ratio estimates (Pvalues) from logistic regression models for individual time points of consecutive MR imaging examinations

Scatter and boxplots shown for etCO2. Exhaled CO2 is plotted for both groups of different venous contrast in SWI and separately for all 6 time points of consecutive MR imaging examinations. The asterisk within the boxplot denotes the mean value of the particular etCO2 distribution.
The first GEE model (Table 2) resulted in a significant (P < .0001) odds ratio of 0.75, which suggests that, for high etCO2 values, strong venous contrast is less likely than weak contrast in SWI. In the second analysis, etCO2 and diastolic BP were investigated in one multivariate GEE model, which again led to significant odds ratios of 0.78 (P = .0018) for etCO2 and 1.09 (P = .0056) for diastolic BP. Here, the odds ratio >1 implies that patients who presented with higher diastolic BP were more likely to show strong venous contrast in SWI.
Odds ratio estimates with confidence intervals and P values from GEE models for the parameters of interest
Both GEE models showed that venous contrast did not change significantly over treatment time. This observation is important because it implies that there were probably no therapy-induced effects on venous contrast in the cerebrum, which was not directly targeted by 3D conformal radiation therapy and, thus, received only minor doses. In agreement with this is the finding that the RBC count did not correlate with venous contrast, because any therapy-induced changes in the RBC count would have to be corrected by blood transfusions.34 No correlation of venous contrast with patient age was found in our study.
Discussion
Our analysis of SWI data from sedated patients showed that such imaging studies should be conducted under well-adjusted physiologic conditions to achieve a good venous contrast and to be able to make reliable comparisons between patients or between scans of an individual patient over time. In particular, etCO2 was strongly associated with venous contrast and should be well controlled.
We are confident that the radiation treatment of our patients did not compromise the validity of our study, because the observed associations of venous contrast in SWI with etCO2, CBF, and BP were already obvious in the first scan, which was acquired before onset of radiation and antiangiogenic therapy (Table 1, first examination).
We concluded from our pediatric patients (age, 2–16 years), who were sedated during MR imaging, that age-related changes in physiology have no effect on the observed venous contrast in SWI. There is, however, no evidence based on our results that there is an age dependency of venous contrast for healthy nonsedated subjects, in particular, when considering a significant drop in CBF over several decades of life.35
Because we argued that sedation affects respiration, it was interesting that no correlation of respiration rate with venous contrast was found. However, respiration rate is not a measure of the actual tidal volume and thus cannot give evidence of the actual depression of respiration. A similar finding was reported by Iwama et al,19 who observed a decrease in tidal volume but not in respiration rate while increasing the propofol infusion rate. The only measure of respiration attenuation available to the anesthesiologist is etCO2,36 which was found in our study to be strongly associated with the observed venous contrast in SWI. Based on that finding, it might be possible to ensure good venous contrast in SWI by controlling sedation in such a way that etCO2 is kept as low as possible. Karsli et al16,18 reported a maximal etCO2 value of 30–35 mmHg for which CBF in sedated children is not artificially elevated. This is also in agreement with our findings for CBF, where lower CBF values were accompanied by lower etCO2 and good venous contrast. Conversely, higher CBF was associated with higher etCO2 and weak venous contrast, which was confirmed by the consistent odds ratios <1 for CBF in Table 1 and for the univariate GEE model (see Results). All of these findings are in perfect agreement with our introductory argument and support our hypothesis that etCO2 reflects respiration attenuation due to intravenous propofol sedation and correlates with venous contrast in SWI.
The observed correlation between diastolic BP and venous contrast suggests that higher BP is associated with good venous contrast, lower etCO2, and lower CBF, and that lower BP is linked with weak venous contrast, higher etCO2, and higher CBF, which was confirmed by the consistent odds ratios >1 for diastolic BP (Tables 1 and 2). This finding is very interesting, because one would expect high BP to cause high CBF and low BP to cause low CBF. However, it was shown that the autoregulatory mechanism of brain perfusion works more efficiently for lower etCO2 than for higher etCO2.37 This could explain the contradictory association between BP and CBF.
Because our ultimate goal is to monitor therapy-induced changes in tumor tissue of pediatric patients, we have to further investigate to what extent sedation compromises CBF or SWI measurements of tumor tissue. Our study showed that respiration attenuation due to propofol sedation can alter CBF and SWI contrast in healthy brain tissue. Thus, it might be necessary to correct for sedation-induced effects while monitoring tumors. Future studies that involve CBF and SWI measurements should be acquired under controlled physiologic conditions during sedation. It is also conceivable that the observed sedation effect could be used to assess CO2 reactivity as a pathophysiologic marker of tumor vessels.38
We are confident that this effect does not degrade the detection of hemorrhages in sedated patients as reported by Tong et al,39 because the hemorrhagic contrast is caused by extravascular deoxyhemoglobin and methemoglobin rather than by the presence of intravenous deoxyhemoglobin. Also note that findings of passive functional MR imaging studies40,41 might be compromised by the respiratory attenuation of propofol because the magnitude of the BOLD signal intensity responses are most likely lowered due to elevated resting state perfusion of the brain. Therefore, an increased variation over different subjects or multiple examinations of the same subjects is anticipated for quantitative findings such as the magnitude of BOLD signal intensity responses or numbers of activated voxels.
Conclusions
Based on the results of our analysis, we conclude that it is necessary to acquire SWI data of sedated patients under well-controlled physiologic conditions to achieve a good venous contrast and to be able to make reliable comparisons between different patients or follow-up scans. It was found that etCO2 was strongly associated with venous contrast and must be kept <30–35 mmHg, as reported by Karsli et al,16,18 to achieve good venous contrast in SWI. If etCO2 cannot be well controlled in sedated, spontaneously breathing patients, we strongly recommend reviewing SWI data in light of etCO2, BP, and CBF measures acquired at the same physiologic state to prevent potential misinterpretation of venous contrast in SWI.
Acknowledgments
We thank Dr. George Bikhazi (Department of Anesthesiology, St Jude Children's Research Hospital) for helpful discussion and Nikita Oigbokie (Clinical Investigation, Department of Radiologic Sciences, St Jude) for collecting patient data. The authors are indebted to Dr. Arzu Onar (Department of Biostatistics, St Jude) for critical review of the manuscript, and to David Galloway (Department of Scientific Editing) for editorial review.
Footnotes
Indicates Editor's Choices selection

-
This study was supported by American Lebanese Syrian Associated Charities (ALSAC) and in part by the German Academic Exchange Service (DAAD, Grant PPP-D/06/29424).
-
Previously presented in part at: American Society of Neuroradiology 47th Annual Meeting, Vancouver, British Columbia, Canada, May 16–21, 2009; and the International Society for Magnetic Resonance in Medicine, 17th Scientific Meeting and Exhibition, April 18–24, 2009.

Indicates open access to non-subscribers at www.ajnr.org
References
- Received August 14, 2009.
- Accepted after revision October 15, 2009.
- Copyright © American Society of Neuroradiology


