
Abstract
BACKGROUND AND PURPOSE: Fetal origin of the PCA is a common anatomic variation of the circle of Willis. On perfusion imaging, patients with unilateral fetal-type PCA may demonstrate left-right asymmetry that could mimic cerebrovascular disease. The aim of this study was to characterize the relationship between a fetal-type PCA and asymmetry of hemodynamic parameters derived from MR perfusion imaging.
MATERIALS AND METHODS: We retrospectively reviewed MR perfusion studies of 36 patients to determine the relationship between hemodynamic and vascular asymmetries in the PCA territory. Perfusion asymmetry indices for the PCA territory were computed from maps of rCBF, rCBV, MTT, Tmax, and FMT. Vascular asymmetry indices were derived from calibers of the PCA-P1 segments relative to the posterior communicating arteries.
RESULTS: Asymmetrically smaller values of FMT and Tmax were observed with unilateral fetal-type PCA, and these were strongly correlated with the degree of vascular asymmetry (Spearman's rho = 0.76 and 0.74, respectively, P < 1 × 10⁻⁶). Asymmetries of rCBF, MTT, and rCBV were neither significant nor related to vascular asymmetry.
CONCLUSIONS: Faster perfusion transit times are seen for parameters sensitive to macrovascular transit effects (eg, FMT and Tmax) ipsilateral to fetal origin of the PCA in proportion to the degree of arterial asymmetry. Knowledge of this normal variation is critical in the interpretation of perfusion studies because asymmetry could mimic cerebrovascular pathology.
Abbreviations
- AI
- asymmetry index
- AIF
- arterial input function
- ASSET
- array spatial sensitivity encoding technique
- FMT
- first moment of tissue response
- MRA
- MR angiography
- MTT
- mean transit time
- PCA
- posterior cerebral artery
- PcomA
- posterior communicating artery
- rCBF
- relative cerebral blood flow
- rCBV
- relative cerebral blood volume
- ROI
- region of interest
- 3D TOF
- 3D time-of-flight
- Tmax
- time-to-peak of deconvolved residue function
- vAI
- vascular asymmetry index
Imaging of cerebral perfusion with CT and MR imaging is becoming commonplace in the clinical evaluation of acute stroke and other cerebrovascular diseases. Methods for performing perfusion imaging vary widely with respect to the mathematical models used, the assumptions made, and the parameters measured. Some approaches or parameters may be more or less sensitive to macrovascular hemodynamics, eg, the transit of blood through the major arteries that supply the brain (internal carotid and vertebrobasilar systems) and in turn through their major branches (anterior and middle cerebral arteries from the internal carotids, posterior cerebral arteries from the basilar). For example, flow-dependent parameters derived directly from unprocessed tissue response curves (eg, time-to-peak, first moment) are inherently more sensitive to macrovascular transit effects than are those derived from so-called “residue functions” that are obtained when tissue responses are deconvolved by using a measured arterial input function (eg, CBF, MTT). Given the dependence of some commonly measured perfusion parameters on macrovascular arterial transit phenomena, it is important to consider the manner and extent to which normal variations in arterial anatomy might influence such parameters in clinical practice.
For example, the unilateral presence of so-called “fetal origin” of the posterior cerebral artery (1 PCA arising not from the basilar artery but from the internal carotid, prevalence ∼11%–29%1) introduces into the cerebral hemispheres a substantial left-right asymmetry of arterial network topography, one that may substantially affect certain perfusion measurements through alterations in macrovascular arterial transit. We have noticed anecdotally that asymmetry exists in some perfusion maps in the presence of a unilateral fetal PCA. To a radiologist interpreting brain images, particularly those images that are either purely qualitative or only semiquantitative (eg, maps of rCBF), left-right asymmetry serves a critically important function as a visual cue to the presence of pathology. Therefore, it is incumbent upon radiologists to understand any asymmetry in perfusion images that might result not from pathology but from normal variations in arterial anatomy. The purpose of this study was to evaluate the effects of fetal origin of the PCA on some of the commonly measured perfusion parameters, with attention to potentially disease-mimicking left-right asymmetry.
Materials and Methods
Patients
We retrospectively reviewed perfusion MR imaging studies of 36 patients (14 men and 22 women; age range, 19–87 years; mean age, 60.2 ± 14.1 years) presenting for contrast-enhanced MR imaging head examination between September 2006 and June 2008. These patients were selected based on the appearance of their circle of Willis on MRA (one or both posterior cerebral arteries demonstrating fetal-type origin, either partially or completely). Patients were excluded if significant cerebrovascular disease was evident on MR imaging/MRA of the brain or MRA of the neck. Of the scans performed on the 36 subjects, 18 were to rule out stroke, 6 were to evaluate movement disorders, 5 were to evaluate for carotid or vertebral artery stenosis, 3 were to rule out arterial dissections, 2 were to evaluate for headache, and 1 each were to rule out metastases and aneurysm. This study was approved by our institutional review board and informed consent was not required.
Image Acquisition
Dynamic susceptibility contrast perfusion imaging was performed on 1.5T or 3T MR imaging systems (Signa HDx; GE Healthcare, Milwaukee, Wiconsin). Whole-brain coverage was achieved with a multiphase gradient-echo echo-planar imaging sequence. Imaging parameters were: FOV = 22 cm, section thickness/spacing = 7/2 mm, matrix = 128 × 64 (1.5T) and 128 × 128 (3T), number of sections = 14–18, flip angle = 60°, scan time = 72 seconds, and parallel imaging (ASSET) factor = 2 (3T only). Due to differences between 1.5T and 3T and to a change in the clinical perfusion MR imaging protocol in February 2008, 4 combinations of TR/TE/number of phases were used: 2000/60/36 (1.5T, 11 patients); 1500/45/48 (1.5T, 20 patients); 2000/31/36 (3T, 2 patients); 1500/31/48 (3T, 3 patients); the total scan time was constant at 72 seconds. Injection of 20 mL of gadobenate dimeglumine (MultiHance, Bracco Diagnostics, Princeton, New Jersey) at a rate of 4.0 mL/s occurred 12 seconds into the scan to allow acquisition of several baseline frames.
MRA of the circle of Willis was performed by using clinically routine noncontrast 3D TOF with a multiple overlapping thin-slab acquisition and the following parameters: TR/TE/flip angle = 31 milliseconds/6.9 milliseconds/30°, section thickness = 1.6 mm, 75% FOV, NEX = 1, and a 512 × 512 × 16 matrix. Additionally, magnetization transfer and fat suppression were used when acquired on the 3T system. Maximum intensity projection reconstructions were generated from source images at multiple projection angles to aid visualization of vascular anatomy.
Image Processing
Perfusion parametric maps were calculated off-line by using custom in-house reconstruction software. Contrast agent concentration was estimated from the MR signal intensity time course assuming a standard log relationship. After determining baseline and first-pass time limits from the total volume signal intensity change, a combination of early arrival time and peak height were used as criteria to automatically select a voxel for the AIF.2 A gamma variate curve was used to fit the baseline and first-pass tracer concentration curves to remove recirculation effects from the AIF. A delay-insensitive singular-value decomposition method3,4 was used to deconvolve the AIF from each voxel's time series. The peak height of the resulting tissue residue function estimate for each voxel was selected as the rCBF. rCBV was calculated as the integral of the tissue curve normalized by the integral of the AIF. MTT was calculated from rCBV and rCBF by using the central volume principle (MTT = rCBV/rCBF). The time-to-peak of the deconvolved tissue residue function was taken as Tmax,4,5 representing primarily tracer delay from the AIF voxel to the tissue voxel of interest.6 FMT was also calculated, with the lower limit of integration for all tissue voxels set to the arrival time determined for the AIF. Perfusion parameter maps were displayed in color for visual analysis and in gray-scale for quantitative (MTT, Tmax, FMT) and semiquantitative (rCBF, rCBV) analysis.
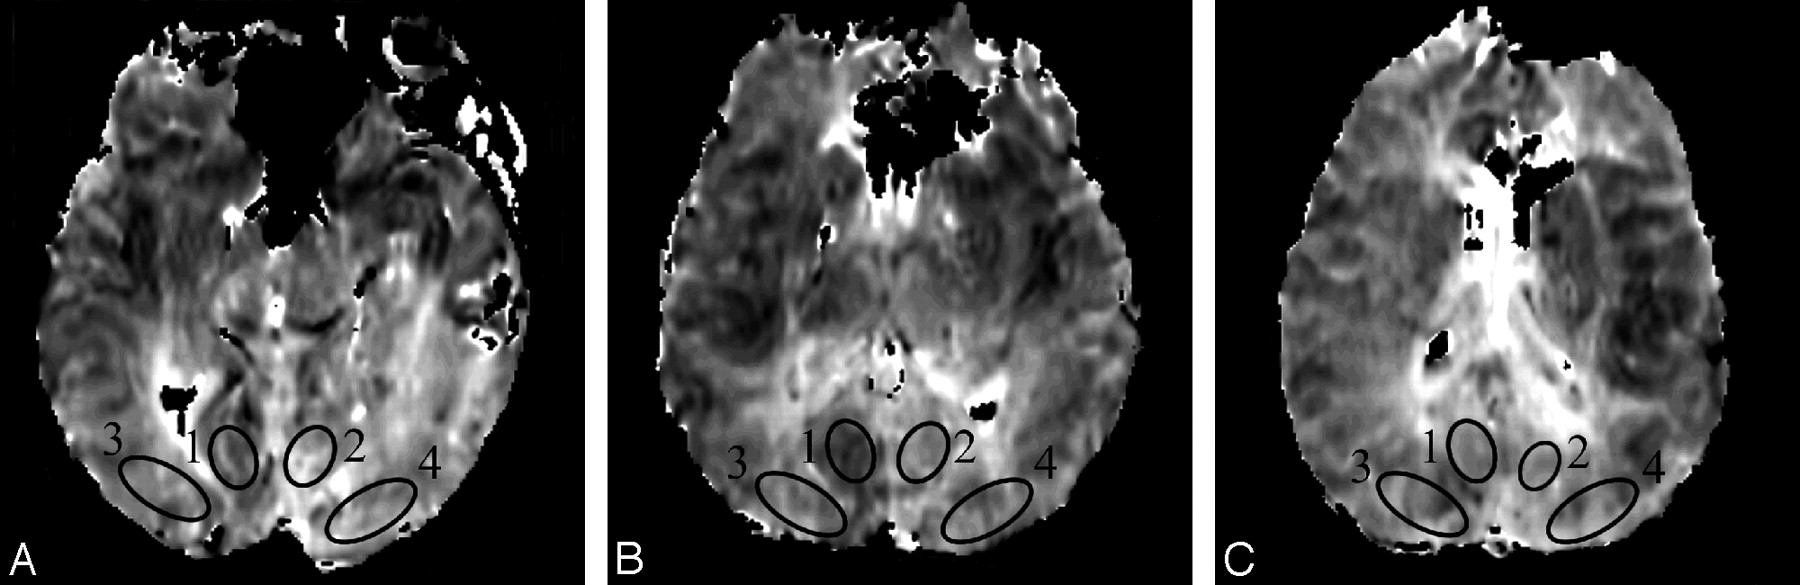
Hemodynamic parameters were recorded from symmetrical, elliptical ROIs placed to the left and right of midline in the occipital lobes of 3 consecutive sections by using an Advantage Windows workstation (AW 4.1; GE Healthcare). Because the extent of the posterior cerebral arterial territory is known to vary widely across individuals,7 separate ROIs were placed inferior and superior to the calcarine fissure according to the van der Zwan minimum and maximum PCA territories7 (Fig 1).

ROIs placed in the occipital lobes above the calcarine fissure on FMT maps of 3 consecutive sections (A–C). ROIs 1 and 2 are located in the “minimum” PCA territory and ROIs 3 and 4 are located in the “maximum” PCA territory according to van der Zwan et al.7
Asymmetry Indexes and Statistical Analysis
For each hemisphere, multisection ROI data were averaged after weighting by the volume of each individual section ROI. Mean ROI data for the putative PCA territories of left and right hemispheres were compared for each hemodynamic parameter by computing an AI as: AI = [2(L – R)]/(L + R), where L and R refer to PCA territories of the left and right hemispheres, respectively. Asymmetry indices were computed separately for the van der Zwan minimum and maximum PCA territories.
PCA vascular asymmetry was determined by a neuroradiologist, blinded to the perfusion data, viewing 3D TOF MRA source images. A score was assigned to each hemisphere according to the caliber of the P1 segment of the PCA relative to the PcomA, as follows: 1, PcomA not identified; 2, PcomA < P1; 3, PcomA = P1; 4, PcomA > P1; and 5, P1 not identified.1 The vAI was taken as the absolute left-right difference between these scores.
The AI of each hemodynamic parameter was tested for a relationship to vascular asymmetry by using the Spearman rank correlation, with P < .05 assumed to reflect a significant correlation. Spearman rank correlation coefficients were also computed for the mean absolute left-right difference of FMT, Tmax, and MTT and compared with the vascular asymmetry index. As a post hoc analysis, the hemisphere demonstrating the more fetal-type PCA on MRA was compared with the hemisphere demonstrating faster arterial transit (ie, smaller values of Tmax) on perfusion imaging.
Results
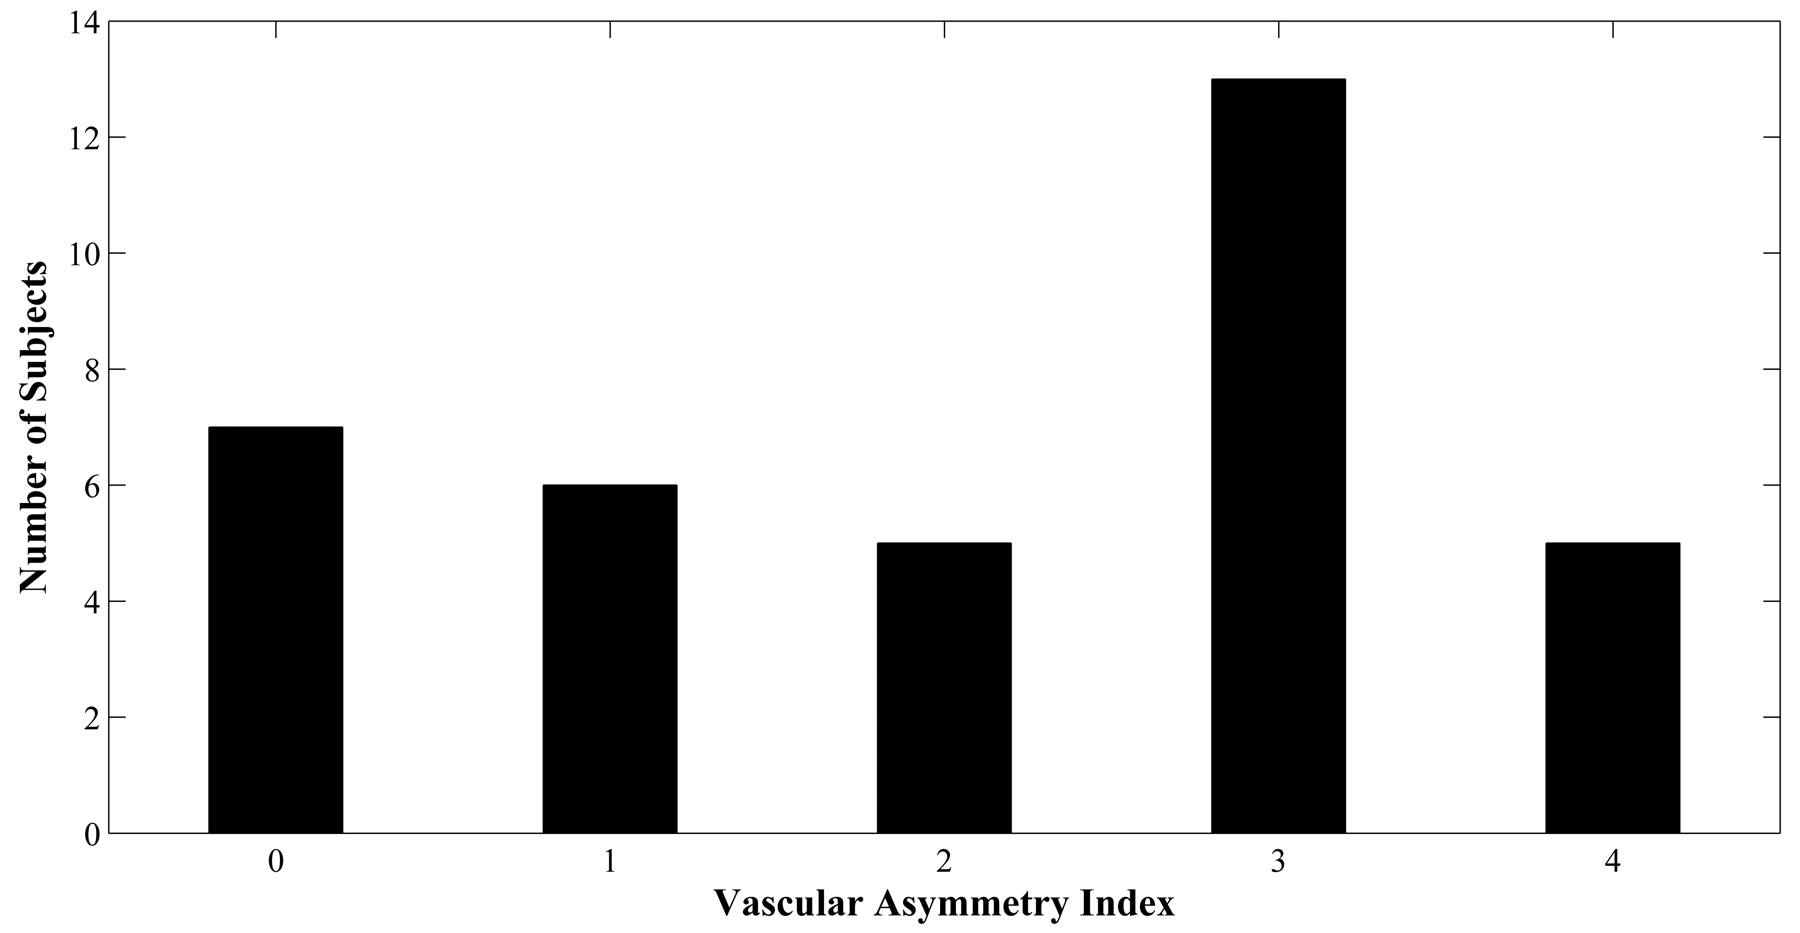
The distribution of vascular asymmetry (vAI) is shown in Fig 2: vAI = 0 in 7 patients, vAI = 1 in 6 patients, vAI = 2 in 5 patients, vAI = 3 in 13 patients, and vAI = 4 in 5 patients (Fig 2). In some patients, color maps of FMT and Tmax demonstrated marked asymmetry near the calcarine fissure in only the minimum territory of the PCA (Fig 3A, -B). Other patients demonstrated more extensive asymmetry throughout the maximum territory of the PCA (Fig 3C, -D).

Distribution of vascular asymmetry indices for 36 subjects.

Color maps of FMT (A) and Tmax (B) in a patient with asymmetry in the minimum PCA territory are shown, as are color maps of FMT (C) and Tmax (D) in a subject with asymmetry in the maximum PCA territory. Arrows indicate areas of asymmetrically faster transit. Tmax maps are displayed at increments of TR, beginning at Tmax = 1.5 seconds (violet) and superimposed on the corresponding precontrast source images.
Scatterplots demonstrated increasing minimum-territory perfusion AIs for FMT and Tmax as vascular asymmetry increased (Fig 4A, -C), with Spearman rho = 0.76 and 0.74, respectively (P < 1 × 10⁻⁶). Maximum-territory FMT and Tmax AIs remained significantly correlated with vascular asymmetry, with rho = 0.41 and 0.58, respectively (P = .013 and <1 × 10⁻³, respectively). Combining the measurements from ROIs in both the minimum and maximum territories yielded significant correlations for FMT and Tmax AIs (Spearman rho = 0.47 and 0.61, respectively; P = .004 and <1 × 10⁻⁴, respectively). No significant perfusion asymmetry or correlation with vascular asymmetry was observed for rCBF, MTT, and rCBV asymmetry indices (Fig 4B, -D, -E), even in the minimum PCA territory (Spearman rho = −0.09, 0.24, and 0.004, respectively; P = .59, .15, and .98, respectively).

Scatterplots of vAI versus minimum-circulation AIs from hemodynamic parameters FMT (A), rCBF (B), Tmax (C), MTT (D), and rCBV (E) for 36 subjects. Group means are shown in gray. Spearman rank correlation coefficient (rho) and corresponding P values are shown in each plot.
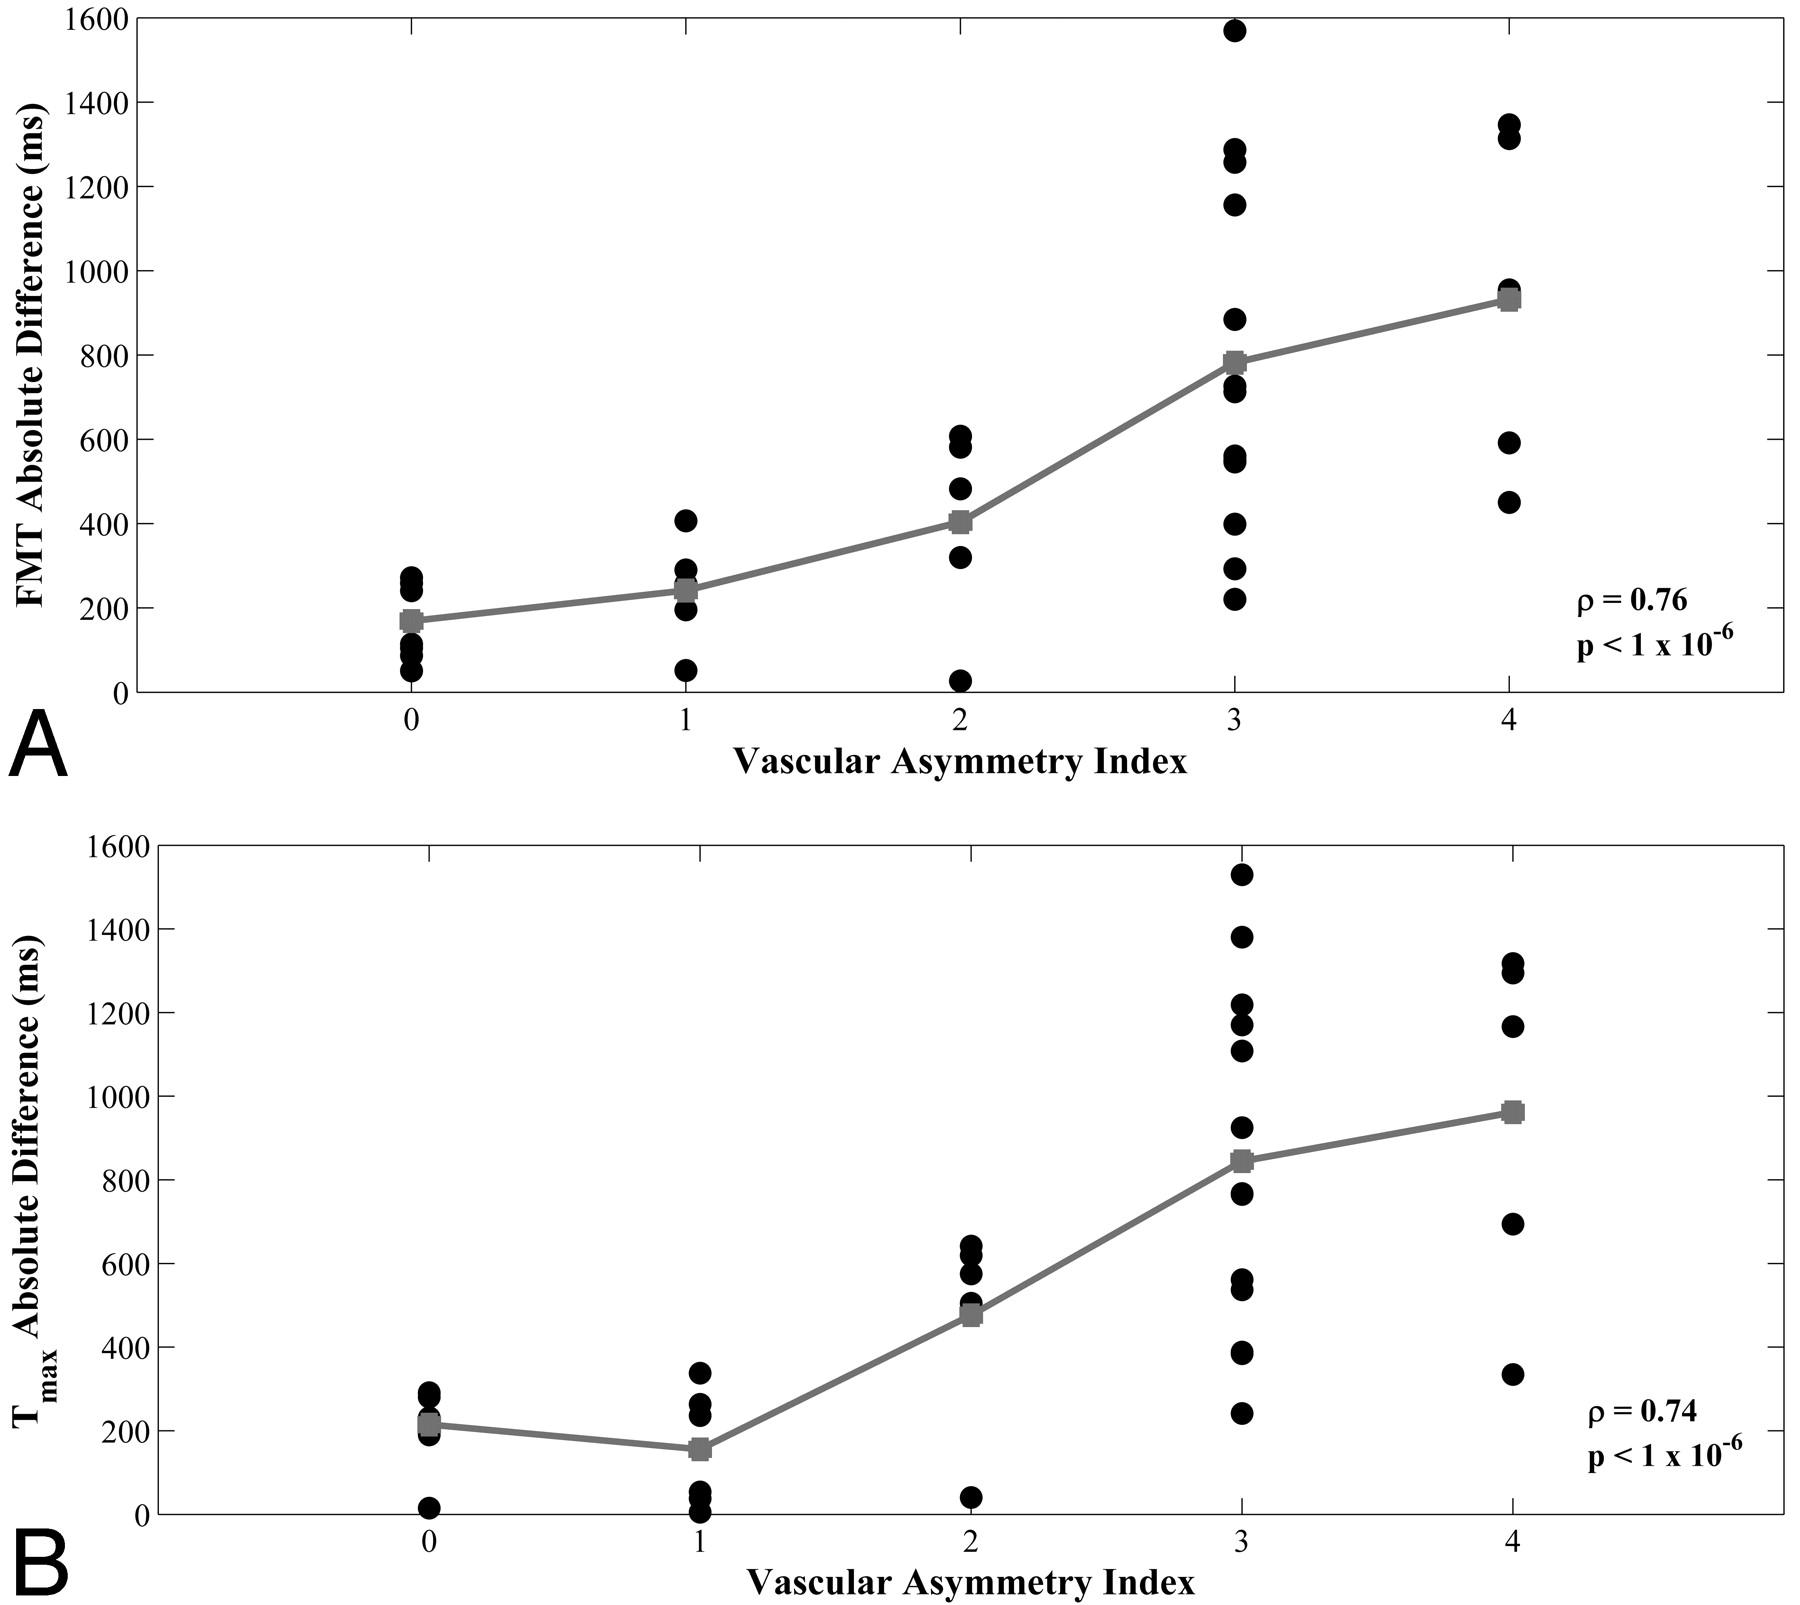
The Table summarizes Spearman rho values and P values of the correlations between vAI and the AIs of all 5 perfusion parameters for ROIs placed in the minimum PCA territories, maximum PCA territories, and the combined values of both the minimum and maximum PCA territories. P values were not Bonferroni-corrected, as this would be overly conservative given the mutual interdependence of the perfusion parameters. However, even with Bonferroni correction, all of the significant correlations remain significant except for the FMT measurements in the maximum territory. Additionally, a comparison of the mean absolute left-right difference of perfusion parameters with vAI demonstrated significant correlation for measurements of FMT and Tmax (Spearman rho = 0.76 and 0.74, respectively; P < 1 × 10⁻⁶; Fig 5). A similar comparison was not significant for measurements of MTT (Spearman rho = 0.23; P = .18). The mean absolute left-right differences of FMT and Tmax of those subjects with highly asymmetric vasculature (vAIs of either 3 or 4) were 824 milliseconds and 877 milliseconds, respectively. Of the 29 subjects with nonzero vAIs, 26 (90%) showed concordance between the hemisphere with the greater degree of fetal PCA origin and the hemisphere with faster arterial transit (lower Tmax). Extenuating circumstances surrounding the 3 discordant subjects are described below.
Spearman rank correlation coefficients (rho) and corresponding P values of vAI versus asymmetry indices from hemodynamic parameters FMT, rCBF, Tmax, MTT, and rCBV for 36 subjects.

Scatterplots of vAI versus minimum-circulation absolute differences from hemodynamic parameters FMT (A) and Tmax (B) for 36 subjects. Group means are shown in gray. Spearman rank correlation coefficient (rho) and corresponding P values are shown in each plot.
Discussion
Perfusion imaging can be used to show blood delivery patterns in brain tissue related to vascular pathology, such as stroke8 and stenosis,9 and to show changes in perfusion subsequent to endarterectomy.10 Vascular imaging with MRA11 or CT12 angiography coupled with perfusion imaging provides complementary information that is used to diagnose and make treatment decisions in acute stroke.13–16 As the use of perfusion imaging becomes more commonplace for the triage and management of acute stroke, a close examination of normal anatomic and physiologic variation is needed to avoid clinical pitfalls.
Anatomic variation of the circle of Willis is common. The hemodynamic effects of anteroposterior transit time discrepancies coupled with anatomic variation of the circle of Willis have not been studied. In part this may be due to traditional use of positron-emission tomography and single-photon emission CT, which measure CBF without sensitivity to the macrovascular dynamics of blood delivery. Close attention to macrovascular dynamics is now demanded by the increasing clinical use of contrast bolus tracking by MR or CT for perfusion imaging, because these methods are inherently sensitive to arterial transit delays unless (and perhaps even if) such technically demanding and time-consuming procedures as arterial input function estimation and deconvolution are employed.
This study shows that perfusion transit times in the PCA territories typically decrease with increasing contribution of the anterior circulation (via the PcomAs) relative to the contribution of the posterior circulation (via the P1 segments of the PCAs). This result is consistent with the bulk flow velocity data of Schöning et al,17 who found that time-averaged velocities and flow volumes are greater in the internal carotid arteries (24.9 ± 5.2 cm/s and 265 ± 62 mL/min, respectively) than in the vertebral arteries (15.6 ± 3.6 cm/s and 85 ± 33 mL/s, respectively).
Variability in transit time is demonstrated by those perfusion parameters sensitive to macrovascular delay in this study, FMT and Tmax. FMT is derived directly from the tissue response curve without regard to the AIF, except that the lower limit of integration is determined globally as the calculated AIF arrival time; any dispersion as well as delay of the bolus before it arrives at a given voxel will affect FMT. Therefore, in addition to microvascular effects, FMT is sensitive to macrovascular transit effects of altered arterial topography. Presumably, other transit-sensitive parameters derived directly from the tissue response curve, such as “time-to-peak” or “bolus arrival time”, would manifest a similar pattern of asymmetry. Tmax primarily reflects the delay of the contrast agent between the actual site of AIF measurement and the voxel.4,5 Although Tmax derives from the deconvolution of the tissue response with the AIF, Tmax reflects the inability to measure a “true” AIF for each tissue voxel, which theoretically would be unique to that voxel. Because AIF deconvolution in practice eliminates some, but not all, of the delay and dispersion effects that a contrast bolus shows, Tmax should still show sensitivity to arterial transit effects, which it did.
As one would expect, minimum-territory FMT and Tmax asymmetry indices demonstrated strong correlations with vascular asymmetry (Spearman rho = 0.76 and 0.74, respectively; P < 1 × 10⁻⁶; Fig 4A, -C). Maximum-territory perfusion AIs demonstrated weaker correlation to vascular asymmetry presumably because a subset of patients had a less extensive distribution of the PCA vasculature, also as would be expected.7 The “classic” perfusion parameters rCBV, rCBF, and MTT primarily reflect microvascular phenomena; variant arterial anatomy, therefore, would not be expected to significantly alter these parameters, as we also observed.
By estimating the relative contributions from the anterior and posterior circulation to PCA territory via a vAI, we were able to elucidate the effects of a common vascular variant on perfusion parameters. It is incumbent upon the radiologist interpreting clinical perfusion imaging to be aware of these effects to avoid mistaking normal variation for pathology. Left-right asymmetry represents an important visual cue to the radiologist seeking pathology in brain images, particularly when viewing low-spatial resolution, semiquantitative parametric maps. Regardless of the presenting side of symptoms, a radiologist may attribute to the PCA territory contralateral to the fetal PCA a pathologic transit delay (Fig 6). In a “normal” subject, the territory of the PCA demonstrates mild bilateral prolongation of FMT and Tmax relative to the anterior circulation. The abnormalities documented in this study essentially represent the unilateral absence of this normal finding. That perfusion maps may be substantially asymmetric as a normal variant is an important conclusion of this study and represents critical information for radiologists.

FMT maps comparing a unilateral fetal PCA in the left hemisphere (A) with a stroke in the territory of the PCA (B).
Limitations of the study include the relatively small number of subjects, who were selected because they had at least partially fetal origin of at least one of their PCAs, creating the potential for selection bias. However, given the fact that fetal-type PCA origin is not “all or nothing” but rather exists on a continuum (captured with a 5-point rating scale) for each hemisphere, we think that there was sufficient variation in our study group to support a significant relationship between vascular and perfusion asymmetry without a more random selection of subjects or a separate control group. The AIF was determined automatically, and its location, therefore, varied across patients; however, note that correlation between vascular and perfusion asymmetries was significant not only for Tmax (which is dependent on the AIF) but also for FMT (which is independent of the AIF). Furthermore, subjects were identified as having either minimum or maximum PCA territories7 without regard to possible intermediary territories. Concomitant use of new techniques that employ vessel-encoded arterial spin-labeling may elucidate the actual PCA territories for each individual subject in future studies.18
Regarding the 3 out of 29 (10%) subjects who showed discordance between the hemisphere with the greater degree of fetal PCA origin and the hemisphere with faster arterial transit (lower Tmax), 2 of these discordant subjects had only minimal vascular asymmetry (vAI = 1) and had right-left mean Tmax difference less than 54 milliseconds, placing them well within the margin of error on these measurements, because Tmax is quantized on a pixel-by-pixel basis in units of TR (1.5 or 2.0 seconds). The other discordant subject, upon review, was found to be obliquely positioned in the scanner such that the infracalcarine section was affected by partial volume averaging with the cerebellum; after deleting the corrupted ROI and recalculating the Tmax and FMT means, this subject became concordant.
Finally, the perfusion analysis software was not a commercially available package, potentially raising concerns over whether our results are generalizable. We think that they are, as commercial perfusion packages are generally based on the same models as our own software, and we largely limited our analysis to asymmetry indices, which are inherently normalized and therefore insensitive to the technical variations that could affect absolute quantitation. The use of asymmetry indices also allowed each subject to serve as his or her own control, mitigating any concern that this study employed just one of many perfusion techniques described in the literature.
Conclusions
Unilateral fetal-type PCA produces substantial left-right asymmetry on perfusion imaging when parameters sensitive to macrovascular transit effects are mapped. Knowledge of this normal variation is critical for the radiologist performing perfusion imaging, as such asymmetry may mimic cerebrovascular pathology.
Footnotes
This work was supported by National Institutes of Health/National Institute of Biomedical Imaging and Bioengineering Grant 5 R01 EB007021-04 to H.A.R.
Indicates open access to non-subscribers at www.ajnr.org
References
- Received April 27, 2009.
- Accepted after revision July 31, 2009.
- Copyright © American Society of Neuroradiology


