
Abstract
BACKGROUND AND PURPOSE: The association between L5 hypoplasia and bilateral spondylolysis was described earlier on conventional radiographs of the lumbar spine. The purpose of this study was to describe the findings on MR imaging in patients with hypoplasia of L5 and to correlate these findings with the presence of bilateral spondylolysis of L5.
MATERIAL AND METHODS: We studied the MR images of 22 patients with hypoplasia and posterior wedging of L5 and with bilateral spondylolysis at L5. The anteroposterior diameter of L4, L5, and S1 were measured and compared. The degree of posterior wedging of L5 was calculated. The degree of anterolisthesis was determined. The intervertebral disks of L4-L5 and L5-S1 were studied.
RESULTS: The mean difference between the anteroposterior diameter of L4 and L5 was 3.0 mm, or 8.8% shortening of L5 compared with L4. The mean difference between the anteroposterior diameter of L5 and S1 was 4.4 mm, or 12.3% shortening of L5 compared with S1. The mean percentage posterior wedging was 24.7%. In 13 patients, there was no anterior vertebral slipping. True anterolisthesis grade I was seen in 5 patients and anterolisthesis grade II in 4 patients. Diskarthrosis with disk dehydration of L4-L5 was seen in 20 of the 22 patients.
CONCLUSIONS: It is confirmed that hypoplasia of L5 can simulate anterolisthesis. Hypoplasia of the vertebral body of L5 can predict the presence of bilateral spondylolysis.
In 1979, Frank and Miller1 introduced the term pseudospondylolisthesis to designate the false impression of spondylolisthesis caused by the shortening of the anteroposterior diameter of L5. Moreover, they noted that hypoplasia of L5 with shortening of its sagittal diameter and posterior wedging on conventional radiographs of the lumbar spine was a reliable sign indicating the presence of bilateral spondylolysis. We recently noted L5 hypoplasia on an MR imaging study of a patient with bilateral spondylolysis. On the basis of this observation and considering the difficulty of the diagnosis of bilateral spondylolysis on MR imaging, we performed a retrospective study to evaluate the characteristics of this anomaly on MR imaging of the lumbar spine in 22 patients.
Materials and Methods
We retrospectively reviewed the MR images of exactly 2223 patients who were referred to our department for an MR imaging study of the lumbar spine for degenerative disease, presenting with low back pain, lumbo-ischialgia, or suspicion of spinal stenosis during a 15-month period. Screening for inflammatory or malignant diseases such as metastasis or lymphoproliferative diseases were excluded, as well as posttraumatic indications because all of these diseases can affect the size of the lumbar vertebrae.
We examined the images more specifically for the presence or absence of spondylolysis at L5 and for the presence or absence of hypoplasia of the vertebral body at L5.
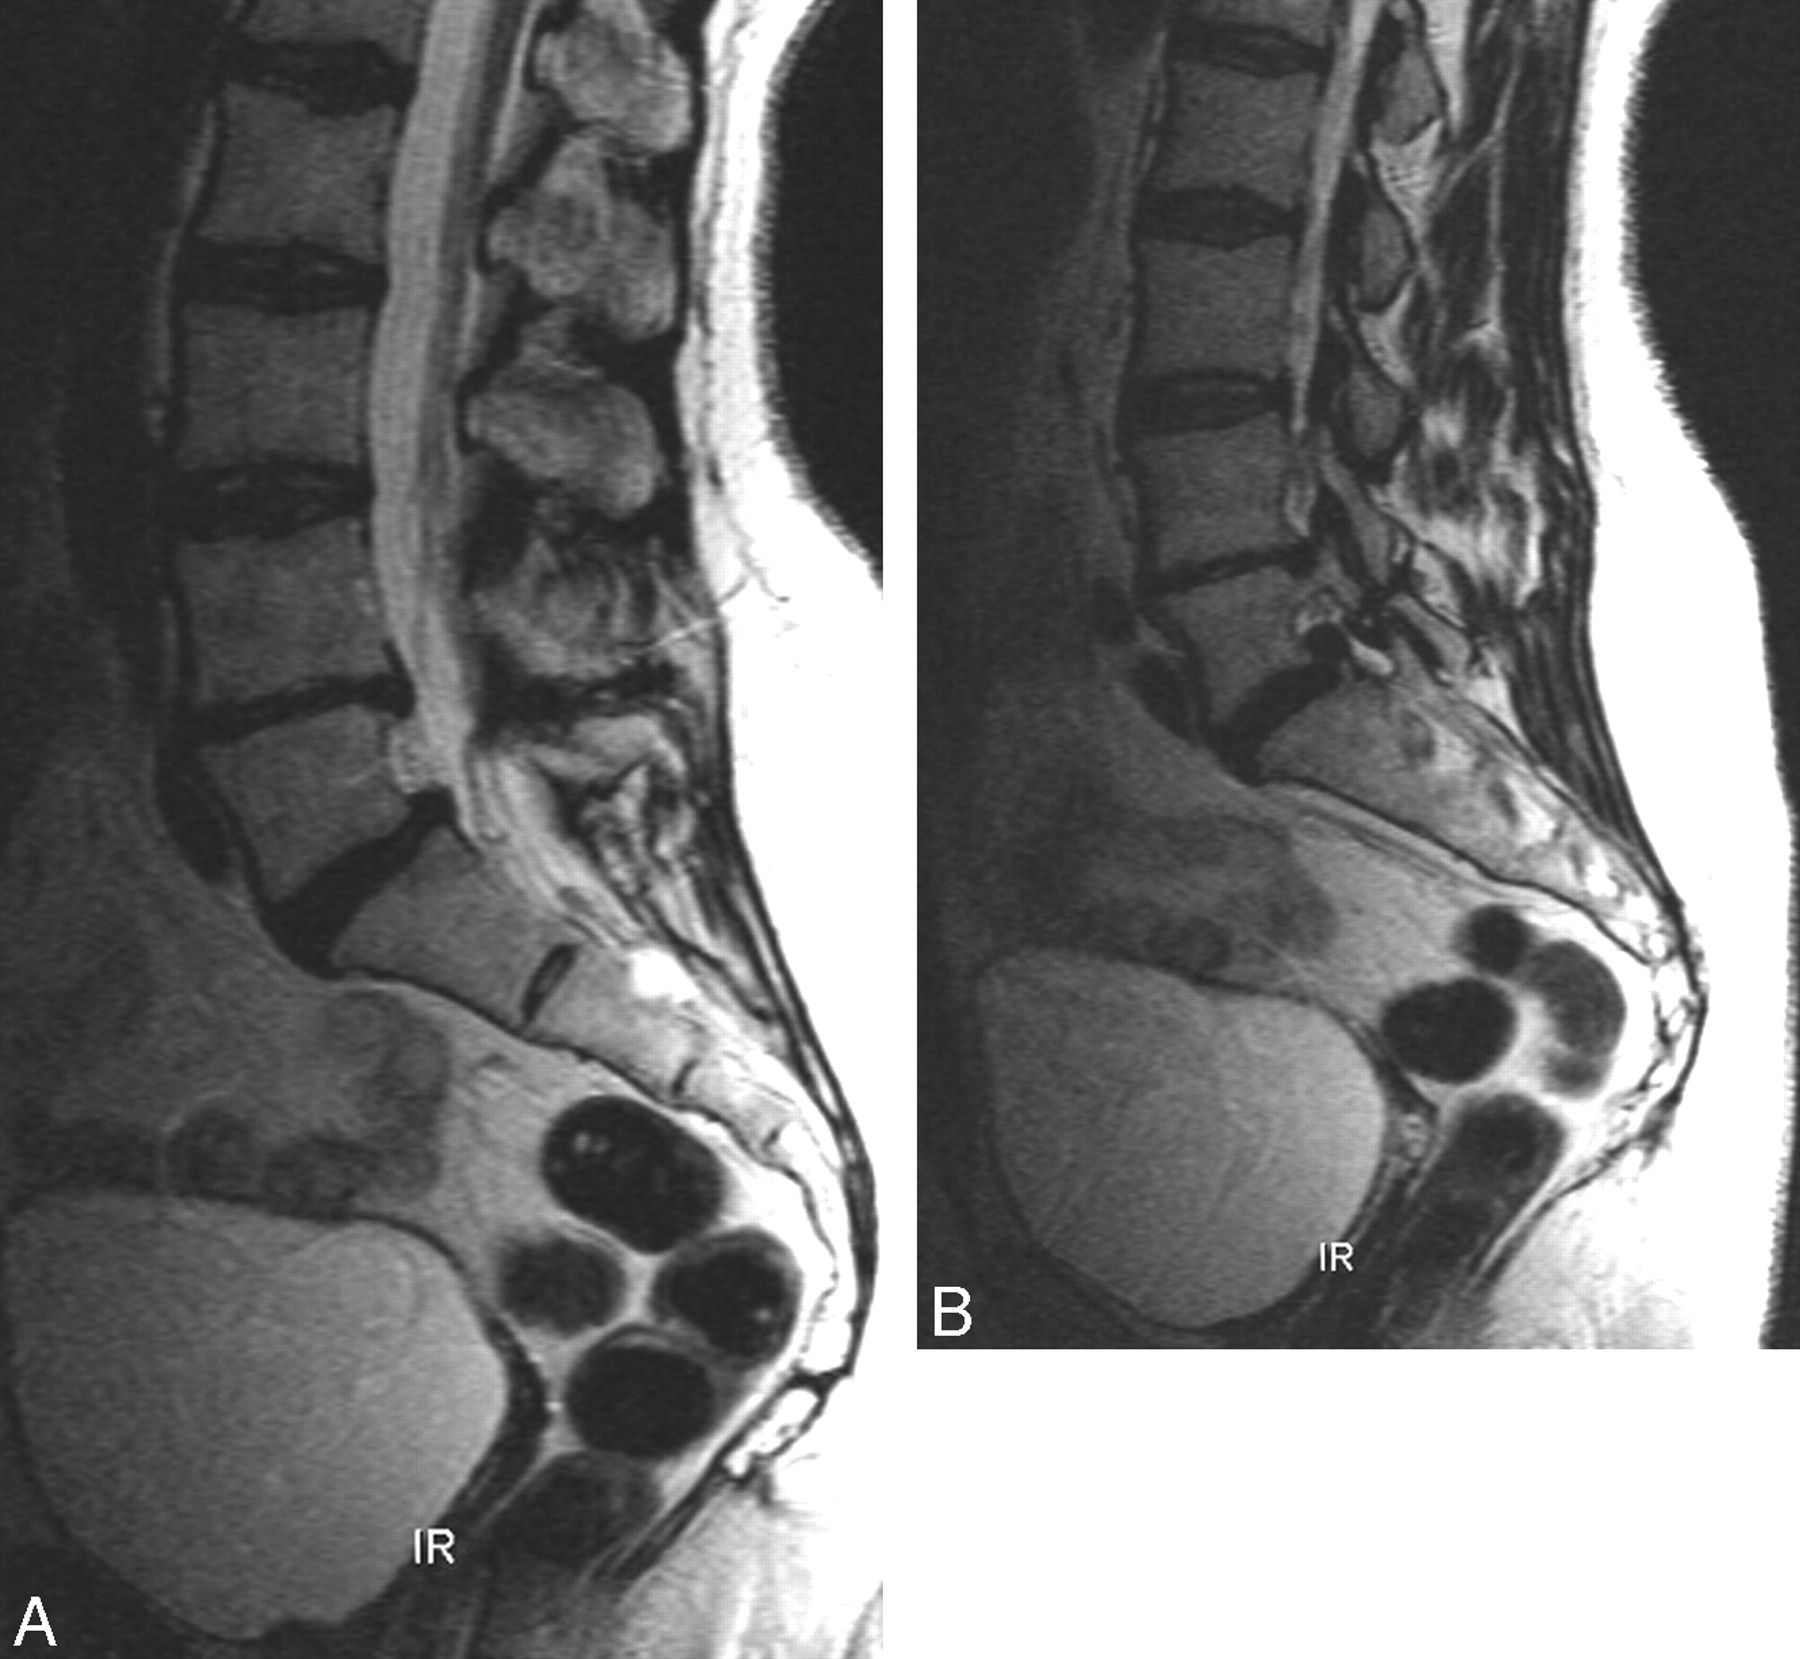
In the patients with hypoplasia of L5, the anteroposterior diameter of L4 and L5 was measured at the midsagittal and midvertebral level at the site of the central vertebral vein as well as the anteroposterior diameter of S1 at the level of the sacral endplate (Fig 1A, -B). The difference between the anteroposterior diameter of L4 and L5 and L5 and S1 was calculated.

Hypoplasia at L5, method of measurement. A, Midsagittal T2-weighted spin-echo image. Notice the reduced anteroposterior diameter of L5 with posterior wedging. The intervertebral disks at L4-L5 and L5-S1 are of normal size and reach the posterior longitudinal ligament. The retrovertebral space is filled with epidural fat. There is no anterior vertebral slippage. The intervertebral disks at L4-L5 and L5-S1 are dehydrated. B, Measurement of shortening of L5 on the same image. Anteroposterior diameter of L4 is 35.0; L5, 33.3; and S1, 40.1. Shortening of L5 compared with L4 is 1.7 mm, or 4.8% shortening. Shortening of L5 compared with S1 is 6.8 mm, or 16.9% shortening. C, Measurement of percentage wedging on the same image: Anterior height of L5 is 32.3 mm. Posterior height of L5 is 25.7 mm. Percentage wedging is 32.3–25.7/32.3 = 20.4%.
The height of the vertebral body at L5 was measured anteriorly and posteriorly (Fig 1C), and the percentage wedging was calculated for all hypoplastic L5 vertebrae with the simple formula: anterior height minus posterior height, divided by anterior height, as used by Frank and Miller.1
The presence or absence of anterior vertebral slipping was assessed. The degree of dehydration and degeneration of the lumbar disks at L4-L5 and L5-S1 were evaluated. The size of the pedicles and facets of L5 were compared with the size of the pedicles and facets of L4.
We performed all measurements on a PACS-system (Impax-Client; Agfa-Gevaert, Mortsel, Belgium) by using an electronic caliper. All measurements and observations were performed independently by 4 observers, and the presented figures and data are the mean of these results. We performed measurements on the sagittal T2-weighted images by using the cortical hypointensity as the anatomic landmark. To validate this method, we made the same measurements in 23 consecutive patients without spondylolysis with the same age range as those with L5 hypoplasia, who underwent MR imaging for lumbo-ischialgia.
The MR imaging studies were performed on 1T (Magnetom Expert; Siemens, Forchheim, Germany) and 1.5T (Magnetom Symphony; Siemens) units. On a routine basis, we obtained sagittal T1- and T2-weighted images and transverse T2-weighted images through the 3 lower lumbar levels. Typical imaging parameters for a T1-weighted sequence are TR, 500–600 ms; TE, 10–15 ms; and section thickness, 3 mm. Typical parameters for a T2-weighted sequence are TR, 5000 ms; TE, 128 ms; and section thickness, 3 mm.
In 16 patients, conventional radiographs of the lumbar spine were available for correlation; in 12 patients, spiral CT scans were available; and in 10 patients, both examinations were available.
Statistical Analysis
For assessment of the interobserver variability, an intraclass correlation coefficient was calculated among the 4 observers with use of the SPSS 13.0 for Windows software package (SPSS, Chicago, Ill). This was done in both the control group and in the group of patients with hypoplasia at L5, to assess whether there was an effect of the pathologic process on the variability of the measurements. We compared the different measured parameters between the patients with L5 hypoplasia and the control subjects by using an unpaired 2-tailed Student t test. P values of less than .05 were considered statistically significant.
Results
Review of the images in this patient group revealed 48 (2.16%) of the 2223 patients with bilateral spondylolysis at L5. Hypoplasia and posterior wedging of the fifth lumbar vertebra were seen in 22 patients (Figs 1–5), all presenting with bilateral spondylolysis at L5, accounting for 45.8% of all patients with bilateral spondylolysis at L5. Of these 22 patients, there were 14 men and 8 women with a mean age of 39.75 years (age range, 23–55 years). The clinical indication for MR imaging of the 22 patients was acute lumbo-ischialgia in 6 patients; chronic complaints in 10; and routine follow-up of spondylolysis in 6 patients, 2 after surgical fixation. In the control group, the mean age was 39.9 years (age range, 20–57 years).
In the 22 patients with hypoplasia at L5 and in the 23 patients in the control group, the mean anteroposterior diameter of L4, L5, and S1, the mean difference in anteroposterior diameter between L4 and L5 and L5 and S1, and the percentage wedging of L5 were measured.
Mean Anteroposterior Diameter of L4, L5, and S1
The results of the measurements of the anteroposterior diameter of L4, L5, and S1 in the 2 groups are summarized in Table 1. In the group of patients with hypoplasia at L5, the mean anteroposterior diameter of L4 was 34.1 mm (range, 27.5–45.4 mm); L5, 31.1 mm (range, 21.8–39.0 mm); and S1, 35.5 mm (range, 26.4–44.2 mm). In the control group, the mean anteroposterior diameter of L4 was 33.1 mm (range, 26.1–38.6 mm); L5, 33.0 mm (range, 25.8–37.9 mm); and S1, 33.9 mm (range, 27.4–42.1 mm).
Anteroposterior diameter (mm)
Mean Difference in Anteroposterior Diameter
The results of the measurements of the difference in anteroposterior diameter between L4 and L5 and S1 and L5 in the 2 groups are summarized in Table 2. In the group of patients with hypoplasia at L5, the mean difference between the anteroposterior diameter of L4 and L5 was 3.0 mm (range, 2.2–4.1 mm) or 8.8% shortening of L5 compared with L4. The mean difference between the anteroposterior diameter of L5 and S1 was 4.4 mm (range, 4.2–4.7 mm), or 12.3% shortening of L5 compared with S1. In 1 patient, the anteroposterior diameter of L5 and S1 was equal. In 5 patients, the anteroposterior diameter of S1 was smaller than that of L5 with a maximal difference of 1.9 mm.
Difference in anteroposterior diameter (mm)
In the control group, the difference between the anteroposterior diameter of L4 and L5 was 0.2 mm (range, 0.1–0.3 mm). The mean difference between the anteroposterior diameter of L5 and S1 was 1.0 mm (range, 0.9–1.0 mm). In 14 patients, the anteroposterior diameter of L5 was smaller than that of L4. This difference was inferior to 0.5 mm in 11 of these patients and with a maximal difference in the 3 remaining patients of 1.4. In 2 patients, the anteroposterior diameter of L5 was equal to that of S1. In only 4 patients, the anteroposterior diameter of S1 was smaller than that of L5, with a maximal difference of 1.9 mm, respectively.
Percentage Wedging
The results of the measurements of the percentage wedging of L5 in the 2 groups are summarized in Table 3. In the group of patients with hypoplasia at L5, the mean anterior height of the vertebral body at L5 was 28.8 mm (range, 23.5–34.1 mm); the mean posterior height of the vertebral body at L5 was 21.7 mm (range, 17.4–26.2 mm); and the mean percentage posterior wedging was 24.7% (range, 14.3–36.2%). In only 2 patients, the percentage of wedging was inferior to 20% with a minimum of 18.3%.
Mean percentage wedging
In the control group, the mean percentage posterior wedging was 14.5% (range, −1.1–28.8%). In only 5 patients, the degree of wedging was higher than 20%. This was less than 22% in 4 patients and with a maximal percentage wedging of 28.8% in the remaining patient.
Additional Findings in Patients with Hypoplasia at L5
In 13 patients, there was no anterior vertebral slipping (Figs 1 and 2). True anterolisthesis grade I was seen in 5 patients (Figs 3 and 4) and anterolisthesis grade II in 4 patients (Fig 5).

Hypoplasia of vertebral body and facet joint L5. A, Midsagittal T2-weighted spin-echo image. Reduced anteroposterior diameter of L5 with posterior wedging. There is no anterior vertebral slippage. The intervertebral disks at L4-L5 and L5-S1 are dehydrated. B, Lateral T2-weighted spin-echo image. Notice isthmolysis at L5. The facet joint at L5 is clearly hypoplastic.

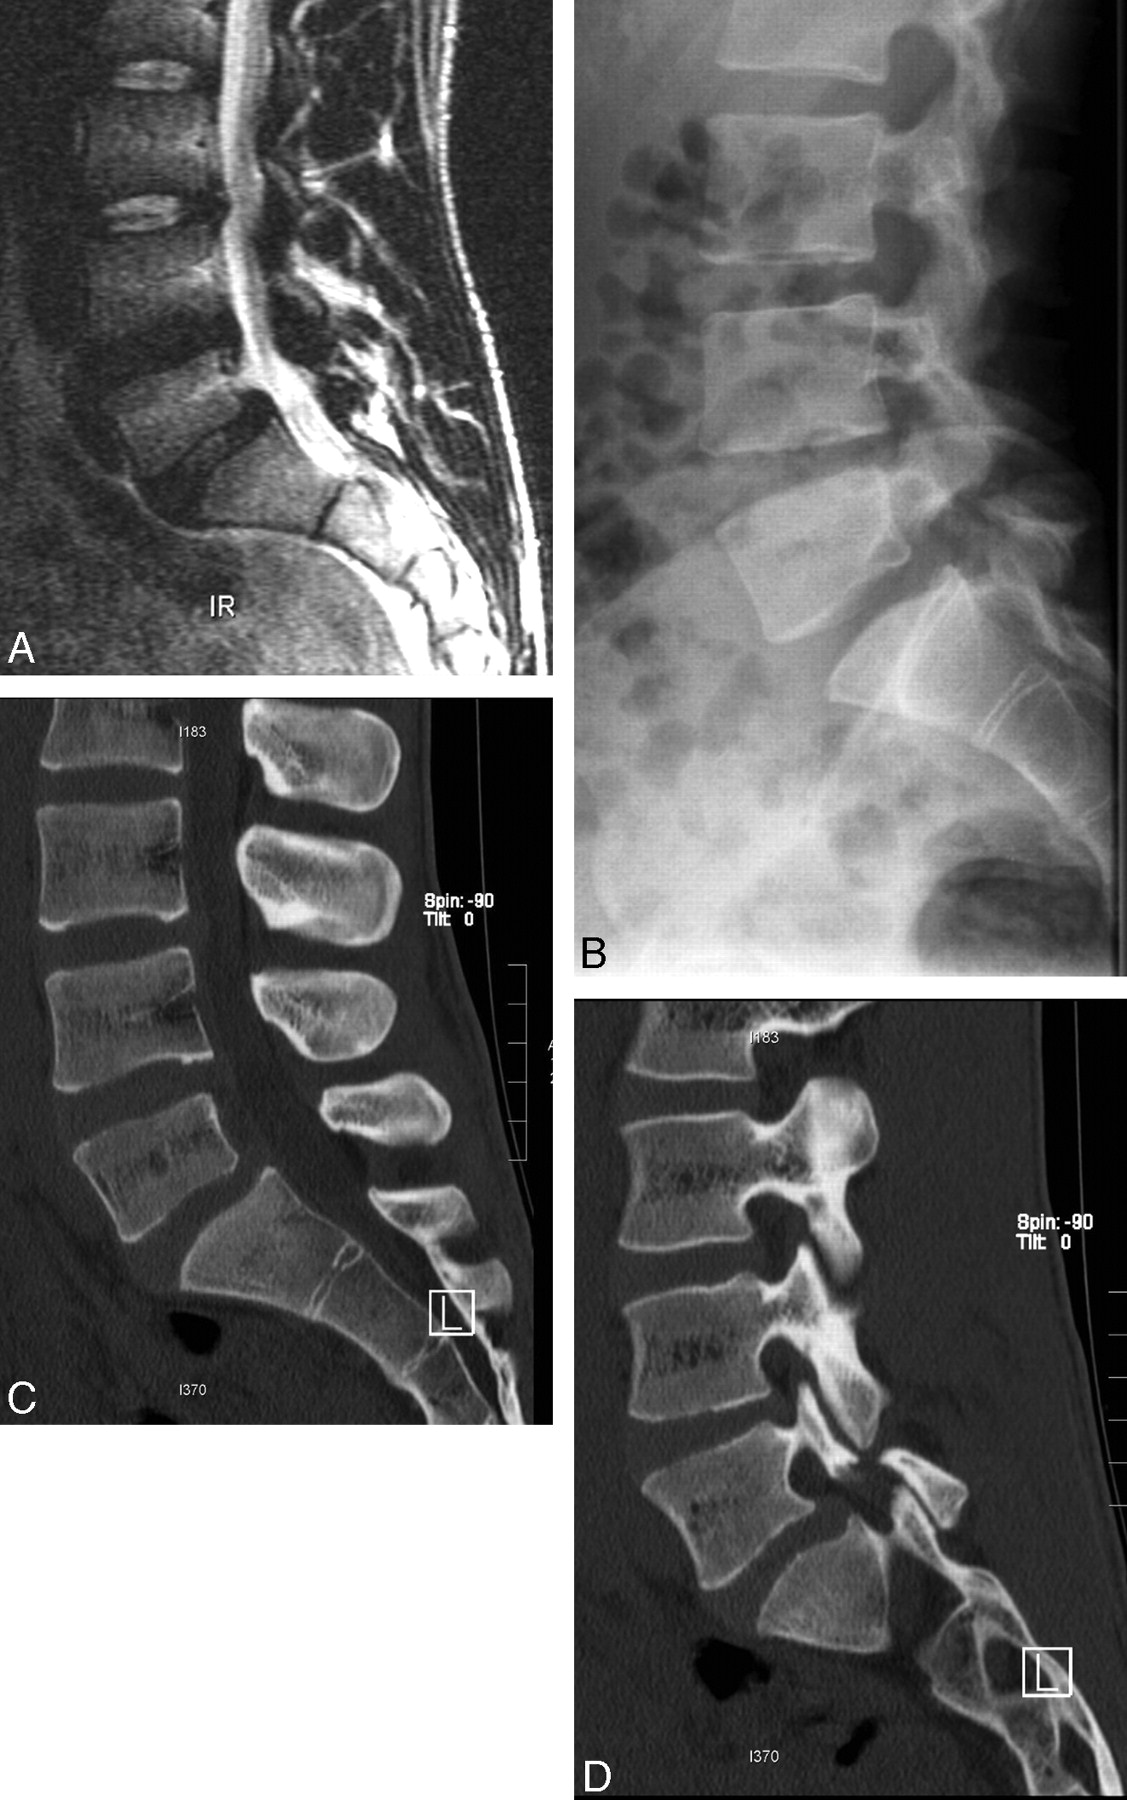
Hypoplasia of vertebral body and facet joint at L5. Correlation with conventional radiographs and CT scan. A, Midsagittal T2-weighted spin-echo image. Reduced anteroposterior diameter of L5 with posterior wedging. Minimal anterolisthesis L5 on S1. The intervertebral disk at L4-L5 is dehydrated. The intervertebral disk at L5-S1 is normal. B, Conventional radiographs. Confirmation of the L5 hypoplasia and the isthmolysis. C, Spiral CT scan, midsagittal reconstruction. Confirmation of the L5 hypoplasia. D, Spiral CT scan, lateral reconstruction. Notice isthmolysis at L5. The facet joint at L5 is clearly hypoplastic.

Hypoplasia at L5 with anterolisthesis at L5 on S1, grade I. Vertebral body at L5 is hypoplastic. There is a grade I anterior vertebral slippage. The intervertebral disks at L4-L5 and L5-S1 are dehydrated.

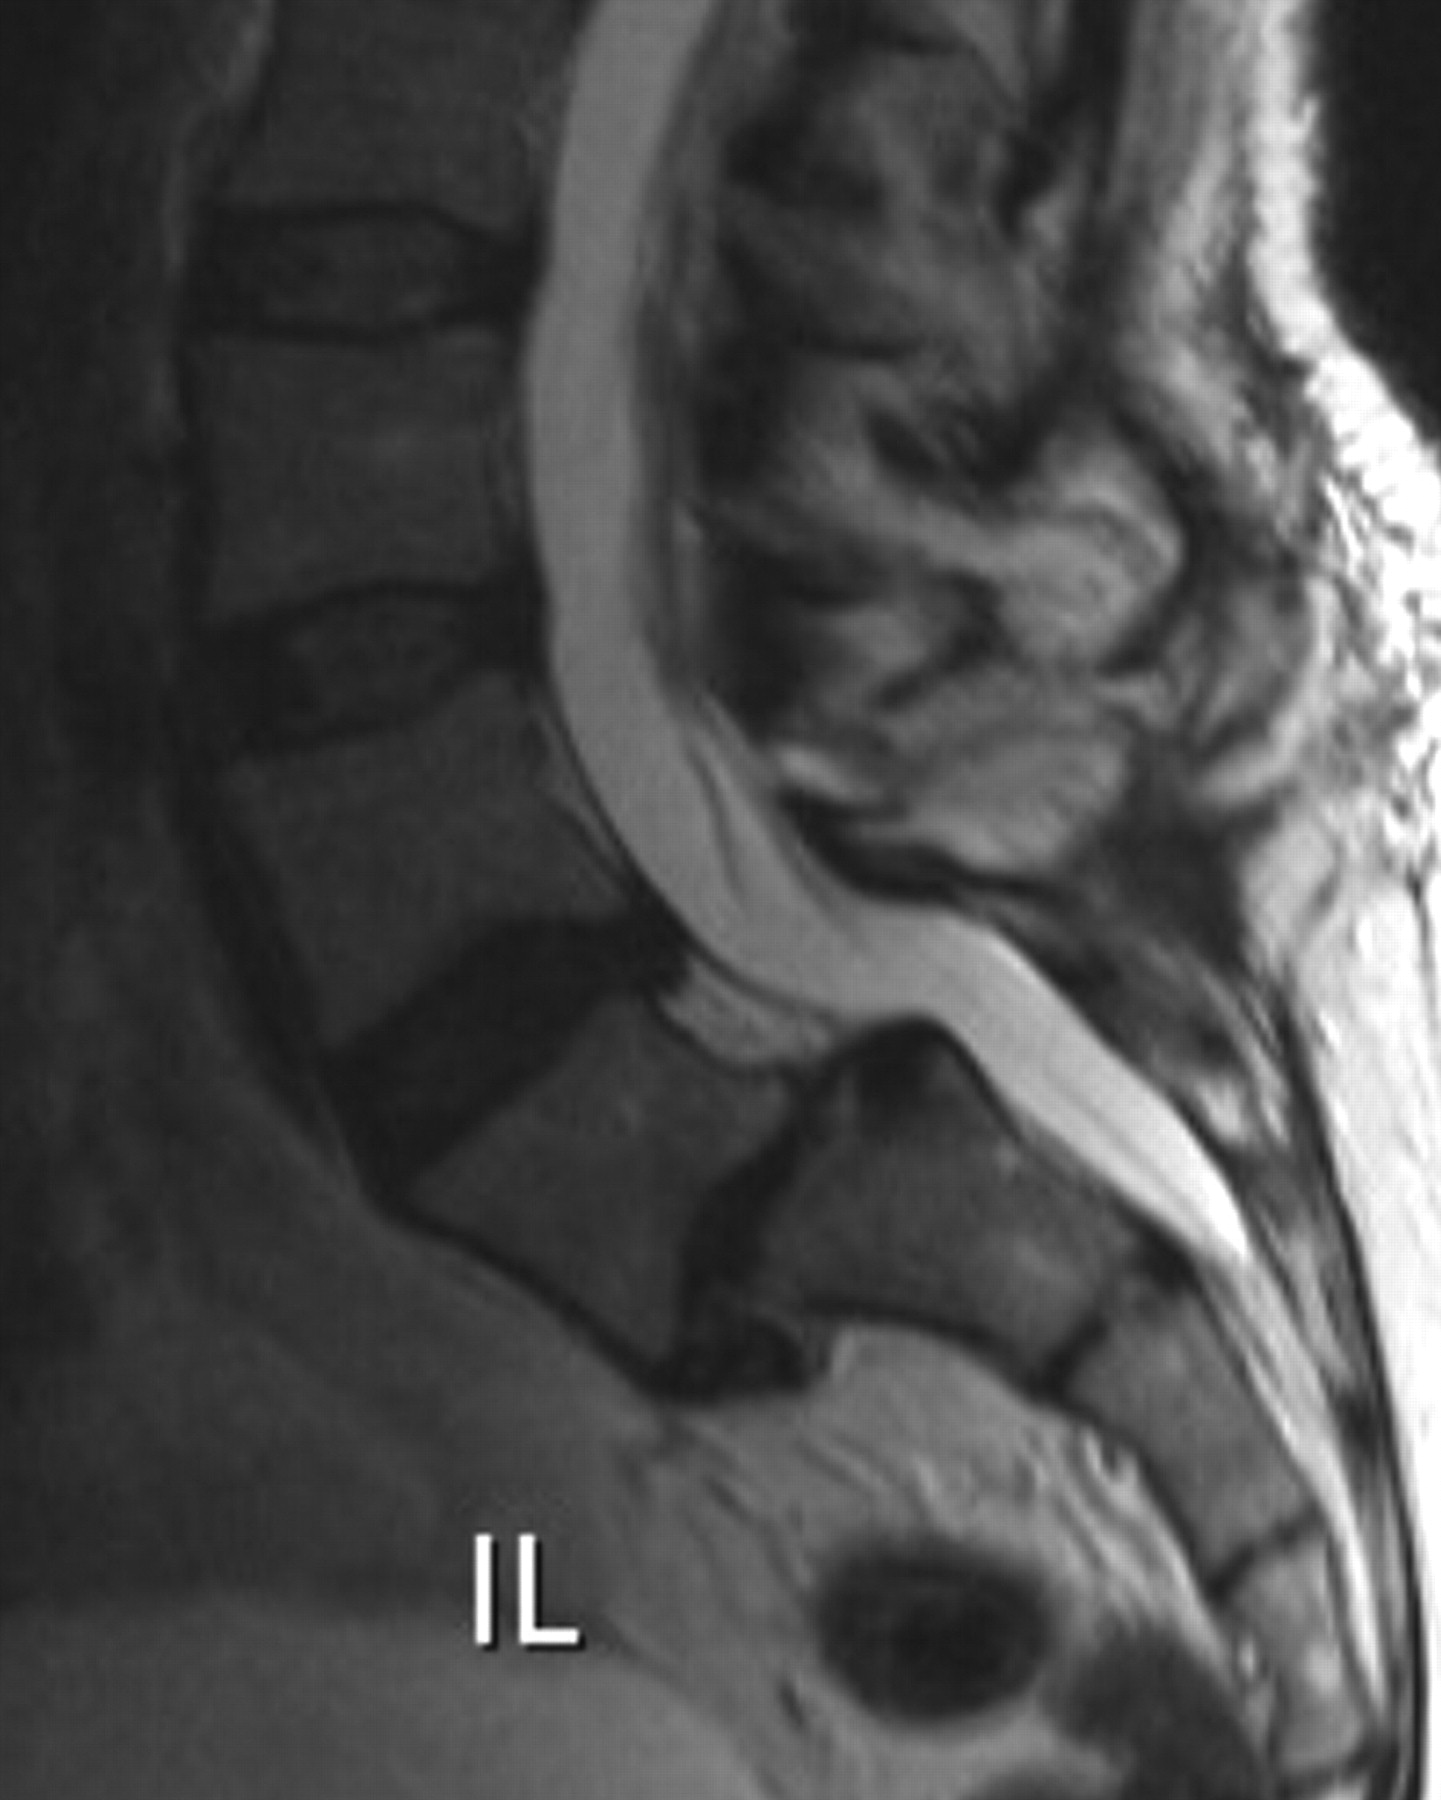
Hypoplasia at L5 with anterolisthesis at L5 on S1, grade II. Vertebral body at L5 is hypoplastic with considerable wedging. There is a grade II anterior vertebral slippage. Notice that the anterior displacement of the posterior border of L5 seems more pronounced than that of the anterior border because of the hypoplasia of the vertebral body. There is severe disk degeneration at L5-S1.
Thinning of the pedicles and hypoplasia of the inferior facets of L5 was present in 17 of the 22 patients (Figs 2 and 3). In all patients, even in those without true anterolisthesis, a clear separation was found between the fragments of the lysed pedicles (Figs 2 and 3).
The tissue behind the vertebral body was pure fat in 10 of the 22 patients. In 12 patients, besides fat, an ascending disk fragment was present at level L5-S1. In 6 patients, an additional disk herniation at L4-L5 was seen.
Disk degeneration and dehydration of L4-L5 were seen in 20 of the 22 patients. Disk degeneration and dehydration of L5-S1 were seen in 15 of the 22 patients.
Statistical Analysis
Inter-reader variability.
From the interobserver variability analysis, a good correlation was found between the different observers. Intraclass correlation coefficients were 0.89 and 0.88 for the control group and for the group of patients with L5 hypoplasia, respectively. No effect was seen of the pathologic state on the variability of the measurement.
Anteroposterior diameter of L5.
The L4 and S1 values tend to be higher in the control group, whereas L5 values are generally smaller in the group of patients with L5 hypoplasia. These results are not significant and show a rather large SD because of interpatient variability. Therefore, we examined the relative percentages between L4 and L5 ((L4-L5)/L4*100) and S1 and L5 ((S1-L5)/S1*100).
Both the relative percentages between L4 and L5 and S1 and L5 were significantly higher in the patients with L5 hypoplasia compared with the control subjects (P < .0001 for both parameters), indicating a relative decrease in L5 size in the patients with L5 hypoplasia.
Wedging.
For all readers, the percentage wedging was significantly larger in the patients with L5 hypoplasia than in the control subjects (P < .0001).
Discussion
It is a well-known fact from anatomic studies that in humans, the size of the vertebral bodies progressively increases from C1 to L5,2-4 which is obvious on radiologic studies ever since the discovery of the x-ray by Röntgen in 1895. At a thoracic and lumbar level, the vertebral body height increases caudally, except posteriorly where it decreases in the lower lumbar region to create the lumbar lordosis.2 Therefore, the lower lumbar vertebrae have some wedge shape, with progression of the wedge values down the spine.4
Only few articles in the anatomic or radiologic literature deal with hypoplasia of vertebral bodies, defined as a smaller anteroposterior diameter of a lower vertebra than the upper ones.1,5 To the best of our knowledge, such hypoplasia was only described in the lumbar regions. In a series of 34 patients, Kim et al5 found that in most cases (91.8%), hypoplasia involved 2 adjacent lumbar vertebrae, whereas hypoplasia of 1 vertebral body was very rare (8.8%).
In 1979, Frank and Miller1 were the first to describe hypoplasia of the fifth lumbar vertebral body in patients with bilateral spondylolysis at L5, on conventional radiographs of the spine. Moreover, they were the first to note that not all patients with spondylolysis had anterior vertebral slippage. Therefore, they introduced the term pseudospondylolisthesis to designate the false impression of spondylolisthesis caused by the shortening of the anteroposterior diameter of L5. The hypoplasia of L5 in patients with spondylolysis was later confirmed by Saraste et al6,7 but apparently was somewhat forgotten since then as a sign of spondylolysis.
It is surprising to note that Frank and Miller1 did not actually measure the anteroposterior diameter of L5, though they state in their introduction that among their patients, they found “a large number in which the anteroposterior diameter of the vertebral body was shortened,” and hypoplasia was the main conclusion of their article. On the basis of their statement, we measured the anteroposterior diameter of L4 and L5 at the midsagittal level as indicated by the entrance of the basivertebral vein and at the level of the S1 sacral endplate. In this way, we were able to find a mean difference between the anteroposterior diameter of L5 and L4 of 3.75 mm, or 10.6% shortening, and a mean difference between the anteroposterior diameter of L5 and S1 of 4.25 mm, or 11.9% shortening. In the control group, the mean anteroposterior diameter of L5 was smaller than both L4 and S1.
New prospective studies might aim at performing volumetric studies with spiral CT or MR imaging to calculate more precisely the degree of hypoplasia of L5, but we chose measurement of the anteroposterior diameter because it was not done before and could more easily be performed on the PACS systems in our department. Because the measurements were performed on MR imaging with the cortical hypointensity as a marker of the border of L5, there could be an error in the measurements but without changing the conclusion that there is a considerable shortening of L5.
We are actually performing volumetric studies of the lumbar vertebral bodies with spiral CT in a select group of healthy subjects and in patients with hypoplasia at L5 in a prospective study and will report on this soon in a separate paper. The calculation of the volume of the vertebral body will be more precise because it takes into account the cumulative effect of the anteroposterior shortening of the vertebral body and the wedging in the calculation of the volume of the vertebral body. The main difficulty seems to be the segmentation of the vertebral body from the posterior elements, which proves easy in L3 and L4 but is more difficult at L5 because of the more difficult separation from the lateral elements. In any case, the study of the volume of lumbar vertebral bodies will give more precise information on the degree of hypoplasia compared with healthy control subjects.
A second important finding by Frank and Miller1 was the abnormal posterior wedging of L5, which has been considered an important predictor of spondylolysis since then.6-9 It has been known for a long time that a certain degree of posterior wedging is normal,3,4 and we could confirm this in our control group, in which a mean percentage wedging was seen of 11.9%. In only 5 patients, the percentage-posterior wedging exceeded 20%.
Frank and Miller1 already reported increased posterior wedging in patients with spondylolysis. We could confirm that by using the same methodology of measurement, all patients with L5 hypoplasia had a posterior wedging of more than 20% with a mean in our series of 24.7%.
Again, an error in the measurements could occur with MR, but without changing the conclusion that posterior wedging of L5 is more pronounced in patients with hypoplasia of L5 and bilateral spondylolysis compared with a healthy control group.
In their study, Frank and Miller1 found hypoplasia and wedging in 9 (45%) of 20 patients, which is surprisingly similar to our figures (45.8%) in a somewhat larger group of patients. Our study could have some bias because we selected our patients on the basis of the MR imaging diagnosis of spondylolysis and/or spondylolisthesis, which probably would underestimate the number of patients with pars defects. Because the anterior position of the posterior border of L5 to the posterior border of S1 simulates spondylolisthesis, it immediately attracts the attention to the pars articularis. Therefore, spondylolysis would be more easily missed in the patients without hypoplasia, so that we might somewhat overestimate the percentage of patients with L5 hypoplasia. It seems anyway that hypoplasia of L5 is, without any doubt, a frequent finding in patients with spondylolysis.
In our series, the incidence of spondylolysis was 2.16%. This value is very low compared with the 4% to 6% incidence of spondylolysis reported in the literature.8 This can probably be explained by the fact that our data are based on the detection of spondylolysis on MR imaging of the lumbar spinal canal. It is known that it can be difficult to image the pars interarticularis with MR imaging.8,10-12 Both false-negative and false-positive results have been reported, especially in cases of coexisting facet joint degeneration, pedicle sclerosis, and in the absence of anterior vertebral slippage.10-12 Ulmer et al,8 in a series of 64 patients with spondylolysis proven by conventional radiographs or CT scanning, reported 30% of misdiagnosis of spondylolysis when the MR images were initially interpreted by direct visualization of defects of the pars interarticularis. This incidence might even be higher in the absence of spondylolisthesis.11
Therefore, several helpful diagnostic signs to detect isthmic lysis have been published during the years. In 1994, Ulmer et al11 described the “wide canal sign” as a strong argument in favor of underlying spondylolysis in patients with spondylolisthesis. In 1995, in a study on patients without spondylolisthesis, Ulmer et al12 attributed this to dorsal subluxation of posterior elements in most patients. This explanation seems reasonable, taking into account that even in patients without anterior vertebral slippage, a clear separation is seen between the fragments of the lysed pedicles. Other less frequent signs include the wedging of the posterior aspect of the vertebral body, bone marrow changes in the pedicle,8 and epidural fat interposition between the dura mater and the spinous process.13 In our study, we could confirm with MR imaging the conclusions of Frank and Miller1 that hypoplasia of L5 is a strong predictor of bilateral spondylolysis, especially in the absence of spondylolisthesis. In our series, there was no patient with hypoplasia of L5 who did not present with bilateral spondylolysis, though in the series of Frank and Miller,1 there was 1 patient with thinning of the isthmus without a complete defect. Additional studies will have to evaluate whether hypoplasia of L5 can be seen in patients without spondylolysis, what the morphologic features of the isthmus in these patients are, and if spondylolysis eventually will develop in these patients on follow-up studies.
The most important question remains the cause of these findings and, more precisely, what is the primary lesion: the spondylolysis or the hypoplasia. One hypothesis could be that there is a congenital hypoplasia of L5 as the primary lesion. This would cause elongation and thinning of the pedicles, which are more vulnerable to subsequent injury, be it an acute trauma or chronic shear stresses and strains. This hypothesis could be sustained by the fact that in many of our patients, the pedicles and facets were hypoplastic.
A more likely hypothesis is that spondylolysis of L5 occurs first. This would cause alterations in the biomechanical properties of the lumbar spine with increased pressure on L5, so that this vertebral body would fail to develop completely and would be wedged by increased pressure on the posterior part of the vertebral body. This would cause foreshortening of L5 with wedge-shaped flattening. This hypothesis is supported by the findings of Ikata et al,14 who observed adolescents with spondylolysis for years and found that wedging of the fifth lumbar vertebra is not present at the early stages but progressively develops in patients with known spondylolysis. This wedging then would favor the development of anterior slippage.9 Moreover, the increased compressive force on the disk in patients with hypoplasia causes early onset degenerative disk disease as demonstrated by Kim et al.5
Therefore, it will be important to observe the patients of our study, especially those without anterior vertebral slippage, and to evaluate if and when spondylolisthesis will eventually develop. We found spondylolisthesis grade I in 5 (23%) and grade II in 4 (18%) of our patients. Unfortunately, we could not detect any change in the degree of anterior vertebral slippage during the years in the files, nor could we detect the development of an olisthesis in patients with previously healthy vertebral alignment. We will report on the follow-up of our patients in due time.
Conclusions
L5 hypoplasia is a frequent finding in patients with bilateral spondylolysis. L5 hypoplasia seems to be another sign indicating the possible presence of bilateral spondylolysis. This is extremely important in MR imaging because the recognition of spondylolysis is not always evident.
L5 hypoplasia and wedging in patients with bilateral spondylolysis do not necessarily lead to true anterior vertebral slipping but can be at the base of pseudospondylolisthesis. Spondylolisthesis can only be diagnosed if both the anterior and posterior margins of the vertebral body are displaced forward.
Footnotes
Previously presented at: Annual Meeting of the European Society of Neuroradiology, Geneva, Switzerland, September 14, 2006, (presented by G.W.); Annual Meeting of the American Society of Spine Radiology, Marco Island, Fla, February 22, 2007 (presented by P.P.); and European Congress of Radiology, Vienna, Austria, March 10, 2007 (presented by G.W.).
References
- Received September 4, 2008.
- Accepted after revision November 8, 2008.
- Copyright © American Society of Neuroradiology


