
Abstract
BACKGROUND AND PURPOSE: High-resolution contrast-enhanced MR angiography (CE-MRA) acquired at 3T exquisitely depict carotid artery (CA) stenosis. In this study, we examined the agreement of different vessel-analysis tools with manual quantitative measurement by 2 readers using CE-MRA data.
MATERIALS AND METHODS: Three vessel tools determining the trajectory of the vessel of interest and, subsequently, the vessel dimensions were tested against manual measurements. Diameter and area stenoses were calculated. CE-MRA data of 32 patients with CA stenosis were evaluated. The agreement between different measurements was assessed with κ statistics after categorizing stenosis (<25%, 25%–49%, 50%–69%, 70%–99%, and 100%).
RESULTS: The mean grades of stenosis based on diameter measurements were 59% (readers) and 60%/56%/59% based on the analysis with tools A/B/C (P = 0.2–0.7). κ values for agreement between readers and the vessel tools were 0.73/0.77/0.77 (tools A/B/C for all CAs) and 0.66/0.74/0.75 (for the symptomatic side). The mean grades of stenoses based on area measurements for tools A/B/C were 68%/63%/69% versus 58% for readers. Values from readers differed significantly from those for tools A and C (P < 0.01). κ values for agreement between readers and the vessel tools were 0.66/0.55/0.64 (for all CAs) and 0.53/0.44/0.57 (for the symptomatic side).
CONCLUSIONS: The automated approach allows accurate assessment of vessel dimensions in MRA images at least for diameter measurements according to the North American Symptomatic Carotid Endarterectomy Trial criteria.
Although conventional catheter x-ray angiography is still regarded as the gold standard in the evaluation of carotid stenosis,1–3 less invasive carotid imaging techniques are gaining increased acceptance. MR angiography (MRA), CT angiography (CTA), and duplex/Doppler sonography (DUS) are minimally invasive techniques capable of 3D vessel visualization. Several MRA techniques have been proposed for carotid artery (CA) evaluation; the most popular ones are time-of-flight (TOF) MRA and contrast-enhanced MRA (CE-MRA). A prerequisite for accurate depiction of vessel stenosis is high spatial resolution, which can be improved at higher field strengths with parallel imaging techniques. Although MRA datasets are 3D with potentially isotropic properties, examinations are generally evaluated on 2D maximum intensity projections (MIPs), and grading of stenosis is performed either visually or by caliper measurements. It would be desirable to obtain quantitative morphologic information directly from the 3D data, to improve the analysis of MRA studies. To accomplish this, one requires accurate 3D segmentation tools. In this article, the results of 3 commercially available vessel tools are validated against those of 2 independent radiologists who assessed the vessels in a traditional way using thin MIPs and multiplanar reformations (MPRs).
Materials and Methods
Patients
The MRAs of 32 consecutive patients (18 males and 14 females; mean age, 68 years ± 14 years; age range, 16–86 years) with different grades of CA stenosis were retrieved from our PACS data base for this Health Insurance Portability and Accountability Act−compliant and institutional review board−approved retrospective review. Clinical indications included history of stroke (n = 5), transient ischemic attack (n = 11), amaurosis fugax (n = 12), and progressive dizziness (n = 4). For purposes of our study, only patients with some degree of carotid disease noted on CE-MRA were included in the analysis; those with normal CA lumens were skipped.
Imaging Technique
MRA was performed on a 3T whole-body MR imaging system (Magnetom Tim Trio; Siemens Medical Solutions, Malvern, Pa) equipped with 8 receiver channels and a fast gradient system (peak gradient amplitude, 40 mT/m; maximum slew rate, 200 mT/m/ms). Contrast (0.2-mmol/kg gadodiamide, Omniscan; Amersham-GE Healthcare, Princeton, NJ; or gadopentetate dimeglumine, Magnevist; Berlex Laboratories, Wayne, NJ) was injected with an electronic power injector (Spectris; Medrad, Pittsburgh, Pa) at a fixed rate of 1.2 mL/s followed by a 30-mL saline bolus. Circulation time was measured with the test-bolus method (2-mL contrast agent and 30-mL saline; injection rate, 1.2 mL/s). Pulse sequence parameters were as follows: TR, 3 ms; TE, 1.2 ms; bandwidth, 750 Hz/pixel; flip angle, 20°-24°(depending on specific absorption rate level); FOV, 381 × 317 mm2; matrix size, 576 × 394; section thickness, 0.94 mm (0.7-mm interpolated); number of partitions, 112. K-space acquisition was linear because of the integrated reference scan; asymmetric k-space sampling (partial Fourier 80%) was applied in all 3 planes. Zero interpolation was performed as appropriate to the nearest power of 2. Parallel acquisition with a generalized autocalibrating partially parallel acquisitions algorithm based on autocalibrating simultaneous acquisition of spatial harmonics and parallel acquisition4 was applied with an acceleration factor of 4 and 32 reference k-space lines. Voxel dimensions were 0.81 × 0.66 × 0.94 mm3, and the acquisition time was 20 seconds.
Vessel Analysis
Diameter and area stenosis of the cervical CA were assessed with (semi-) automated vessel tools under visual control. Three vessel-analysis tools in their latest commercially available versions were used for evaluation: A, AquariusNET (Version 1.7.2.19; TeraRecon, San Mateo, Calif); B, Vessel View (Siemens Medical Solutions); C, Vitrea 2 (Version 3.9; Vital Images, Minnetonka, Minn). A center line was processed to create a curved MPR along the vessel course, and additional transverse views perpendicular to the vessel were generated (Figs 1–⇓3). The AquariusNET software (tool A) was used instead of the workstation package because the latter was restricted to processing images with matrices not exceeding 512 × 512. The contours were automatically detected by the software. However, in most cases, the operator had to adjust the threshold so that the contours fell halfway through the gray-scale spectrum between the bright and dark areas of the arterial walls. Vessel View (tool B) also allowed automatic computation of diameter and area stenosis values.

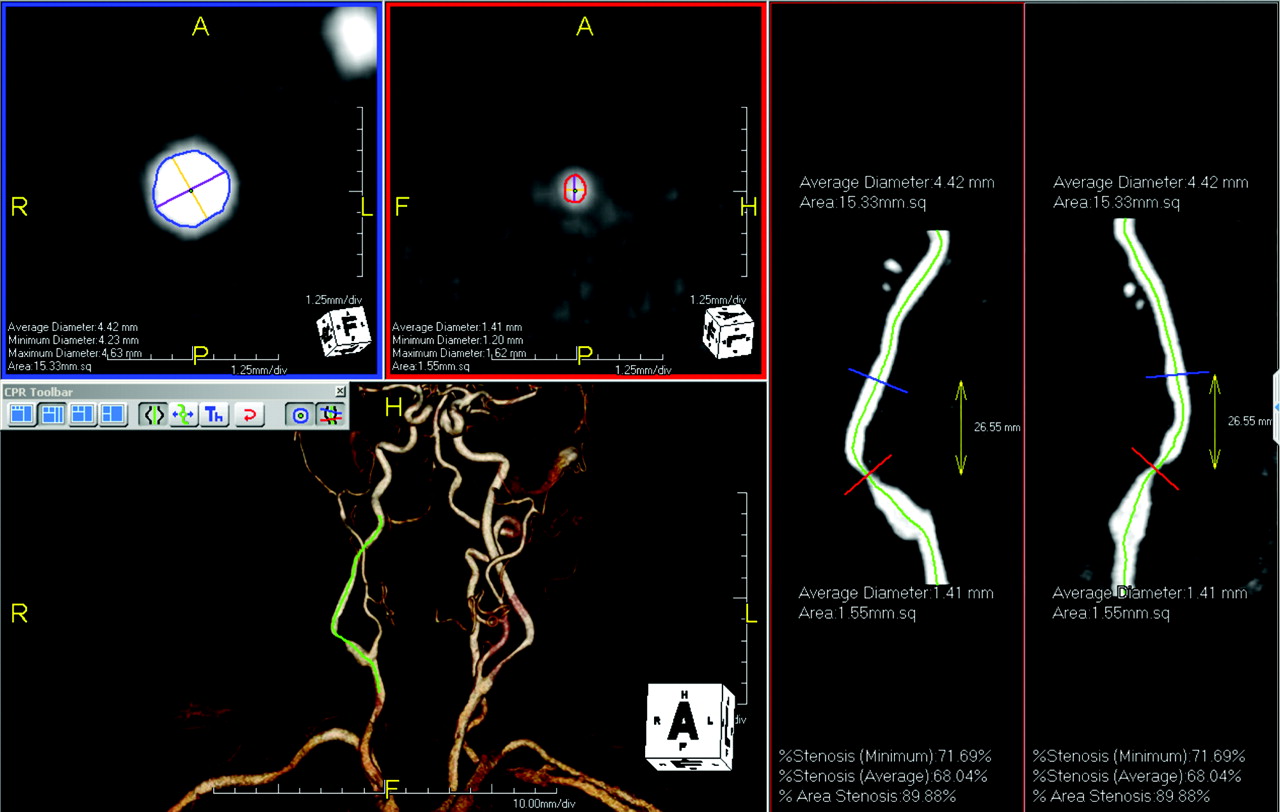
An 80-year-old patient with restenosis after carotid endarterectomy of the right ICA. User interface of tool A (AquariusNET): cross-sectional images at the reference site (blue border) and the site of maximal luminal narrowing (red border) are displayed in the left upper quadrant. The maximal and minimal diameters and the vessel area are provided. The stretched vessel views on the right side indicate the position of the cross-sectional images at different viewing angles. The green line represents the center line, which is also shown in the volume-rendered image in the left lower quadrant.

Same patient as in Fig 1. User interface of tool B (Vessel View): orthogonal images aligned to the center line on the left side. A volume-rendered 3D model of the MRA with an overlaid curved planar reformation is displayed in the middle. The green line indicates the center line. The stretched vessel views (middle row, bottom) indicate the positions of the stenosis measurements and the reference site. The area measurements are displayed in the volume-rendered image; the values for the stenotic lumen are in the left lower image. All values can be displayed in the “measurements” card. MinDiam indicates minimum diameter; MaxDiam, maximum diameter.

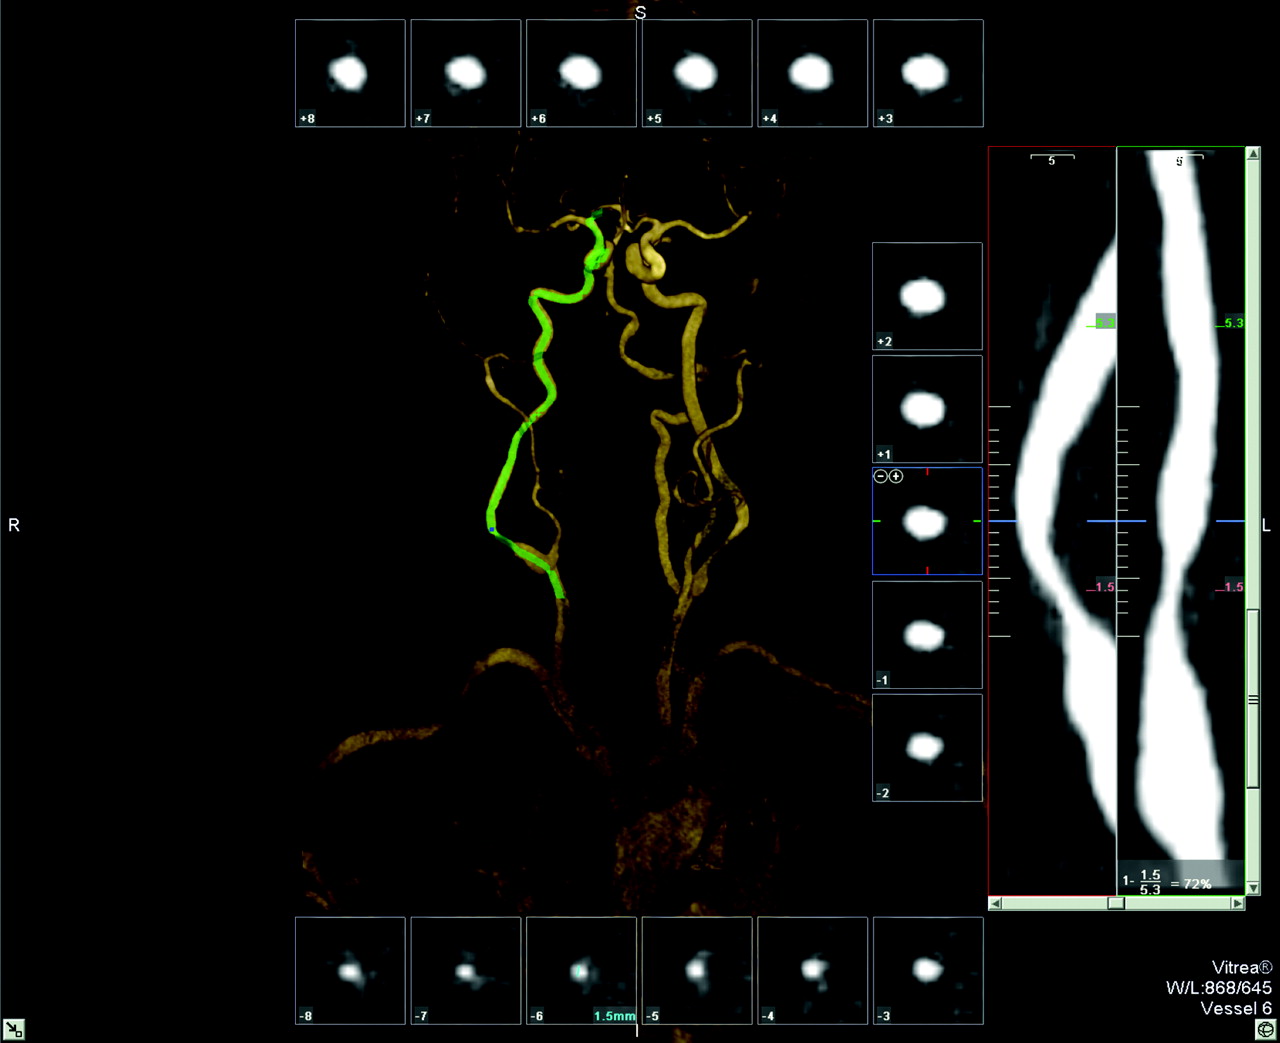
Same patient as in Fig 1. User interface of tool C (Vitrea): cross-sectional images aligned perpendicular to the center line surrounding a volume-rendered 3D model of the MRA. The green line indicates the center line. The stretched vessel views on the right side indicate the position of the cross-sectional images at different viewing angles; the site of the (manual) measurements and the corresponding values are given. The stenosis value is displayed in the lower right corner.
However, if the examiner was not comfortable with the automated contour finding, he had to adjust the definition of the lumen edge so that like tool A, the contours fell in the half range of the gray color spectrum between the bright and dark areas of the arterial walls. Vitrea (tool C) had no option to automatically measure lumen diameters and areas on MR images; only CT data were suitable for automated stenosis calculations. Therefore, to calculate the surface areas for the normal and stenotic segments, we drew the contours manually in the planes orthogonal to the automatically detected center line, by using the freehand region-of-interest alternative and following the same rules that were implemented for the tools A and B. Subsequently, 2 experienced radiologists specialized in cardiovascular imaging independently evaluated the MRA data on the scanner console and assessed stenosis manually by using interactive thin-slab MIP to create a “scout” image of the internal CA (ICA) on which MPR images were adjusted perpendicular to the vessel course. The MPR images were used to measure the diameter and area of the vessel lumen. The average of the estimated stenosis by the 2 readers was considered the “standard of reference.”
Minimal luminal diameter and minimal luminal area of the ICA were compared with a reference point beyond the bulb/poststenotic dilation where the vessel walls were parallel again. Window-level setting was left to the reader's discretion. Area measurements were performed with freeform region of interest. Cases of near-occlusion as defined by Fox et al,5 showing a poststenotic collapse of the vessel, were considered high grade (stenosis value, 95%). Each reader used a stopwatch to evaluate his time demand for morphologic measurements and stenosis grading.
Statistical Analysis
The interobserver agreement for all CAs included in this study for both readers was visualized by using scatter and Bland-Altman plots.6 Differences between the averages of the 2 readers and each vessel tool were examined with a paired-samples t test. The degree of agreement was assessed with Cohen κ;7 therefore, stenoses were categorized into 5 categories: vessel irregularity with <25% stenosis, 25%–49% stenosis, 50%–69% stenosis, 70%–99% stenosis, or 100% stenosis (occlusion). Computations were performed separately for all CAs included in this study as well as for the symptomatic side. The assessment of the deviations from the null hypothesis (equality of the distributions of the stenosis values derived by the different modalities) was visualized by simultaneous 95% Tukey confidence intervals for the mean difference in stenosis in a 1-way layout for the aligned stenosis values. The alignment of the stenosis values by centering them for each patient by their mean allows a comparison of the stenosis differences between patients at a common measurement scale.
Results
Of 64 CAs examined, manual analysis revealed 5 (8%) occluded arteries, 7 (11%) with a high-grade stenosis (70%–99%), and 14 (22%) with a moderate-grade stenosis (50%–69%). There were 14 (22%) mild-grade stenoses (<50%), and abnormalities limited to vascular irregularities (<25% lumen reduction) were detected in 24 (37%) CAs. Of the high-grade stenoses, 2 were defined as near-occlusions. In Fig 4, the values for manual diameter and area stenoses measurements are visualized with scatter and Bland-Altman plots. Processing time with the vessel tools was 2–5 minutes per CA (including retrieving data from storage) on average. Manual measurements of the diameter and area of the vessel lumen had to be performed with tool C, but manual interaction to optimize the definition of the vessel boundaries was also necessary in most cases for the other tools. Therefore, to keep the results for all vessel tools comparable, we did not evaluate fully automatic generated stenosis values but only those after manual optimization.

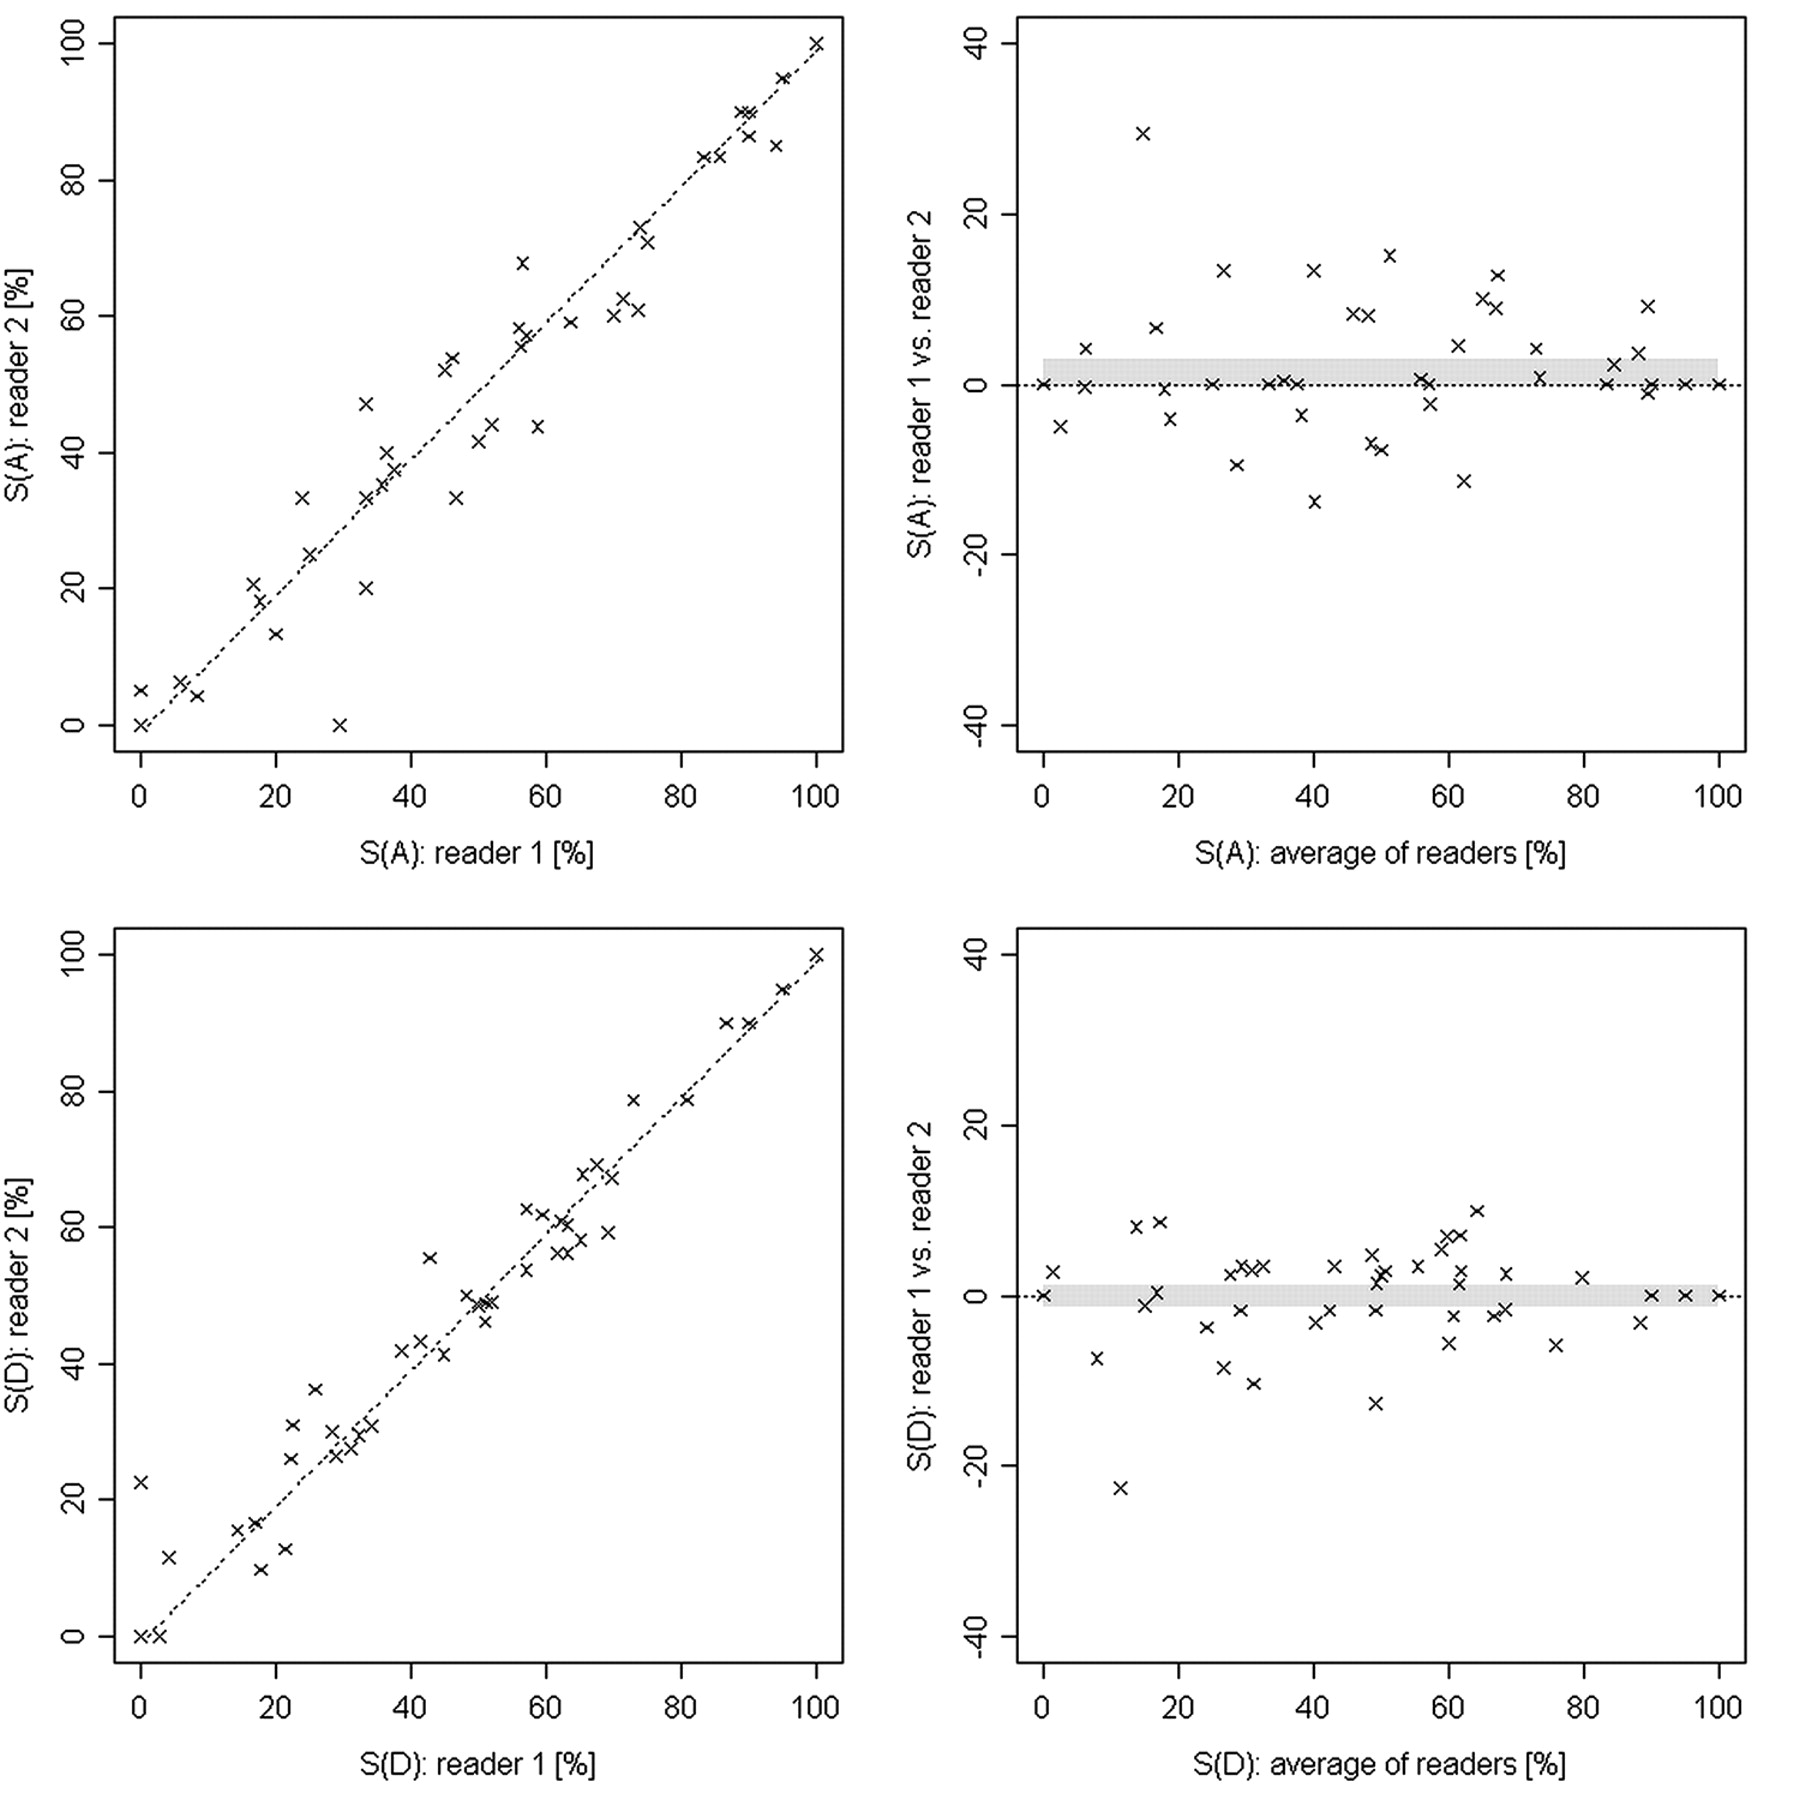
Scatter and Bland-Altman plots represent the degrees of stenosis in MRA for area (top row) and diameter (bottom row) measurements from both readers of the symptomatic and the contralateral side. The confidence interval is indicated by the gray band. The Pearson correlation coefficients are 0.99 and 0.97 for diameter and area measurements, respectively. S(A) indicates area of stenosis; S(D), diameter of stenosis.
The mean grade of stenosis based on diameter measurements was 59% as determined by the readers, 60% based on the analysis with tool A, 56% based on the analysis with tool B, and 59% based on the analysis with tool C. No statistically significant differences between the stenosis values obtained with the tools and manual evaluation by the 2 readers were found (P values = 0.2–0.7, paired t test). All cases of occlusion (n = 5) and near-occlusion (n = 2) were correctly identified with each method. A summary of the results for the determination of diameter stenosis is given in the Table.
Grading of stenosis (n = 64 CAs) based on diameter measurements
Intermethod agreement was good. κ values for the comparison of the reference and tool A were 0.73 for both sides and 0.66 for the symptomatic side only. κ values for the comparison of the reference and tool B were 0.77 for both and 0.74 for the symptomatic side; the values for tool C were 0.77 and 0.75, respectively.
The mean grade of stenosis based on area measurements was 58% as determined by the readers, 68% based on the analysis with tool A, 63% based on the analysis with tool B, and 69% based on the analysis with tool C. The differences between tool B and the readers were not significant (P = 0.1), but the differences between the readers and the other tools reached significance (P < 0.01).
Intermethod agreement for area measurements was lower compared with diameter measurements. κ values for the comparison of the reference and tool A were 0.66 for both sides and 0.53 for the symptomatic side. κ values for the comparison of the reference and tool B were 0.55 for both and 0.44 for the symptomatic side. The values for tool C were 0.64 and 0.57, respectively.
On-line Figure 1 demonstrates the stenosis values obtained with the vessel tools in comparison with manual evaluation. The differences between each method and the average of both manual evaluations for the symptomatic CA are visualized in Fig 5.

Comparison of the modalities for diameter stenosis measurements (S[D]) and area stenosis measurements (S[A]) for the symptomatic side only. The dots indicate the mean difference, and the horizontal lines represent 95% Tukey intervals. The differences between the pairs that do not cross the zero line are statistically significant.
Discussion
The results of our study suggest that in the analysis of high-spatial-resolution CE-MRA, commercially available software tools for assessing carotid stenosis produce results comparable with those from manual expert contouring. The current accepted standard for imaging carotid stenosis is selective intra-arterial digital subtraction angiography (IADSA); however, there are inherent risks of neurologic complications of the procedure approaching 1.3%.8 To detect hemodynamically relevant stenosis, one may prefer noninvasive imaging methods, like DUS, CTA, or MRA. DUS is a well-established method, with pooled sensitivity and specificity values of 86% and 87% for the identification of severe stenosis.9 CTA requires intravenous contrast injection but may otherwise be considered a noninvasive technique. Modern multisection systems generate highly reproducible results, and multidimensional analysis of stenosis and plaque can be performed.10–12 However, MR imaging can provide functional data (flow measurements, time-resolved imaging) and morphologic data (assessment of the vessel wall and lumen) without exposing the patient to radiation or iodinated contrast material. A variety of different MRA techniques has been reported, notably TOF-MRA and CE-MRA. The ability to classify carotid stenosis on TOF-MRA and CE-MRA in comparison with IADSA has been well documented; in a meta-analysis of 21 studies, sensitivity and specificity values of 95% and 90% were reported for the detection of severe stenosis with MRA compared with IADSA.9 Stenosis >50% can be reliably diagnosed (sensitivity 90%, specificity 97%) with CE-MRA at 1.5T.13 More recent publications on CE-MRA at 3T suggest even higher accuracy.14
Accurate detection and grading of stenosis are dependent on the imaging technique and spatial resolution. The use of high-field-strength MR imaging systems and parallel imaging improves vessel visualization.15–24 Besides data-acquisition techniques, image postprocessing influences the accuracy of the results. A number of postprocessing approaches have been proposed,25–31 but few published data address the performance of commercially available vessel-analysis tools for the assessment of CA stenosis.32,33
In our study, each tool provided transverse MPR views perpendicular to and along the vessel center line. Two clicks on the vessel of interest were usually sufficient to select the vessel and initiate the segmentation process and center-line calculation. This facilitated detection of the site of maximum stenosis as well as the reference site for the calculation of the stenosis value. Although automated vessel-boundary definition was feasible with tools A and B, visual inspection and manual adaptations were required, mainly due to varying vascular signal intensity between the different studies, introducing some operator dependence. All tools allowed manual boundary definition by encircling the vessel lumen. Tool A featured manipulation of the lumen definition by means of thresholding, whereas tool B required adjusting of anchor points. User interaction was necessary in virtually all cases in which the stenosis was located near the carotid flow divider. In these cases, the segmentation algorithms included the external CA in the volume of interest and resulted in incorrect values of diameter and area stenosis. Zhang et al32 reported similar limitations for a different vessel-analysis tool for CT data. Passing vessels were another source of error less frequently encountered.
In our study, grading of stenosis on the basis of diameter measurements did not reveal significant differences between the different vessel tools. In terms of time demand, the vessel tools were comparable with manual measurements. Area measurements provide more insight into the geometric shape of the stenosis compared with linear diameter measurements. However, determination of area stenosis is more complicated yet not widely used. Comparing the κ values, as expected, we found that those of diameter measurements were considerably higher than those of area measurements. Area stenosis values were not statistically different from manual measurements for evaluation of the asymptomatic side, but for the symptomatic side (usually representing higher degrees of stenosis), area stenosis values determined by the 2 readers were lower than those determined with the vessel tools, reaching statistical significance for tools A and C.
Because our study addressed the performance of analysis tools rather than the performance of the MR imaging technique itself, we did not include comparative imaging modalities such as x-ray angiography to avoid bias introduced by the imaging technique itself. To define a reference, we averaged the results of 2 experienced readers with manual contouring.34 An excellent interobserver correlation for the 2 readers supports that approach. A limitation is that manual interaction was performed with each of the vessel-analysis tools, potentially introducing operator-dependent bias. User-independent vessel analysis would be desirable, but suboptimal vessel-boundary definition and short-segment occlusions preclude fully automated analysis. Further progress in the segmentation algorithms is necessary to overcome these obstacles.
Conclusions
Vessel analysis tools may enhance standardization and objectivity for measurement of carotid stenosis on high-resolution CE-MRA. Although user interaction is still necessary, we found no significant deviation in diameter measurements made with 3 different commercial tools when compared with manual contouring by expert readers. Area stenosis values of the symptomatic side were consistently higher compared with the readers’ results.
Footnotes
Reza Habibi and Michael M. Lell contributed equally to the article.
Indicates article with supplemental on-line figure.
References
- Received January 31, 2008.
- Accepted after revision August 4, 2008.
- Copyright © American Society of Neuroradiology


