Advertisement

Main menu

  • Home
  • Content
    • Current Issue
    • Accepted Manuscripts
    • Article Preview
    • Past Issue Archive
    • Video Articles
    • AJNR Case Collection
    • Case of the Week Archive
    • Case of the Month Archive
    • Classic Case Archive
  • Special Collections
    • AJNR Awards
    • Low-Field MRI
    • Alzheimer Disease
    • ASNR Foundation Special Collection
    • Photon-Counting CT
    • View All
  • Multimedia
    • AJNR Podcasts
    • AJNR SCANtastic
    • Trainee Corner
    • MRI Safety Corner
    • Imaging Protocols
  • For Authors
    • Submit a Manuscript
    • Submit a Video Article
    • Submit an eLetter to the Editor/Response
    • Manuscript Submission Guidelines
    • Statistical Tips
    • Fast Publishing of Accepted Manuscripts
    • Graphical Abstract Preparation
    • Imaging Protocol Submission
    • Author Policies
  • About Us
    • About AJNR
    • Editorial Board
    • Editorial Board Alumni
  • More
    • Become a Reviewer/Academy of Reviewers
    • Subscribers
    • Permissions
    • Alerts
    • Feedback
    • Advertisers
    • ASNR Home

User menu

  • Alerts
  • Log in

Search

  • Advanced search
American Journal of Neuroradiology

American Journal of Neuroradiology

ASHNR American Society of Functional Neuroradiology ASHNR American Society of Pediatric Neuroradiology ASSR
  • Alerts
  • Log in

Advanced Search

  • Home
  • Content
    • Current Issue
    • Accepted Manuscripts
    • Article Preview
    • Past Issue Archive
    • Video Articles
    • AJNR Case Collection
    • Case of the Week Archive
    • Case of the Month Archive
    • Classic Case Archive
  • Special Collections
    • AJNR Awards
    • Low-Field MRI
    • Alzheimer Disease
    • ASNR Foundation Special Collection
    • Photon-Counting CT
    • View All
  • Multimedia
    • AJNR Podcasts
    • AJNR SCANtastic
    • Trainee Corner
    • MRI Safety Corner
    • Imaging Protocols
  • For Authors
    • Submit a Manuscript
    • Submit a Video Article
    • Submit an eLetter to the Editor/Response
    • Manuscript Submission Guidelines
    • Statistical Tips
    • Fast Publishing of Accepted Manuscripts
    • Graphical Abstract Preparation
    • Imaging Protocol Submission
    • Author Policies
  • About Us
    • About AJNR
    • Editorial Board
    • Editorial Board Alumni
  • More
    • Become a Reviewer/Academy of Reviewers
    • Subscribers
    • Permissions
    • Alerts
    • Feedback
    • Advertisers
    • ASNR Home
  • Follow AJNR on Twitter
  • Visit AJNR on Facebook
  • Follow AJNR on Instagram
  • Join AJNR on LinkedIn
  • RSS Feeds

AJNR Awards, New Junior Editors, and more. Read the latest AJNR updates

Research ArticleFUNCTIONAL

Origin of Synchronized Low-Frequency Blood Oxygen Level–Dependent Fluctuations in the Primary Visual Cortex

J.S. Anderson
American Journal of Neuroradiology October 2008, 29 (9) 1722-1729; DOI: https://doi.org/10.3174/ajnr.A1220
J.S. Anderson
  • Find this author on Google Scholar
  • Find this author on PubMed
  • Search for this author on this site
  • Article
  • Figures & Data
  • Info & Metrics
  • Responses
  • References
  • PDF
Loading

Article Figures & Data

Figures

  • Fig 1.
    • Download figure
    • Open in new tab
    • Download powerpoint
    Fig 1.

    Selection of regions of interest. A, Visual stimuli shown to right and left hemifields corresponding to activation in left and right visual cortices. Stimuli were flashed with alternating black and white regions (100% contrast) at 6 Hz, alternating between left and right images every 20 seconds for 4 minutes. B, Activation maps in 1 subject from previously mentioned stimulation. Activation in the primary and extrastriate visual cortex is seen on the left in red and on the right in green. The yellow box on the sagittal view shows the brain region acquired for BOLD sequences. C, Left visual cortex time series. Slightly >3% increase in BOLD signal intensity is seen averaged across the left primary visual cortex cluster. Three minutes of data are shown.

  • Fig 2.
    • Download figure
    • Open in new tab
    • Download powerpoint
    Fig 2.

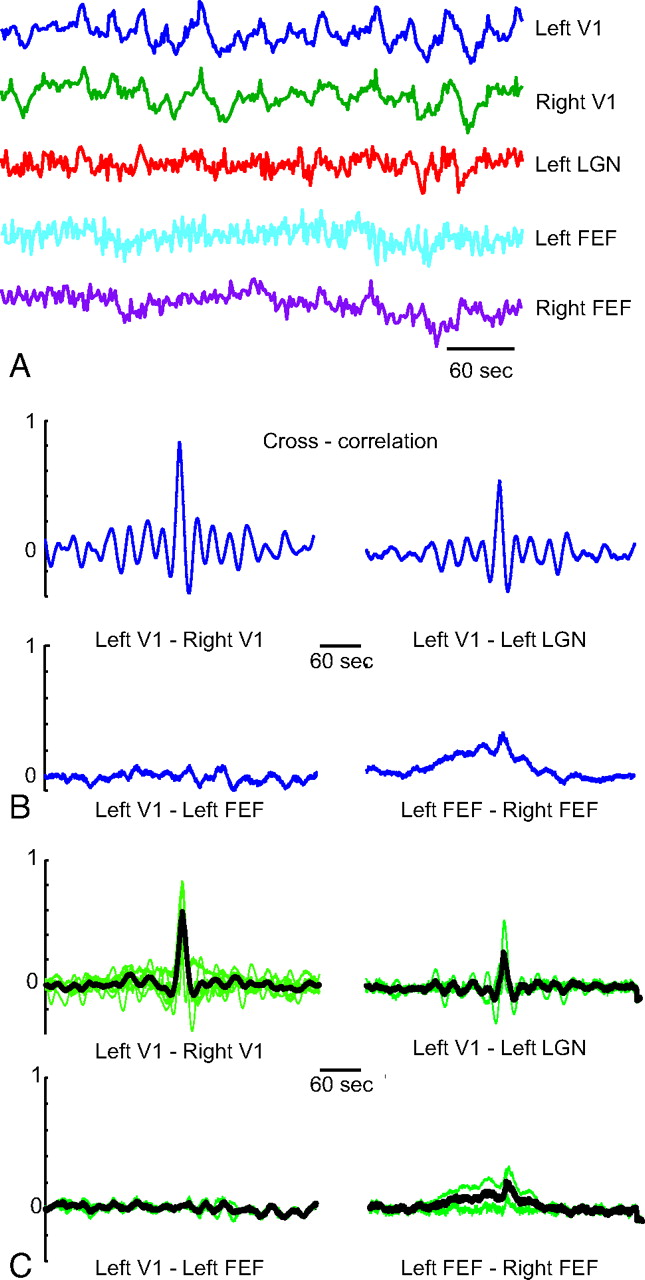
    Synchronized BOLD fluctuations. A, Time series data from 1 subject. Six minutes of data are shown. Traces represent average BOLD signal intensity from regions of interest in the bilateral primary visual cortex (V1), left LGN, and bilateral frontal eye fields (FEF). B, Cross-correlation analysis represents full 14-minute resting state data from regions listed previously. Bilateral V1 shows strong focal correlation, with similar but diminished correlation between V1 and LGN. No correlation is seen between V1 and FEF. Bilateral FEF show much broader temporal correlation. C, Summary resting state BOLD cross-correlation from 6 subjects. Green traces show cross-correlograms for individual subjects, and black traces show an average cross-correlogram across subjects (bilateral V1, n = 6; left V1-left LGN, n = 3; left V1-left FEF, n = 2, left FEF-right FEF: n = 2).

  • Fig 3.
    • Download figure
    • Open in new tab
    • Download powerpoint
    Fig 3.

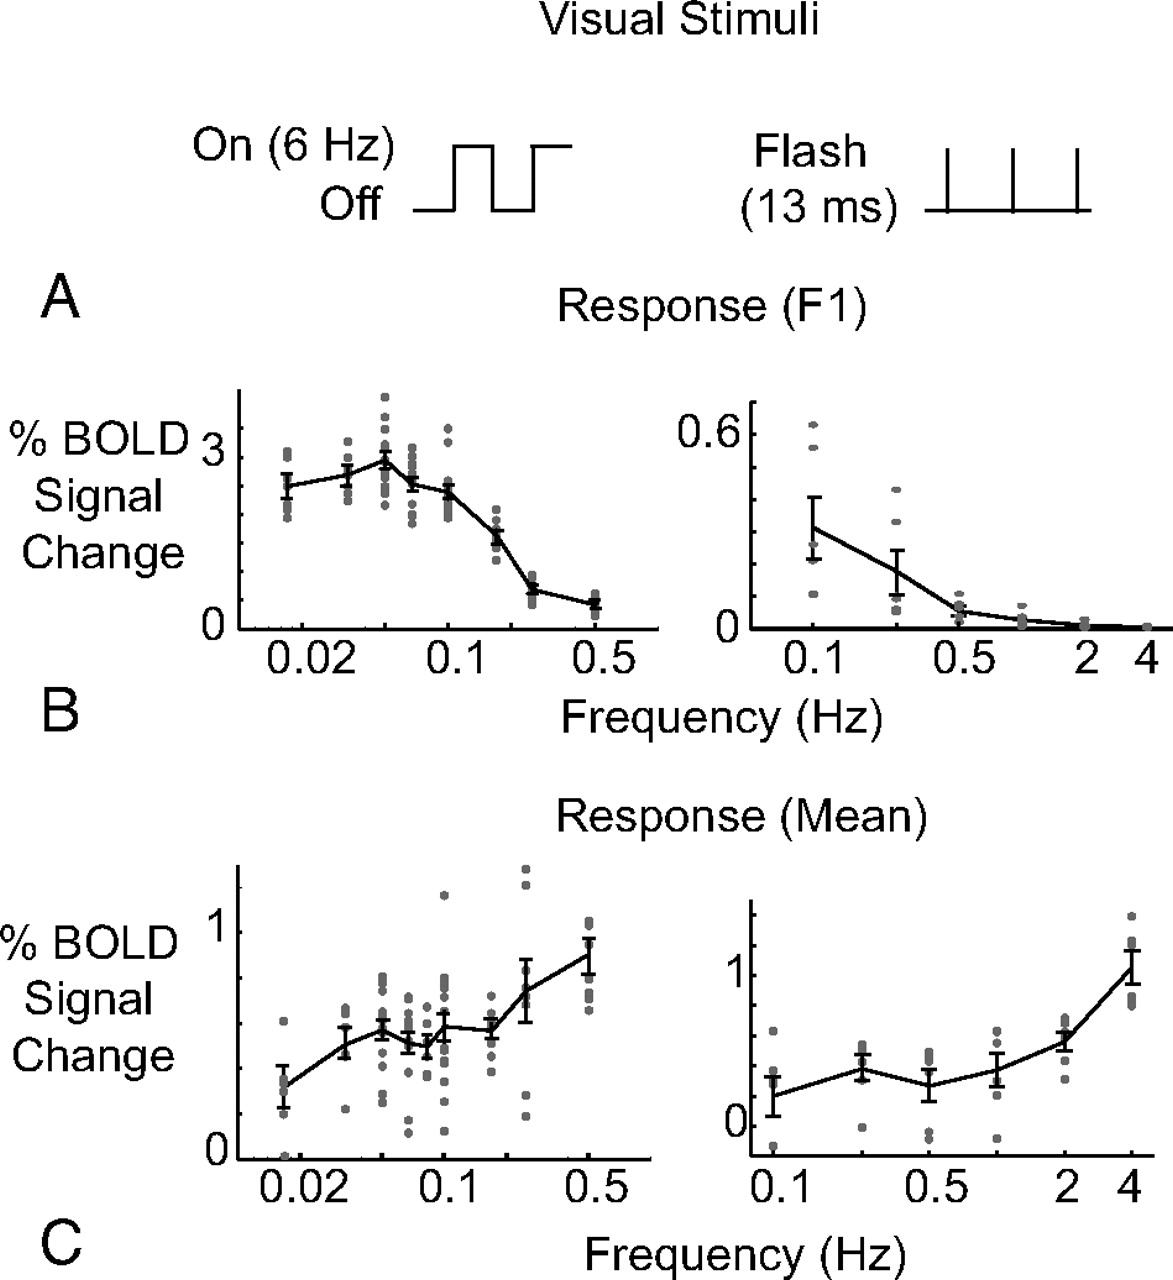
    Vascular low-pass filtering of neurovascular coupling. A, Data in the first column represent BOLD responses to a 6-Hz flashing radial checkerboard pattern turned ON and OFF at frequencies ranging from 0.01 to 0.5 Hz. Data in the second column represent BOLD responses to single flashes of 1 screen refresh duration (13 ms) of the same radial checkerboard pattern presented at frequencies ranging from 0.1 to 4 Hz. B, Peak-to-peak response for 1 period of the stimulus. Individual points plotted are responses from each subject of the amplitude of the BOLD response averaged across all cycles of stimulus presentation. Left and right hemifield responses are plotted as separate data points on the left and are averaged for each data point on the right. Error bars represent 1 standard error of the mean. C, Mean BOLD responses compared with baseline (blank screen stimulus), averaged across the entire trial for each frequency condition. Data points and error bars are as in Fig 3B.

  • Fig 4.
    • Download figure
    • Open in new tab
    • Download powerpoint
    Fig 4.

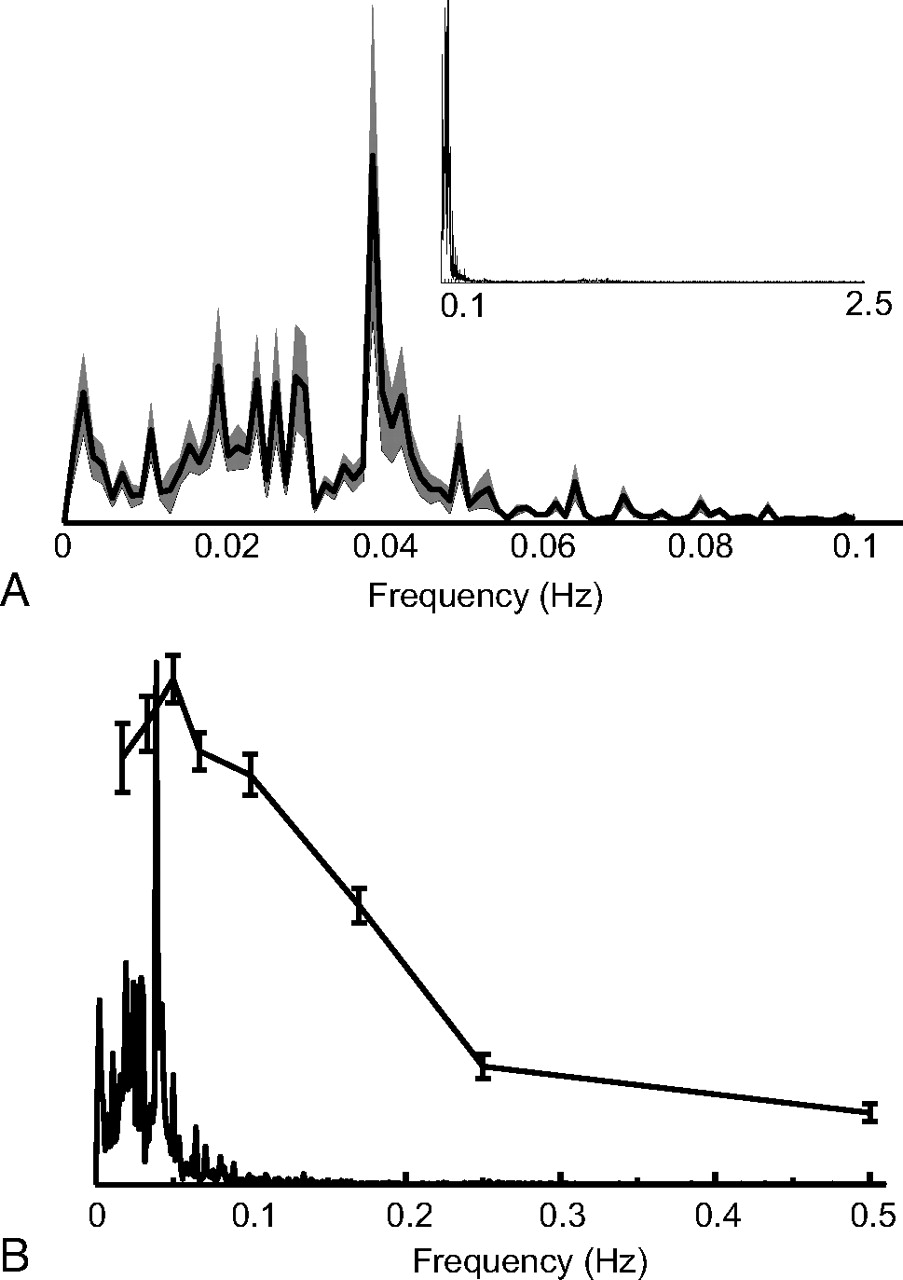
    Frequencies present in spontaneous BOLD fluctuations in the primary visual cortex. A, Full-field (inset) and zoomed-in power spectra of resting-state BOLD fluctuations. Spectra are computed for each subject, normalized to the unit area under the curve, and averaged across subjects. Shaded regions represent ±1 standard error of the mean as a function of frequency. B, Superimposed vascular filtering data of Fig 3B and the resting-state power spectrum from Fig 4A. Frequencies between 0.05 and 0.2 Hz are under-represented if frequency distribution of spontaneous BOLD fluctuations arises from vascular filtering alone.

  • Fig 5.
    • Download figure
    • Open in new tab
    • Download powerpoint
    Fig 5.

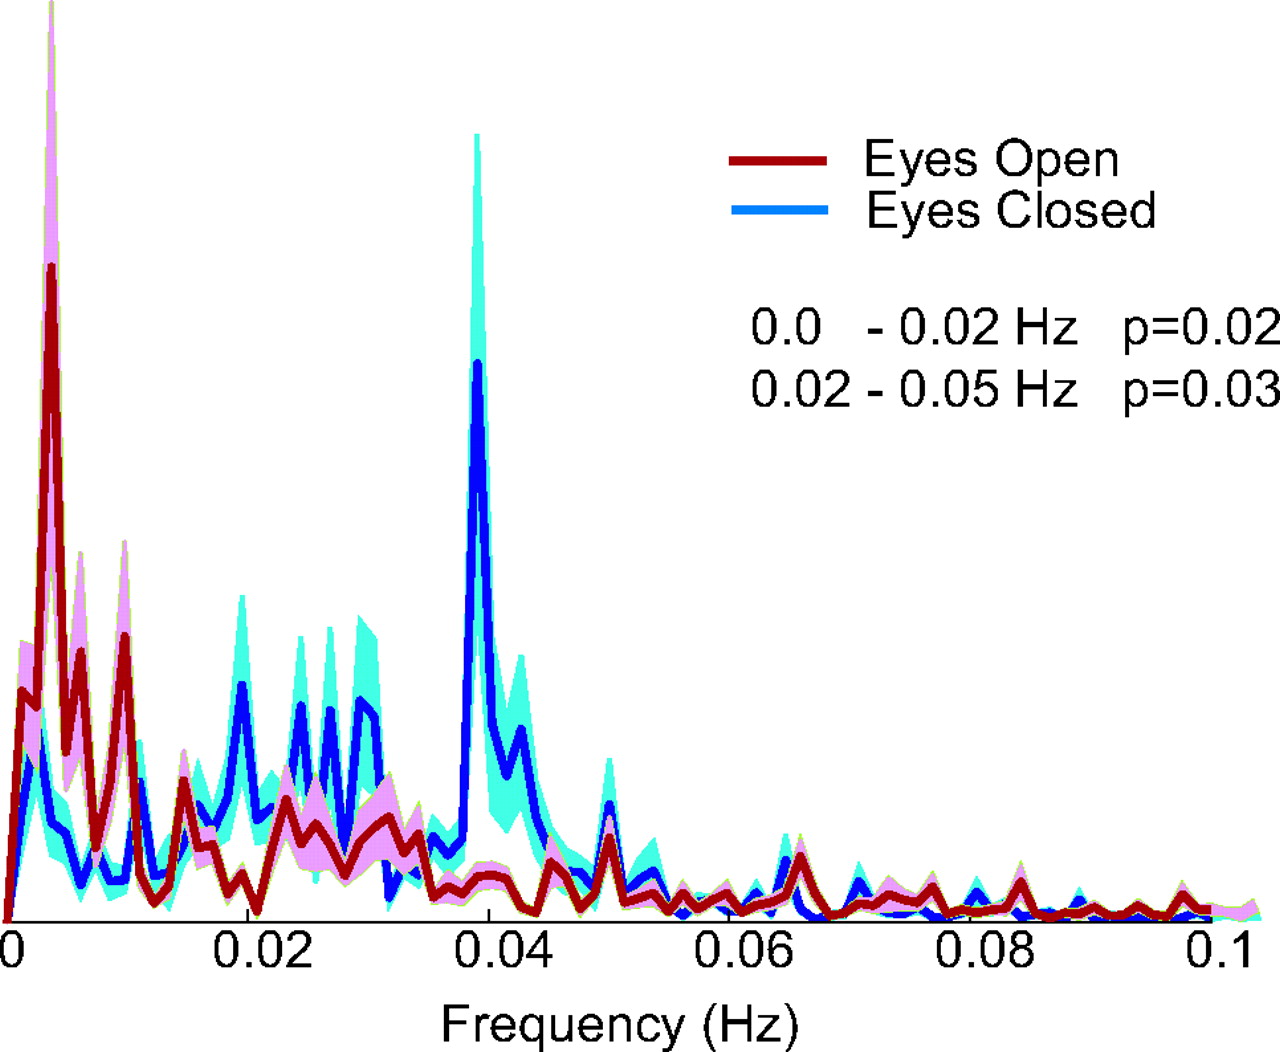
    Power in spontaneous BOLD fluctuations in resting and visual stimulation conditions. Resting state (blue) condition shows the shift of frequency distribution to higher frequencies compared with natural visual stimulation condition (red). Spectra are averaged across 6 subjects for each condition. Shaded areas represent standard error of the mean as a function of frequency across the population. The pair-wise t test for each frequency range (0–0.02 Hz and 0.02–0.05 Hz) indicates statistically significant differences between the 2 conditions for each of the 2 ranges.

  • Fig 6.
    • Download figure
    • Open in new tab
    • Download powerpoint
    Fig 6.

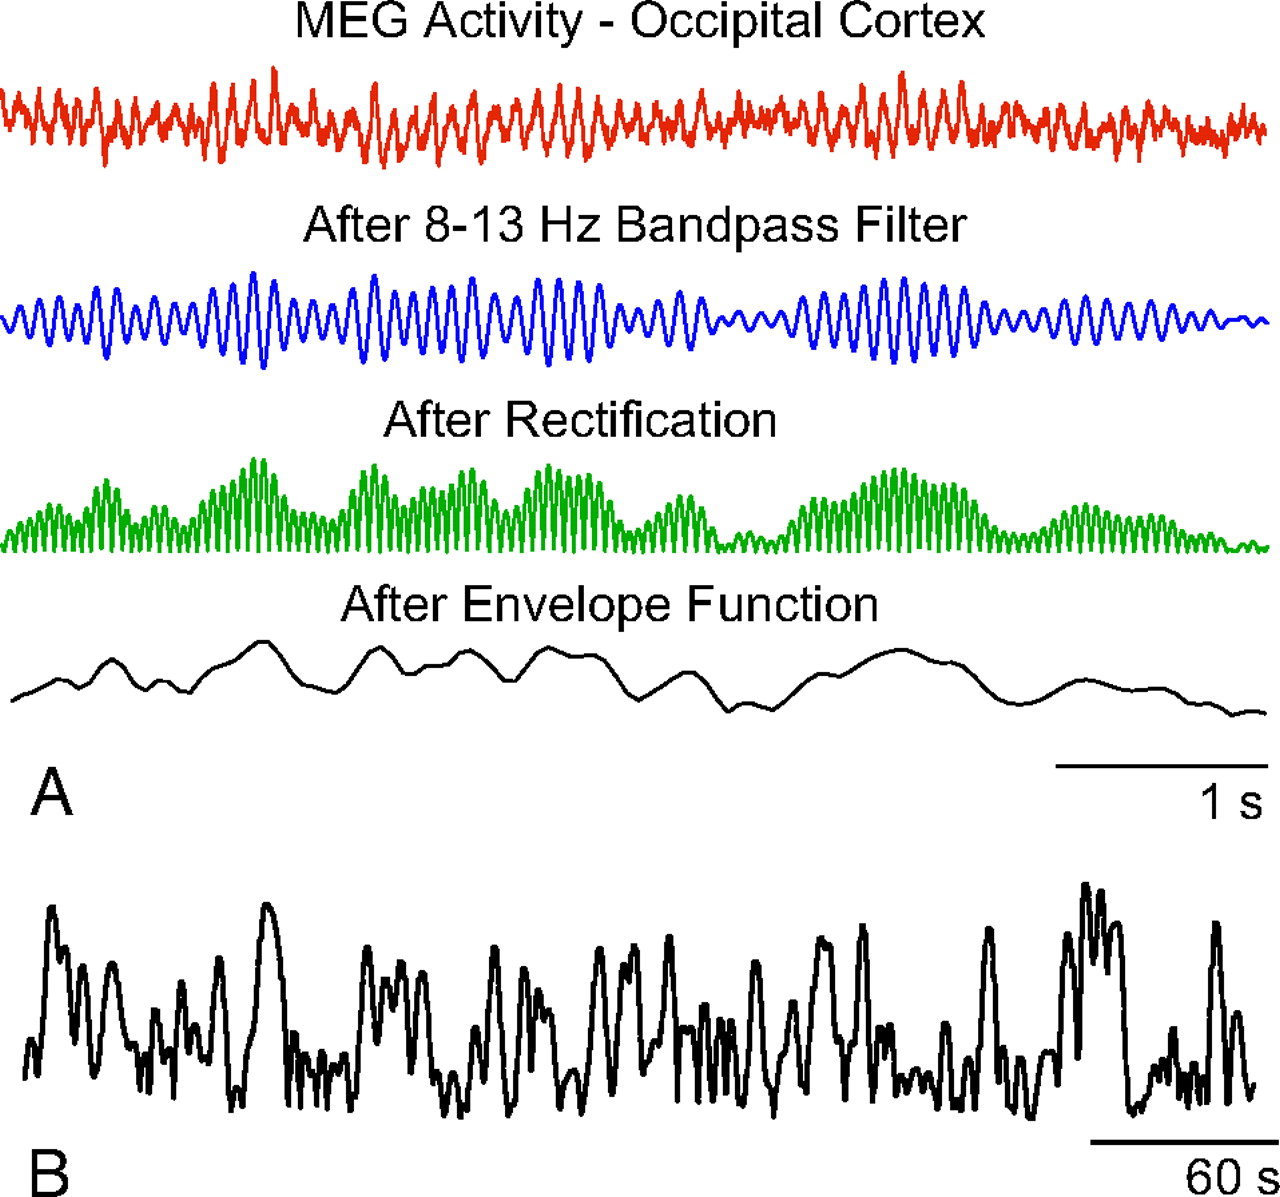
    Amplitude modulation of MEG signal intensity. A, Procedure for calculating amplitude modulation for each frequency band of the MEG signal intensity. Raw data were first bandpass-filtered into δ, α, β, and γ bands. Data were then full-wave-rectified, and an envelope function was calculated to measure the variation in amplitude with time. Approximately 5 seconds of data are shown. B, Envelope function from Fig 6A for 1 subject. Approximately 7 minutes of data are shown. Note the similarity in appearance of low-frequency fluctuations to BOLD fluctuations shown in Fig 2.

  • Fig 7.
    • Download figure
    • Open in new tab
    • Download powerpoint
    Fig 7.

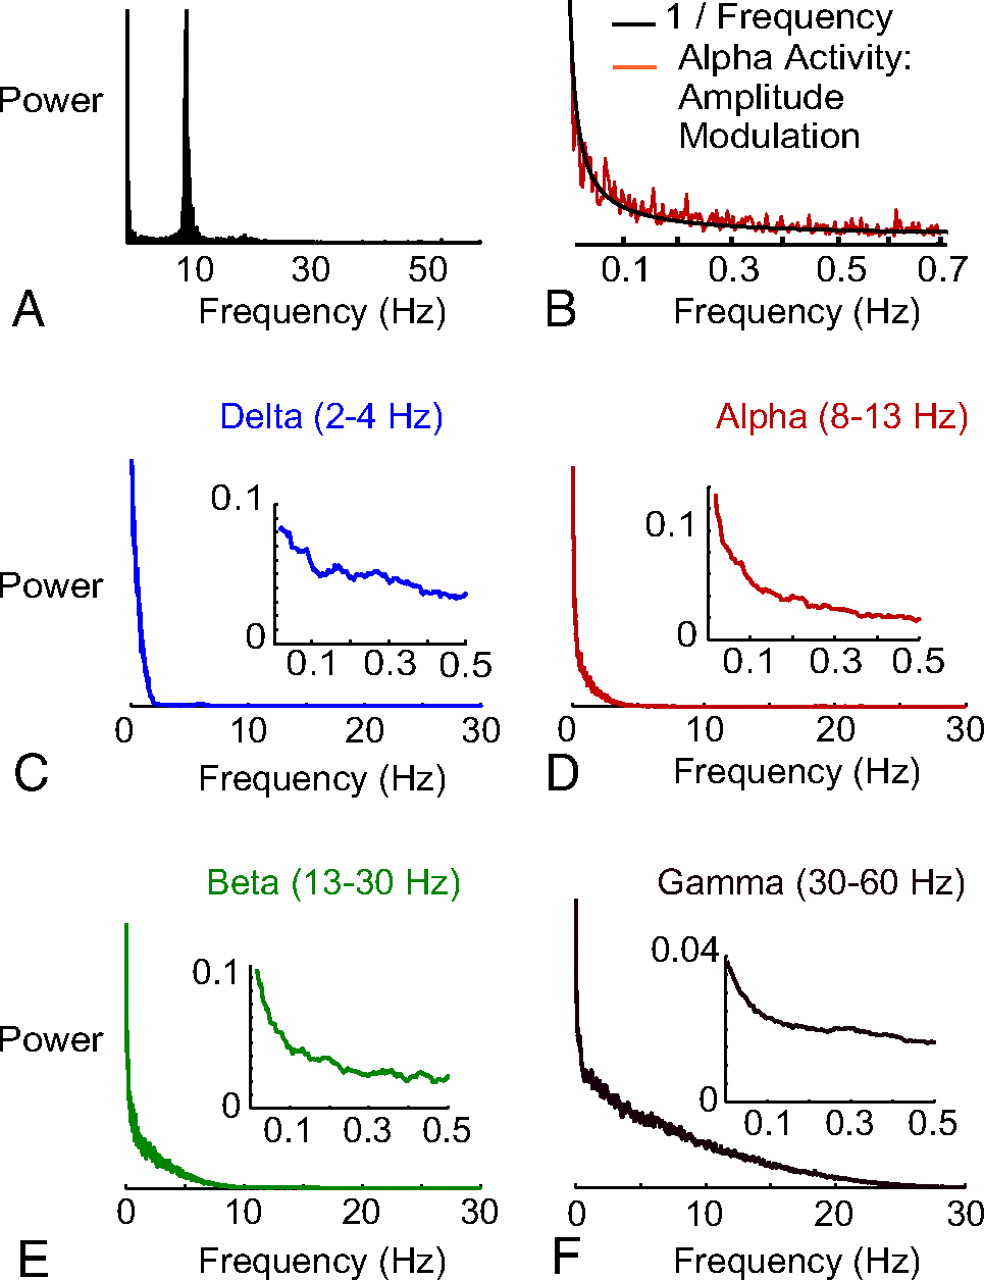
    The 1/frequency distribution of amplitude modulation of MEG signal intensity. A, Full-field power spectrum of unfiltered MEG signal intensity in 1 subject, resting state. Note that most of the power comprises α activity. B, The power spectrum for amplitude modulation of α activity from data in Fig 6B. A 1/frequency curve shows excellent fit to the data. C, Amplitude modulation of δ activity. Full-field power spectrum with inset showing zoomed-in region of the curve up through 0.5 Hz. Data show averages from normalized power spectra from 6 subjects. D–F, As per Fig 7C for α, β, and γ activity, also averaged from 6 subjects.

PreviousNext
Back to top

In this issue

American Journal of Neuroradiology: 29 (9)
American Journal of Neuroradiology
Vol. 29, Issue 9
October 2008
  • Table of Contents
  • Index by author
Advertisement
Print
Download PDF
Email Article

Thank you for your interest in spreading the word on American Journal of Neuroradiology.

NOTE: We only request your email address so that the person you are recommending the page to knows that you wanted them to see it, and that it is not junk mail. We do not capture any email address.

Enter multiple addresses on separate lines or separate them with commas.
Origin of Synchronized Low-Frequency Blood Oxygen Level–Dependent Fluctuations in the Primary Visual Cortex
(Your Name) has sent you a message from American Journal of Neuroradiology
(Your Name) thought you would like to see the American Journal of Neuroradiology web site.
CAPTCHA
This question is for testing whether or not you are a human visitor and to prevent automated spam submissions.
Cite this article
J.S. Anderson
Origin of Synchronized Low-Frequency Blood Oxygen Level–Dependent Fluctuations in the Primary Visual Cortex
American Journal of Neuroradiology Oct 2008, 29 (9) 1722-1729; DOI: 10.3174/ajnr.A1220

Citation Manager Formats

  • BibTeX
  • Bookends
  • EasyBib
  • EndNote (tagged)
  • EndNote 8 (xml)
  • Medlars
  • Mendeley
  • Papers
  • RefWorks Tagged
  • Ref Manager
  • RIS
  • Zotero
0 Responses
Respond to this article
Share
Bookmark this article
Origin of Synchronized Low-Frequency Blood Oxygen Level–Dependent Fluctuations in the Primary Visual Cortex
J.S. Anderson
American Journal of Neuroradiology Oct 2008, 29 (9) 1722-1729; DOI: 10.3174/ajnr.A1220
del.icio.us logo Twitter logo Facebook logo Mendeley logo
  • Tweet Widget
  • Facebook Like
  • Google Plus One
Purchase

Jump to section

  • Article
    • Abstract
    • Materials and Methods
    • Results
    • Discussion
    • Conclusion
    • Acknowledgments
    • Footnotes
    • References
  • Figures & Data
  • Info & Metrics
  • Responses
  • References
  • PDF

Related Articles

  • No related articles found.
  • PubMed
  • Google Scholar

Cited By...

  • Normal Aging in Mice is Associated with a Global Reduction in Cortical Spectral Power and a Network-Specific Decline in Functional Connectivity
  • Hierarchical dynamics as a macroscopic organizing principle of the human brain
  • Interpreting Temporal Fluctuations in Resting-State Functional Connectivity MRI
  • Low-frequency calcium oscillations accompany deoxyhemoglobin oscillations in rat somatosensory cortex
  • Crossref (28)
  • Google Scholar

This article has been cited by the following articles in journals that are participating in Crossref Cited-by Linking.

  • The oscillating brain: Complex and reliable
    Xi-Nian Zuo, Adriana Di Martino, Clare Kelly, Zarrar E. Shehzad, Dylan G. Gee, Donald F. Klein, F. Xavier Castellanos, Bharat B. Biswal, Michael P. Milham
    NeuroImage 2010 49 2
  • Resting Brain Connectivity: Changes during the Progress of Alzheimer Disease
    Hong-Ying Zhang, Shi-Jie Wang, Bin Liu, Zhan-Long Ma, Ming Yang, Zhi-Jun Zhang, Gao-Jun Teng
    Radiology 2010 256 2
  • Interpreting temporal fluctuations in resting-state functional connectivity MRI
    Raphaël Liégeois, Timothy O. Laumann, Abraham Z. Snyder, Juan Zhou, B.T. Thomas Yeo
    NeuroImage 2017 163
  • Hierarchical dynamics as a macroscopic organizing principle of the human brain
    Ryan V. Raut, Abraham Z. Snyder, Marcus E. Raichle
    Proceedings of the National Academy of Sciences 2020 117 34
  • Network anticorrelations, global regression, and phase‐shifted soft tissue correction
    Jeffrey S. Anderson, T. Jason Druzgal, Melissa Lopez‐Larson, Eun‐Kee Jeong, Krishnaji Desai, Deborah Yurgelun‐Todd
    Human Brain Mapping 2011 32 6
  • Large-scale spontaneous fluctuations and correlations in brain electrical activity observed with magnetoencephalography
    Zhongming Liu, Masaki Fukunaga, Jacco A. de Zwart, Jeff H. Duyn
    NeuroImage 2010 51 1
  • Connectivity Gradients Between the Default Mode and Attention Control Networks
    Jeffrey S. Anderson, Michael A. Ferguson, Melissa Lopez-Larson, Deborah Yurgelun-Todd
    Brain Connectivity 2011 1 2
  • Characterizing dynamic functional connectivity in the resting brain using variable parameter regression and Kalman filtering approaches
    Jin Kang, Liang Wang, Chaogan Yan, Jinhui Wang, Xia Liang, Yong He
    NeuroImage 2011 56 3
  • Organization of Propagated Intrinsic Brain Activity in Individual Humans
    Ryan V Raut, Anish Mitra, Scott Marek, Mario Ortega, Abraham Z Snyder, Aaron Tanenbaum, Timothy O Laumann, Nico U F Dosenbach, Marcus E Raichle
    Cerebral Cortex 2020 30 3
  • BOLD Granger Causality Reflects Vascular Anatomy
    J. Taylor Webb, Michael A. Ferguson, Jared A. Nielsen, Jeffrey S. Anderson, Pedro Antonio Valdes-Sosa
    PLoS ONE 2013 8 12

More in this TOC Section

  • Kurtosis and Epileptogenic Tubers: A Pilot Study
  • Glutaric Aciduria Type 1: DK vs. Conventional MRI
  • Brain Iron in Niemann-Pick Type C: 7T Study
Show more FUNCTIONAL

Similar Articles

Advertisement

Indexed Content

  • Current Issue
  • Accepted Manuscripts
  • Article Preview
  • Past Issues
  • Editorials
  • Editor's Choice
  • Fellows' Journal Club
  • Letters to the Editor
  • Video Articles

Cases

  • Case Collection
  • Archive - Case of the Week
  • Archive - Case of the Month
  • Archive - Classic Case

More from AJNR

  • Trainee Corner
  • Imaging Protocols
  • MRI Safety Corner
  • Book Reviews

Multimedia

  • AJNR Podcasts
  • AJNR Scantastics

Resources

  • Turnaround Time
  • Submit a Manuscript
  • Submit a Video Article
  • Submit an eLetter to the Editor/Response
  • Manuscript Submission Guidelines
  • Statistical Tips
  • Fast Publishing of Accepted Manuscripts
  • Graphical Abstract Preparation
  • Imaging Protocol Submission
  • Evidence-Based Medicine Level Guide
  • Publishing Checklists
  • Author Policies
  • Become a Reviewer/Academy of Reviewers
  • News and Updates

About Us

  • About AJNR
  • Editorial Board
  • Editorial Board Alumni
  • Alerts
  • Permissions
  • Not an AJNR Subscriber? Join Now
  • Advertise with Us
  • Librarian Resources
  • Feedback
  • Terms and Conditions
  • AJNR Editorial Board Alumni

American Society of Neuroradiology

  • Not an ASNR Member? Join Now

© 2025 by the American Society of Neuroradiology All rights, including for text and data mining, AI training, and similar technologies, are reserved.
Print ISSN: 0195-6108 Online ISSN: 1936-959X

Powered by HighWire