
Abstract
BACKGROUND AND PURPOSE: Malformations of cortical development (MCD) are traditionally considered as a cause of epilepsy. Our aim was to study patients with focal MCD, by using multivoxel proton MR spectroscopy; we focused not only on the lesion but also on the normal-appearing contralateral side (NACS). Our hypothesis was that the metabolic abnormality extends to the NACS; therefore, it would be inadequate to consider NACS as an internal control.
MATERIALS AND METHODS: We studied 16 patients with focal MCD. MR spectroscopy was performed by using a point-resolved spectroscopy sequence technique, including the MCD area and the NACS. In each volume of interest, a smaller volume of interest of 2.25 cm3 centered on the MCD was selected to study the N-acetylaspartate/creatine (NAA/Cr) ratio. In NACS, this ratio was studied by placing a symmetric voxel in comparison with the smaller MCD volume of interest. A control group (n = 30) was also studied to evaluate both white and gray matter by using the same MR spectroscopy protocol.
RESULTS: From 16 analyzed volumes of interest with MCD, 9 were composed of gray matter heterotopia and 7 of cortical dysplasia. MR spectroscopy of both MCD lesions and NACS (n = 10) showed decreased NAA/Cr compared with that of the control group. NACS in these patients did not present significant differences regarding NAA/Cr in comparison with the affected side.
CONCLUSIONS: MR spectroscopy demonstrated abnormal NAA/Cr in both MCD lesions and NACS in patients harboring focal MCD, giving support to the hypothesis that in MCD metabolic abnormalities extend far away from the limits of the lesion, reaching the contralateral side.
Malformations of cortical development (MCD) are congenital anomalies of the brain that are genetically programmed and/or a result of insults during proliferation, migration, and organization of neuronal cells. MCD are widely recognized as a relevant cause of refractory epilepsy. Congenital malformations were found in 14% of autopsied brains from patients with epilepsy; of those, 46.5% had migrational disorders.1 Recently, the term “MCD” has replaced the expression “migrational disorders” because MCD can occur not only during migration of neurons but at any moment of their developmental stage.
The advent of MR imaging allowed more accurate recognition and diagnosis of developmental disorders of the cerebral cortex.2 On the basis of MR imaging studies, new classifications have been proposed,3,4 and terminology and classification of MCD in the literature remain controversial. In an effort to better categorize MCD, a new classification is based on known developmental steps, pathologic features, and genetics (when possible) and takes into account neuroimaging features.4
Until now, technologic advances in the field of neuroimaging have provided relevant biochemical information. Proton MR spectroscopy is a technique that allows in vivo characterization of the metabolic state of the brain. Its role is well established in many cerebral diseases such as tumors, leukodystrophies, and some metabolic conditions.5,6
Although MR imaging has provided an undeniable contribution to a better understanding of MCD, there are some data indicating that the visible lesion might not reflect the entire abnormality, which may extend beyond what is perceived in MR imaging, even with sophisticated volumetric techniques.7 Our purpose was to evaluate, by using multivoxel MR spectroscopy, patients presenting with epilepsy and focal MCD and to focus on the lesion and on the normal-appearing contralateral side (NACS). Our goal was to determine the metabolic abnormalities found in MCD lesions and to interrogate whether these are also present in NACS. This presence would support the idea that brain involvement in MCD is much more diffuse than the anatomic boundaries seen on MR imaging. Furthermore, finding of an abnormal metabolic profile on the NACS precludes comparison between the MCD and the contralateral side, which is a common strategy when dealing with focal lesions.8
Materials and Methods
Studied Population
We studied prospectively 24 patients with epilepsy (16 female, 8 male) presenting with different types of MCD, in whom the diagnosis was previously confirmed by MR imaging. This protocol was approved by the internal review board, and all subjects or their guardians gave written informed consent to be enrolled in this study.
From this group of patients, we selected 16 (10 female, 6 male) with focal MCD. We excluded patients with MCD considered as being diffuse, such as polymicrogyria and band heterotopia. This study encompassed 16 patients, from whom 9 presented with heterotopia (2 with focal subcortical, 5 with periventricular, and 2 with associated periventricular and subcortical heterotopia) and 7 with cortical dysplasia. Ten patients presented with unilateral involvement. Patients’ ages ranged from 10 to 35 years (mean, 22 ± 8 years).
On the day of the MR spectroscopy study, patients were evaluated with prolonged electroencephalography (EEG) or video electroencephalography (V-EEG) to register subclinical or subtle clinical seizures, which could be unnoticed by patients, parents, and/or caretakers. All patients had interictal epileptiform activity, but none of the 16 patients presented with electrographic seizures. Examinations were not performed within 48 hours of the last seizure, except in 4 patients who had daily episodes. This procedure was adopted because of the previous evidence of the presence of a lactate peak in the spectra of patients with MCD who experienced seizures a short time before MR spectroscopy acquisition,9 probably reflecting anaerobic glycolysis during and after seizures.
Control Group
We also studied a control group with the same MR spectroscopy protocol. This group was age-matched to the patients and was composed of 30 healthy volunteers who did not present with any neurologic complaint, 15 male and 15 female, with ages ranging from 13 to 36 years (mean, 25 ± 5 years).
MR Imaging
MR imaging was performed on a 1.5T unit. The protocol included the following sequences: sagittal T1-weighted spin-echo (TR = 366 ms; TE = 14 ms; section thickness, 5 mm), axial inversion-recovery (TR = 2000 ms; TE = 14 ms; TI = 700 ms; section thickness, 5 mm), coronal spoiled gradient-recalled acquisition in steady-state (TR = 27 ms; TE = 6 ms; flip angle, 45°; section thickness, 1.5 mm; gap, 0 mm), coronal fluid-attenuated inversion recovery (TR = 10 002 ms; TE = 150 ms; TI = 2200 ms; section thickness, 4.0 mm), and axial T2-weighted fast spin-echo (TR = 3000 ms; TE = 88 ms; section thickness, 5.0 mm).
MR Spectroscopy
MR spectroscopy protocol included a multivoxel acquisition by using a point-resolved spectroscopy sequence technique with the following parameters: section thickness = 10 mm, TR = 1500 ms, TE = 135 ms, FOV = 24 cm, NEX = 1, and 16 × 16 phase-encoding steps. The MCD were identified and classified on the basis of conventional images of the MR imaging study, and the image that best represented the MCD in the axial T2-weighted sequence was identified. Within this image, a large volume of interest was defined for field homogeneity optimization. The size of this volume of interest varied, depending on the MCD, from 64 to 112 mm in the right-left direction and 35–103 mm in the anteroposterior direction. This larger volume of interest included MCD, surrounding tissues, and the NACS in cases of unilateral involvement. Water-suppressed multivoxel MR spectroscopy of this volume of interest was performed, lasting approximately 6.5 minutes.
As mentioned previously, we also studied a control group with the same MR spectroscopy protocol. In every volunteer, MR spectroscopy was performed from 2 axial sections, 1 at the level of the atrium of the lateral ventricles (labeled as inferior) and the other at the level of centrum semiovale bilaterally (labeled as superior). The size of the large inferior volume of interest varied, depending on the brain size, from 79 to 107 mm in the right-left direction and 50–120 mm in the anteroposterior direction. The superior volume of interest varied from 60 to 87 mm in the right-left direction and 73–118 mm in the anteroposterior direction.
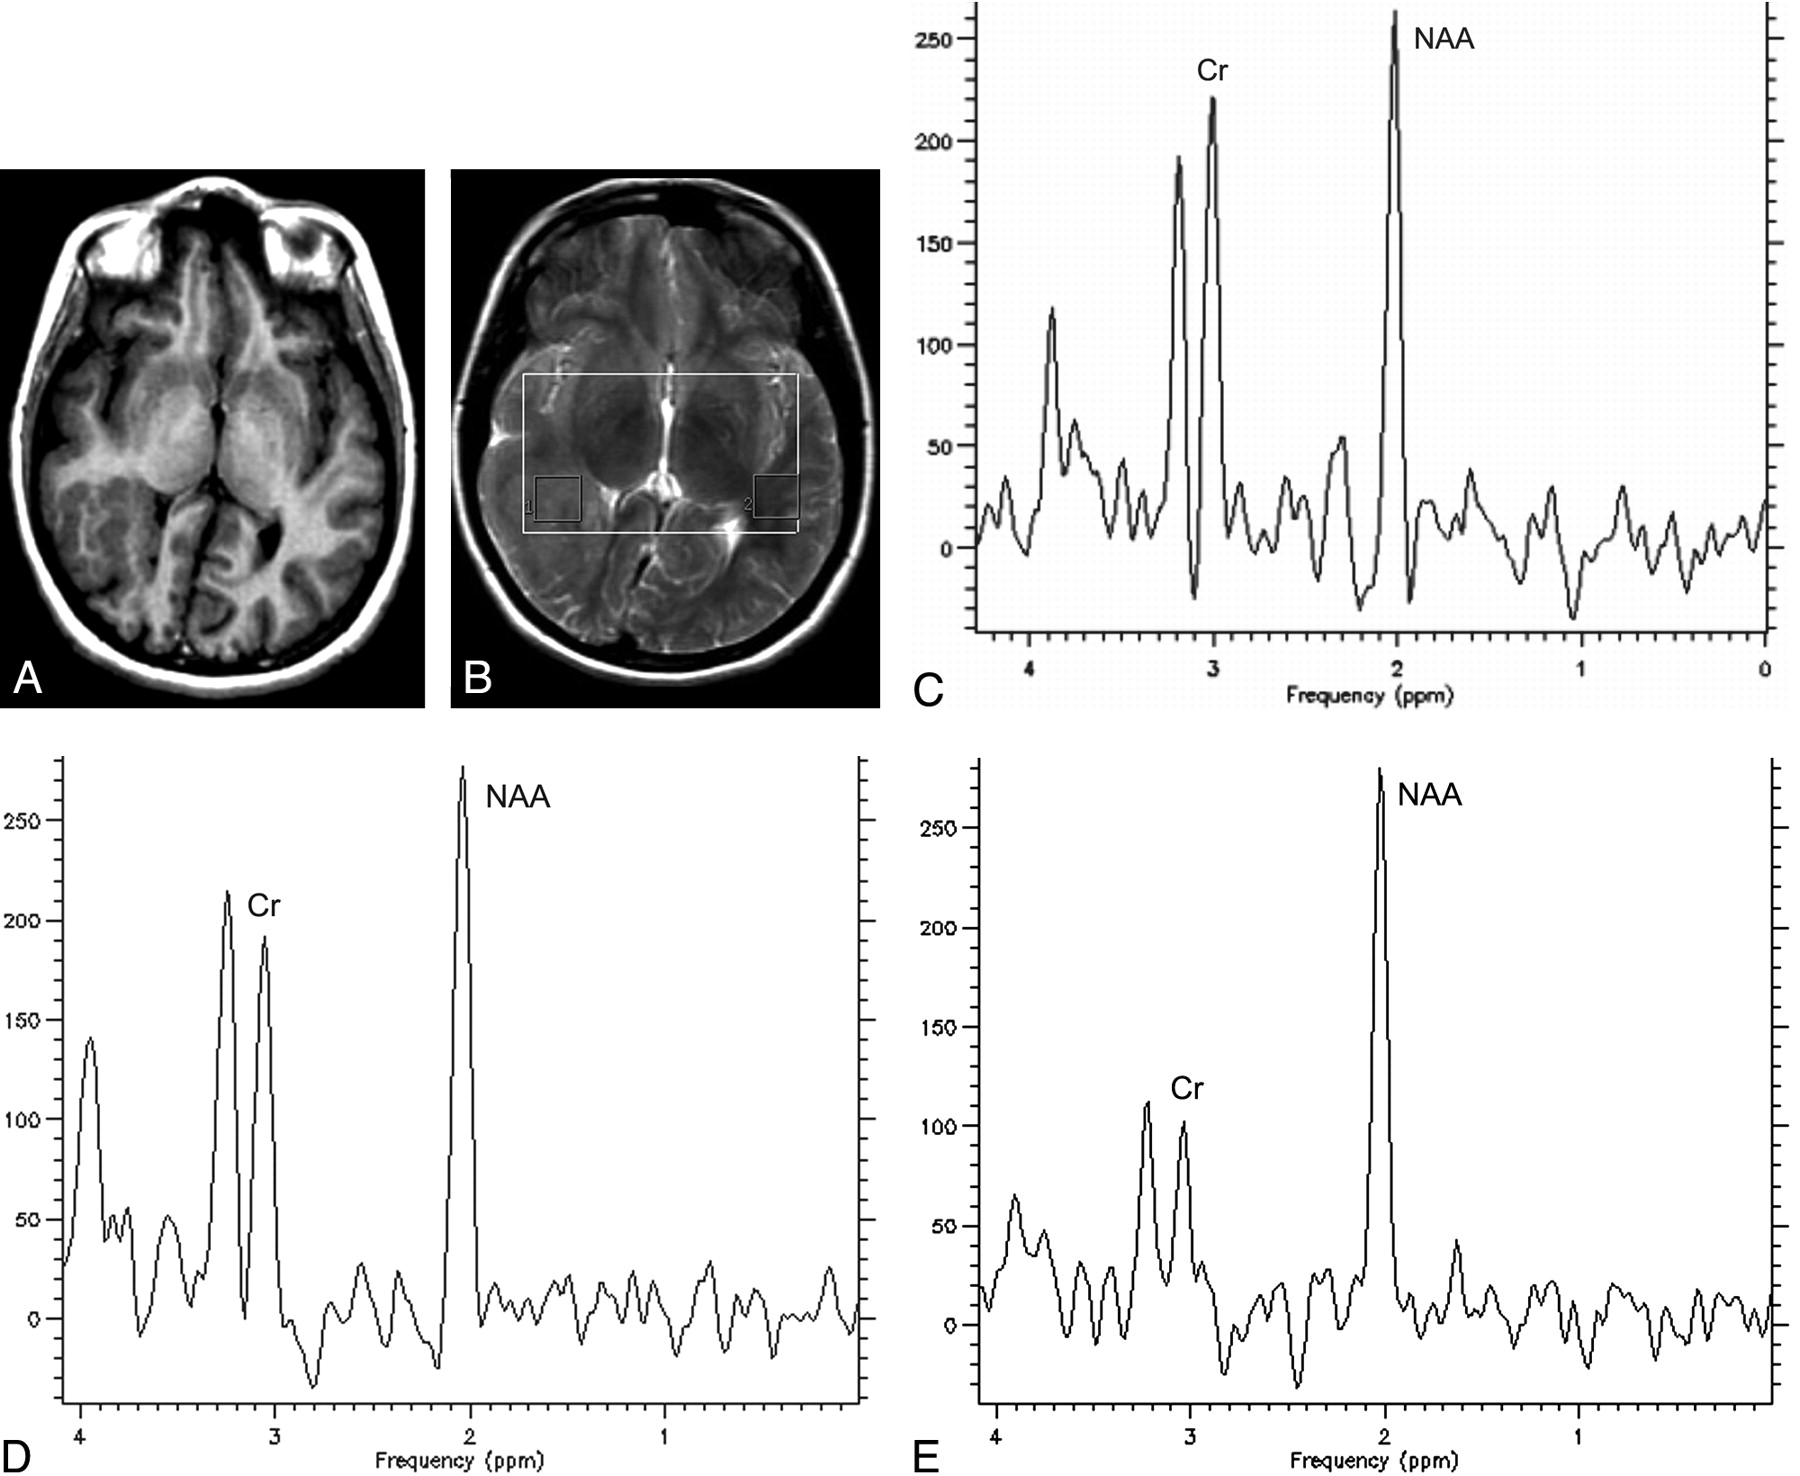
MR spectroscopy raw data were transferred to a workstation (UltraSPARC 60, Sun Microsystems, Santa Clara, Calif) and processed by using the spectroscopy analysis software SAGE (GE Healthcare, Milwaukee, Wis). Postprocessing steps included line broadening of 3 Hz, zero-filling to 1024 points, and automatic baseline and phase correction. Every volume of interest was divided into smaller ones (15 × 15 × 10 mm3), and only some of these smaller volumes of interest were selected for further metabolite quantification. In patients, the smaller volume of interest was centered in the MCD to minimize contamination with normal-appearing tissues. In cases of unilateral involvement, a smaller voxel was also studied in NACS (Fig 1A, -B). Metabolite quantification was performed after fitting the spectral curve, by using the Marquardt-Levenberg method, to 3 Lorentzian lines: N-acetylaspartate (NAA) at 2.02 ppm, creatine (Cr) at 3.03 ppm, and choline (Cho) at 3.23 ppm. NAA/Cr was calculated from the obtained amplitudes values.

Axial inversion-recovery image (A) shows a subcortical heterotopia on the right side. Axial T2-weighted image (B) demonstrates the selected volumes of interest located at the MCD (1) and at the normal-appearing contralateral side (2). MR spectroscopy obtained from the volume of interest centered at the MCD (C) shows a decreased NAA/Cr. D, MR spectroscopy obtained from the NACS. E, MR spectroscopy obtained from the white matter in a control subject.
In the control group, in the 2 large volumes of interest selected for MR spectroscopy (inferior and superior), NAA/Cr was calculated for up to 8 smaller volumes of interest: 4 in the inferior large volume of interest (composed predominantly of periventricular white matter or of gray matter on the left and right side, respectively) (Fig 2A) and 4 in the superior large volume of interest (composed predominantly of white matter or of gray matter on the left and right side, respectively) (Fig 2B). At the level of the lateral ventricles, we studied the parieto-occipital gray and white matter. At the level of the centrum semiovale, we sampled the frontoparietal gray and white matter bilaterally. Hence, the small volumes of interest were classified according to their location as inferior or as superior, according to the predominant composition as gray or white matter, and according to the hemisphere as right or left.

Axial T2-weighted images demonstrate the 4 selected volumes of interest in the inferior level (A) and also in the superior level (B).
Statistical Analysis
Statistical analysis was performed by using the Friedman test for related multigroup samples and the Mann-Whitney test for 2-group samples. A P < .05 was considered significant.
Results
We studied the spectra from 16 volumes of interest including MCD (9 gray matter heterotopias and 7 cortical dysplasias) and also 10 from the NACS.
There was no lactate peak present in the spectra, neither in the patients nor in the control group. NAA/Cr obtained in patients and in the control subjects is summarized in the Table.
NAA/Cr obtained in patients and control group according to their location
Control Group
When studying NAA/Cr by means of the Friedman test, we found no statistically significant differences between the right and left side or between inferior and superior levels, for either white or gray matter volumes of interest (P = .351 and P = .554, respectively). For this reason, from now on we will refer to a unique mean value for gray and white matter, independent of location.
Comparison Between the MCD and the Control Group
We compared the NAA/Cr obtained for MCD areas with the NAA/Cr of the control group for both white and gray matter separately, and we obtained statistically significant differences for both groups (P < .001 and P = .001, respectively) by using the Mann-Whitney test. NAA/Cr was decreased in MCD areas compared with both white and gray matter values in the control group.
Comparison Between the MCD and NACS
In patients, NAA/Cr was slightly lower in MCD compared with NACS (Table), but the difference did not reach statistical significance (P = .114) when using the paired Mann Whitney test.
Comparison Between the NACS and the Control Group
We also compared NACS in patients with that in the control group. NAA/Cr was lower in NACS when compared with white matter (P < .001) and gray matter of the control group (P = .005) by using the Mann-Whitney test (Fig 1C-E).
Discussion
MCD are disruptions of the cortical formation process that occur at different stages of the embryonic life. These interruptions can affect proliferation, migration, and/or organization of neuronal cells. A varied spectrum of neuropathologic changes can be observed in MCD.10 In MCD, epileptogenic activity could be explained by abnormalities in cortical architecture, with consequent abnormal synaptic circuitry and unstable membrane excitability.11 Widespread use of MR imaging allowed recognition of these abnormalities in vivo and their further categorization from a radiologic standpoint.2–4,12–14
MR spectroscopy has been used in patients with intractable temporal lobe epilepsy and demonstrated a reduction in NAA, a marker of neuronal loss or dysfunction, ipsilateral to the side of the seizure focus identified clinically or by using paraclinical studies such as EEG, positron-emission tomography, or single-photon emission CT (SPECT).15–18
NAA is present in high concentration in neurons, but its exact role in the brain is unknown. NAA is considered a marker of neuronal attenuation and viability, and its concentration decreases in response to various types of insults to the brain.5
Previous published studies about MR spectroscopy and MCD are very different in the number of cases and methodologies used.9,19–31 Of these studies, 8 used single-voxel MR spectroscopy and 6 used multivoxel MR spectroscopy. Six are case reports, and in the remaining 8 articles, the number of patients studied varied from 8 to 31. In 11 of these articles, the metabolite ratios obtained in the lesion were compared with those in a control group, and in 9 articles, the NACS was also studied.9,19,20,24–27,29
The abnormality most frequently found in MCD was decreased NAA or NAA/Cr in the lesion compared with a that in the control group,9,20,22–24,27,28,31 in agreement with our results, but some articles reported cases presenting a normal NAA peak in MCD compared with that in a control group.21,29,30 This observation might be explained by the fact that these authors used single-voxel MR spectroscopy with a larger voxel volume size (3–8 cm3) than the one used in our study (2.25 cm3). This larger voxel may be influenced more intensely by partial volume averaging, and that could potentially affect the sensitivity of the method to subtle abnormalities. Mueller et al,31 by using spectroscopic imaging, showed that it is possible to identify metabolically abnormal clusters interspaced in metabolically normal regions in some cases of cortical malformations.
One of the studies29 found reduced NAA/Cr only in cortical dysplasia. An in vitro MR spectroscopy study also showed decreased NAA in surgical biopsies of cortical dysplasias.32 Kuzniecky et al23 studied patients with MCD by using MR spectroscopy with 4.1T equipment and hypothesized that the abnormal metabolic ratios could indicate an immature cellular component because in some cases of focal cortical dysplasia, the number of neurons and glia were not different from that of controls.
Previous MR spectroscopy studies have already demonstrated that a structurally normal-appearing perilesional zone is characterized by metabolic abnormalities, similar to what is observed in MCD.24,28,31 Another study using diffusion anisotropy and diffusivity also demonstrated abnormality beyond the limits of the visualized lesion.33
For focal lesions, a valid strategy is to perform comparisons between the metabolic findings of the lesion spectrum and the contralateral side,8 with the NACS used as a control to detect biochemical abnormalities in the lesion. To verify if we could compare the NAA/Cr of NACS with MCD, we also evaluated NACS in patients presenting unilateral involvement. MR spectroscopy of NACS showed decreased NAA/Cr in comparison with that of the control group and slightly increased NAA/Cr in comparison with that of MCD, but NAA/Cr from NACS and MCD did not show significant statistical differences. In the control group, we evaluated the gray as well as the white matter, whereas the contralateral volumes of interest were composed mainly of white matter. Nine previous studies evaluated, in different ways, the NACS.9,19,20,24–29 However, in only 4 was it compared directly with a control group, and the reported results were not in agreement. Hanefeld et al20 described MR spectroscopy in 2 children with hemimegalencephaly and evaluated the white matter of the contralateral side, which showed reduced NAA in comparison with that of a control group. Preul et al27 described the case of 1 patient with unilateral heterotopia and cortical dysplasia and did not find reduced NAA in NACS compared with that in a control group. Simone et al9 evaluated 11 patients by using single-voxel MR spectroscopy and found no differences for NAA/Cr between NACS and the white matter or gray matter of the control group. Woermann et al28 studied the contralateral white matter of 6 patients with unilateral MCD by using multivoxel spectroscopy and detected reduced NAA/Cr in 4 cases.
As shown previously, literature reports are not in agreement as to whether the NACS shows altered NAA/Cr. We were able to study the NACS in 10 patients and compare it with that of a large group of controls (n = 30), in whom gray and white matter were studied separately. With our data, we contribute to reinforcing the idea that NAA/Cr is in fact decreased in the NACS of MCD. The lack of a statistically significant difference between the lesions and the NACS found in our results suggests that MCD lesions should not be compared with the contralateral side of the same patient because the comparison might prevent the detection of metabolic alterations.
The idea that in MCD, the visible lesion is only the “tip of the iceberg” has been extensively discussed, and indirect evidence from SPECT and EEG studies in unilaterally affected patients supports the hypothesis that the NACS could also be abnormal.13,34 This could explain why surgical resection does not yield good results in the control of epilepsy in some patients with focal MCD, suggesting that the visualized MCD does not constitute the entire epileptogenic zone and that abnormalities can be found also in the perilesional as well as in the contralateral side.35–37 Wieshmann et al,38 by using diffusion tensor imaging, found reduced anisotropy affecting both hemispheres in a patient with unilateral MCD. They hypothesized that there was loss of directional organization in the contralateral white matter. Because our NACS was composed mainly of white matter, our spectroscopic observations of reduced NAA/Cr are in agreement with those of Wieshmann et al, suggesting that there is really some dysfunction at this level. Our findings reinforce the idea that a more widespread metabolic abnormality extends beyond the visualized lesion, suggesting neuronal loss and/or dysfunction in the NACS, corroborating the previous concept.
The abnormality in the contralateral side can also be explained by the fact that because the development of gray and white matter is closely linked, malformations can affect both cortex and the white matter in both hemispheres.
The reliability of MR spectroscopy for revealing abnormalities in normal-appearing brain has been previously demonstrated in other neurologic diseases, such as multiple sclerosis and X-linked adrenoleukodystrophy.39–41 In these progressive neurologic diseases, biochemical alterations may anticipate the presence of structural damage.
A limitation of this study was that we did not perform absolute quantification of metabolite concentrations, which would require too long acquisition times and possibly sedation of patients. Because we chose to use long TE spectroscopy to improve the spectral resolution of peaks, it was not possible to study other short T2 metabolites such as glutamate or myo-inositol, which may provide other insights into the metabolic disturbances of MCD. We did not include ratios with Cho because in an analysis of the control group data (not shown here), we found important differences in the Cho/Cr ratios between the superior and inferior areas. Hence, for comparison purposes of Cho/Cr data between patients and controls, we would need to divide the patient group (n = 16) also into 2 subgroups (inferior and superior), reducing considerably the number of patients for each group, which would also reduce the power of our statistical analysis.
The limited number of each type of MCD examined in this study precluded the detection of possible differences between MCD subtypes. Further studies should be performed to elucidate possible differences between different types of MCD, by using MR spectroscopy with short and long TEs.
Conclusion
Despite the fact that MR imaging has revolutionized the detection of the anatomic abnormalities found in MCD, MR spectroscopy could be an important key to understanding its pathophysiologic role, demonstrating that damage extends beyond the identified lesions on MR imaging, including NACS in cases of unilateral MCD. Although in the literature a commonly used strategy is to compare focal lesions with the normal contralateral side,8 our results indicate that in MCD, the NACS should not be used as a control.
References
- Received September 7, 2006.
- Accepted after revision November 2, 2006.
- Copyright © American Society of Neuroradiology
In this issue


Jump to section
Related Articles
Cited By...
- No citing articles found.