Advertisement

Main menu

  • Home
  • Content
    • Current Issue
    • Accepted Manuscripts
    • Article Preview
    • Past Issue Archive
    • Video Articles
    • AJNR Case Collection
    • Case of the Week Archive
    • Case of the Month Archive
    • Classic Case Archive
  • Special Collections
    • Advancing NeuroMRI with High-Relaxivity Contrast Agents
    • AJNR Awards
    • Low-Field MRI
    • Alzheimer Disease
    • ASNR Foundation Special Collection
    • Photon-Counting CT
    • View All
  • Multimedia
    • AJNR Podcasts
    • AJNR SCANtastic
    • Trainee Corner
    • MRI Safety Corner
    • Imaging Protocols
  • For Authors
    • Submit a Manuscript
    • Submit a Video Article
    • Submit an eLetter to the Editor/Response
    • Manuscript Submission Guidelines
    • Statistical Tips
    • Fast Publishing of Accepted Manuscripts
    • Graphical Abstract Preparation
    • Imaging Protocol Submission
    • Author Policies
  • About Us
    • About AJNR
    • Editorial Board
    • Editorial Board Alumni
  • More
    • Become a Reviewer/Academy of Reviewers
    • Subscribers
    • Permissions
    • Alerts
    • Feedback
    • Advertisers
    • ASNR Home

User menu

  • Alerts
  • Log in

Search

  • Advanced search
American Journal of Neuroradiology

American Journal of Neuroradiology

ASHNR American Society of Functional Neuroradiology ASHNR American Society of Pediatric Neuroradiology ASSR
  • Alerts
  • Log in

Advanced Search

  • Home
  • Content
    • Current Issue
    • Accepted Manuscripts
    • Article Preview
    • Past Issue Archive
    • Video Articles
    • AJNR Case Collection
    • Case of the Week Archive
    • Case of the Month Archive
    • Classic Case Archive
  • Special Collections
    • Advancing NeuroMRI with High-Relaxivity Contrast Agents
    • AJNR Awards
    • Low-Field MRI
    • Alzheimer Disease
    • ASNR Foundation Special Collection
    • Photon-Counting CT
    • View All
  • Multimedia
    • AJNR Podcasts
    • AJNR SCANtastic
    • Trainee Corner
    • MRI Safety Corner
    • Imaging Protocols
  • For Authors
    • Submit a Manuscript
    • Submit a Video Article
    • Submit an eLetter to the Editor/Response
    • Manuscript Submission Guidelines
    • Statistical Tips
    • Fast Publishing of Accepted Manuscripts
    • Graphical Abstract Preparation
    • Imaging Protocol Submission
    • Author Policies
  • About Us
    • About AJNR
    • Editorial Board
    • Editorial Board Alumni
  • More
    • Become a Reviewer/Academy of Reviewers
    • Subscribers
    • Permissions
    • Alerts
    • Feedback
    • Advertisers
    • ASNR Home
  • Follow AJNR on Twitter
  • Visit AJNR on Facebook
  • Follow AJNR on Instagram
  • Join AJNR on LinkedIn
  • RSS Feeds

AJNR Awards, New Junior Editors, and more. Read the latest AJNR updates


Improved Turnaround Times | Median time to first decision: 12 days

Research ArticleFunctional

Are the Local Blood Oxygen Level–Dependent (BOLD) Signals Caused by Neural Stimulation Response Dependent on Global BOLD Signals Induced by Hypercapnia in the Functional MR Imaging Experiment? Experiments of Long-Duration Hypercapnia and Multilevel Carbon Dioxide Concentration

Y.J. Liu, C.J. Juan, C.Y. Chen, C.Y. Wang, M.L. Wu, C.P. Lo, M.C. Chou, T.Y. Huang, H. Chang, C.H. Chu and M.H. Li
American Journal of Neuroradiology June 2007, 28 (6) 1009-1014; DOI: https://doi.org/10.3174/ajnr.A0535
Y.J. Liu
  • Find this author on Google Scholar
  • Find this author on PubMed
  • Search for this author on this site
C.J. Juan
  • Find this author on Google Scholar
  • Find this author on PubMed
  • Search for this author on this site
C.Y. Chen
  • Find this author on Google Scholar
  • Find this author on PubMed
  • Search for this author on this site
C.Y. Wang
  • Find this author on Google Scholar
  • Find this author on PubMed
  • Search for this author on this site
M.L. Wu
  • Find this author on Google Scholar
  • Find this author on PubMed
  • Search for this author on this site
C.P. Lo
  • Find this author on Google Scholar
  • Find this author on PubMed
  • Search for this author on this site
M.C. Chou
  • Find this author on Google Scholar
  • Find this author on PubMed
  • Search for this author on this site
T.Y. Huang
  • Find this author on Google Scholar
  • Find this author on PubMed
  • Search for this author on this site
H. Chang
  • Find this author on Google Scholar
  • Find this author on PubMed
  • Search for this author on this site
C.H. Chu
  • Find this author on Google Scholar
  • Find this author on PubMed
  • Search for this author on this site
M.H. Li
  • Find this author on Google Scholar
  • Find this author on PubMed
  • Search for this author on this site
  • Article
  • Figures & Data
  • Info & Metrics
  • Responses
  • References
  • PDF
Loading

Article Figures & Data

Figures

  • Fig 1.
    • Download figure
    • Open in new tab
    • Download powerpoint
    Fig 1.

    Illustration of the experiment paradigm that simultaneously measures hBOLD and fBOLD. Each experiment consists of 3 phases: prehypercapnic phase (room air), hypercapnic phase (CO2 gas mixtures), and posthypercapnic phase (room air). Boxcar visual stimulation is given 30 seconds after the starting of image acquisition and then throughout the entire experiment session. The example of a 4 OFF–4 ON (5 scans each) design is illustrated within the 2-minute prehypercapnic stage.

  • Fig 2.
    • Download figure
    • Open in new tab
    • Download powerpoint
    Fig 2.

    Signal intensity variations during a single experiment for the illustration of data analysis, with the subject breathing a gas mixture containing 5% CO2. A, Signal intensity of the activated visual cortex consists of both fBOLD and hBOLD components. For the prehypercapnic and posthypercapnic phases, the signals corresponding to the 2 visual stimulation blocks (2 OFF and 2 ON, as indicated in the figure) are used for fBOLD signal intensity analysis. For the hypercapnic phase, the signals of the first OFF-ON cycle and 2 OFF-ON cycles at the end are used to reflect the transient-state response and the steady-state response, respectively. The fBOLD signal intensity change in each phase is calculated by the difference between the average of 2 ON-state signals and the average of 2 OFF-state signals. Only 1 OFF-ON cycle is chosen for transient-state hypercapnia analysis to minimize the influence from hBOLD-induced baseline changes. B, Signal intensity of the brain area near the visual cortex but without showing fBOLD activations consists of the hBOLD component only. The hBOLD signal intensity change is computed as the difference between the average of the last 25 scans in the hypercapnic phase and the average of the last 50 scans.

  • Fig 3.
    • Download figure
    • Open in new tab
    • Download powerpoint
    Fig 3.

    The mean percentage changes of BOLD signals as a function of time for the 6 subjects included in this study. Only 4 curves (room air, 3%, 5%, 7%) are shown for better visualization clarity. A, The signal intensity (SI) response shows the ON-OFF fBOLD pattern in response to the visual stimulation, superimposed on hBOLD changes from hypercapnia. Note the gradual decrease of fBOLD amplitude from early to late hypercapnia that is particularly prominent at high concentrations of CO2 inhalation. Furthermore, steady-state fBOLD signals are seen to decrease with increasing CO2 concentration. Posthypercapnic fBOLD amplitude returns to a level similar to the prehypercapnic phase. Min indicates minutes. B, The hBOLD signal intensity changes positively correlate with the inhaled CO2 concentrations. In addition, the time duration to reach steady-state hBOLD level seems to increase with higher hypercapnic perturbations.

  • Fig 4.
    • Download figure
    • Open in new tab
    • Download powerpoint
    Fig 4.

    Steady-state hBOLD signal intensity changes plotted versus CO2 concentration. There is a tendency for the hBOLD signal intensity change to be positively correlated with the concentration of inhaled CO2.
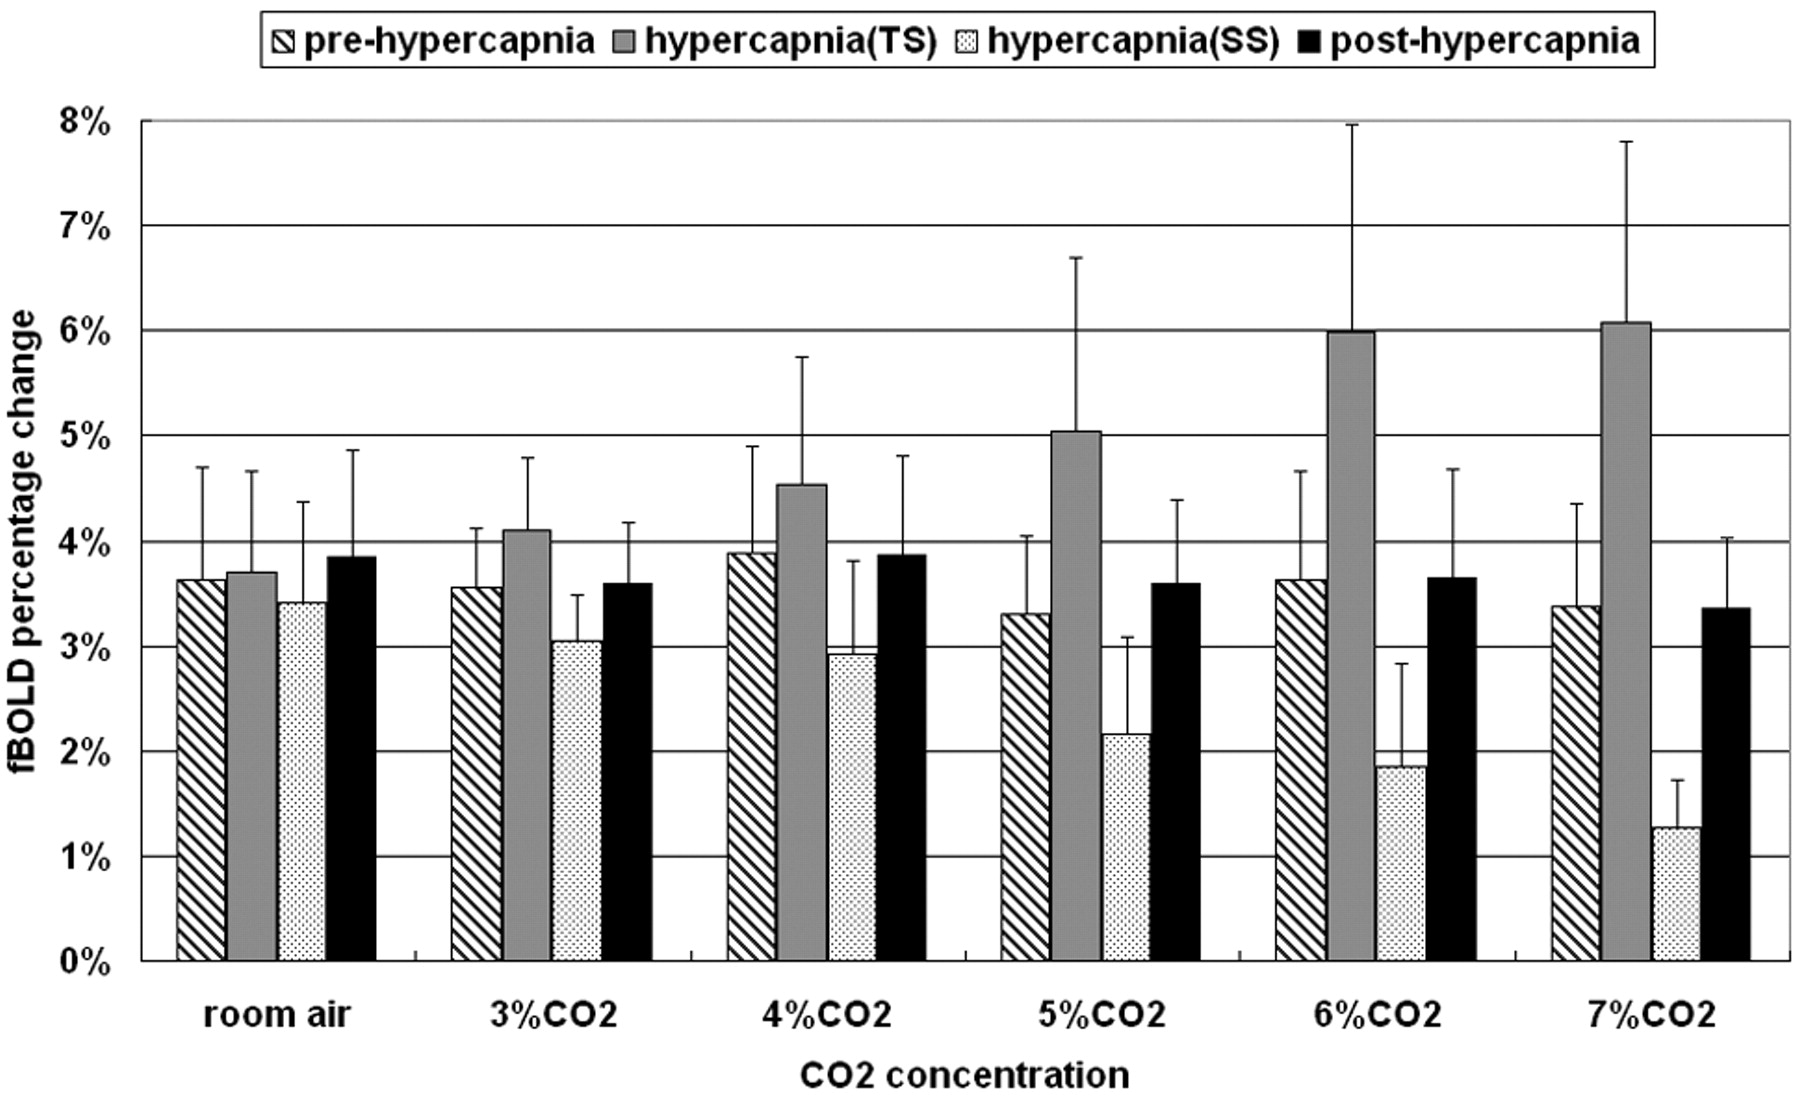
  • Fig 5.
    • Download figure
    • Open in new tab
    • Download powerpoint
    Fig 5.

    Percentage fBOLD signal intensity changes under different CO2 concentrations. The prehypercapnic and posthypercapnic fBOLD remains similar at the level of 3%–4%. During hypercapnia, changes in the fBOLD signals tend to increase in the transient state but step down in the steady state as the CO2 concentration becomes higher. TS indicates transient state; SS, steady state.

PreviousNext
Back to top

In this issue

American Journal of Neuroradiology: 28 (6)
American Journal of Neuroradiology
Vol. 28, Issue 6
June 2007
  • Table of Contents
  • Index by author
Advertisement
Print
Download PDF
Email Article

Thank you for your interest in spreading the word on American Journal of Neuroradiology.

NOTE: We only request your email address so that the person you are recommending the page to knows that you wanted them to see it, and that it is not junk mail. We do not capture any email address.

Enter multiple addresses on separate lines or separate them with commas.
Are the Local Blood Oxygen Level–Dependent (BOLD) Signals Caused by Neural Stimulation Response Dependent on Global BOLD Signals Induced by Hypercapnia in the Functional MR Imaging Experiment? Experiments of Long-Duration Hypercapnia and Multilevel Carbo…
(Your Name) has sent you a message from American Journal of Neuroradiology
(Your Name) thought you would like to see the American Journal of Neuroradiology web site.
CAPTCHA
This question is for testing whether or not you are a human visitor and to prevent automated spam submissions.
Cite this article
Y.J. Liu, C.J. Juan, C.Y. Chen, C.Y. Wang, M.L. Wu, C.P. Lo, M.C. Chou, T.Y. Huang, H. Chang, C.H. Chu, M.H. Li
Are the Local Blood Oxygen Level–Dependent (BOLD) Signals Caused by Neural Stimulation Response Dependent on Global BOLD Signals Induced by Hypercapnia in the Functional MR Imaging Experiment? Experiments of Long-Duration Hypercapnia and Multilevel Carbon Dioxide Concentration
American Journal of Neuroradiology Jun 2007, 28 (6) 1009-1014; DOI: 10.3174/ajnr.A0535

Citation Manager Formats

  • BibTeX
  • Bookends
  • EasyBib
  • EndNote (tagged)
  • EndNote 8 (xml)
  • Medlars
  • Mendeley
  • Papers
  • RefWorks Tagged
  • Ref Manager
  • RIS
  • Zotero
0 Responses
Respond to this article
Share
Bookmark this article
Are the Local Blood Oxygen Level–Dependent (BOLD) Signals Caused by Neural Stimulation Response Dependent on Global BOLD Signals Induced by Hypercapnia in the Functional MR Imaging Experiment? Experiments of Long-Duration Hypercapnia and Multilevel Carbon Dioxide Concentration
Y.J. Liu, C.J. Juan, C.Y. Chen, C.Y. Wang, M.L. Wu, C.P. Lo, M.C. Chou, T.Y. Huang, H. Chang, C.H. Chu, M.H. Li
American Journal of Neuroradiology Jun 2007, 28 (6) 1009-1014; DOI: 10.3174/ajnr.A0535
del.icio.us logo Twitter logo Facebook logo Mendeley logo
  • Tweet Widget
  • Facebook Like
  • Google Plus One
Purchase

Jump to section

  • Article
    • Abstract
    • Materials and Methods
    • Results
    • Discussion
    • Conclusion
    • Acknowledgments
    • Footnotes
    • References
  • Figures & Data
  • Info & Metrics
  • Responses
  • References
  • PDF

Related Articles

  • No related articles found.
  • PubMed
  • Google Scholar

Cited By...

  • No citing articles found.
  • Crossref
  • Google Scholar

This article has not yet been cited by articles in journals that are participating in Crossref Cited-by Linking.

More in this TOC Section

  • Kurtosis and Epileptogenic Tubers: A Pilot Study
  • Glutaric Aciduria Type 1: DK vs. Conventional MRI
  • Multiparametric MRI in PEDS Pontine Glioma
Show more Functional

Similar Articles

Advertisement

Indexed Content

  • Current Issue
  • Accepted Manuscripts
  • Article Preview
  • Past Issues
  • Editorials
  • Editor's Choice
  • Fellows' Journal Club
  • Letters to the Editor
  • Video Articles

Cases

  • Case Collection
  • Archive - Case of the Week
  • Archive - Case of the Month
  • Archive - Classic Case

More from AJNR

  • Trainee Corner
  • Imaging Protocols
  • MRI Safety Corner
  • Book Reviews

Multimedia

  • AJNR Podcasts
  • AJNR Scantastics

Resources

  • Turnaround Time
  • Submit a Manuscript
  • Submit a Video Article
  • Submit an eLetter to the Editor/Response
  • Manuscript Submission Guidelines
  • Statistical Tips
  • Fast Publishing of Accepted Manuscripts
  • Graphical Abstract Preparation
  • Imaging Protocol Submission
  • Evidence-Based Medicine Level Guide
  • Publishing Checklists
  • Author Policies
  • Become a Reviewer/Academy of Reviewers
  • News and Updates

About Us

  • About AJNR
  • Editorial Board
  • Editorial Board Alumni
  • Alerts
  • Permissions
  • Not an AJNR Subscriber? Join Now
  • Advertise with Us
  • Librarian Resources
  • Feedback
  • Terms and Conditions
  • AJNR Editorial Board Alumni

American Society of Neuroradiology

  • Not an ASNR Member? Join Now

© 2025 by the American Society of Neuroradiology All rights, including for text and data mining, AI training, and similar technologies, are reserved.
Print ISSN: 0195-6108 Online ISSN: 1936-959X

Powered by HighWire