Advertisement

Main menu

  • Home
  • Content
    • Current Issue
    • Accepted Manuscripts
    • Article Preview
    • Past Issue Archive
    • Video Articles
    • AJNR Case Collection
    • Case of the Week Archive
    • Case of the Month Archive
    • Classic Case Archive
  • Special Collections
    • Advancing NeuroMRI with High-Relaxivity Contrast Agents
    • AJNR Awards
    • Low-Field MRI
    • Alzheimer Disease
    • ASNR Foundation Special Collection
    • Photon-Counting CT
    • View All
  • Multimedia
    • AJNR Podcasts
    • AJNR SCANtastic
    • Trainee Corner
    • MRI Safety Corner
    • Imaging Protocols
  • For Authors
    • Submit a Manuscript
    • Submit a Video Article
    • Submit an eLetter to the Editor/Response
    • Manuscript Submission Guidelines
    • Statistical Tips
    • Fast Publishing of Accepted Manuscripts
    • Graphical Abstract Preparation
    • Imaging Protocol Submission
    • Author Policies
  • About Us
    • About AJNR
    • Editorial Board
    • Editorial Board Alumni
  • More
    • Become a Reviewer/Academy of Reviewers
    • Subscribers
    • Permissions
    • Alerts
    • Feedback
    • Advertisers
    • ASNR Home

User menu

  • Alerts
  • Log in

Search

  • Advanced search
American Journal of Neuroradiology

American Journal of Neuroradiology

ASHNR American Society of Functional Neuroradiology ASHNR American Society of Pediatric Neuroradiology ASSR
  • Alerts
  • Log in

Advanced Search

  • Home
  • Content
    • Current Issue
    • Accepted Manuscripts
    • Article Preview
    • Past Issue Archive
    • Video Articles
    • AJNR Case Collection
    • Case of the Week Archive
    • Case of the Month Archive
    • Classic Case Archive
  • Special Collections
    • Advancing NeuroMRI with High-Relaxivity Contrast Agents
    • AJNR Awards
    • Low-Field MRI
    • Alzheimer Disease
    • ASNR Foundation Special Collection
    • Photon-Counting CT
    • View All
  • Multimedia
    • AJNR Podcasts
    • AJNR SCANtastic
    • Trainee Corner
    • MRI Safety Corner
    • Imaging Protocols
  • For Authors
    • Submit a Manuscript
    • Submit a Video Article
    • Submit an eLetter to the Editor/Response
    • Manuscript Submission Guidelines
    • Statistical Tips
    • Fast Publishing of Accepted Manuscripts
    • Graphical Abstract Preparation
    • Imaging Protocol Submission
    • Author Policies
  • About Us
    • About AJNR
    • Editorial Board
    • Editorial Board Alumni
  • More
    • Become a Reviewer/Academy of Reviewers
    • Subscribers
    • Permissions
    • Alerts
    • Feedback
    • Advertisers
    • ASNR Home
  • Follow AJNR on Twitter
  • Visit AJNR on Facebook
  • Follow AJNR on Instagram
  • Join AJNR on LinkedIn
  • RSS Feeds

AJNR Awards, New Junior Editors, and more. Read the latest AJNR updates


Improved Turnaround Times | Median time to first decision: 12 days

Research ArticleHead and Neck Imaging

Apparent Diffusion Coefficient Mapping of Salivary Gland Tumors: Prediction of the Benignancy and Malignancy

S. Eida, M. Sumi, N. Sakihama, H. Takahashi and T. Nakamura
American Journal of Neuroradiology January 2007, 28 (1) 116-121;
S. Eida
  • Find this author on Google Scholar
  • Find this author on PubMed
  • Search for this author on this site
M. Sumi
  • Find this author on Google Scholar
  • Find this author on PubMed
  • Search for this author on this site
N. Sakihama
  • Find this author on Google Scholar
  • Find this author on PubMed
  • Search for this author on this site
H. Takahashi
  • Find this author on Google Scholar
  • Find this author on PubMed
  • Search for this author on this site
T. Nakamura
  • Find this author on Google Scholar
  • Find this author on PubMed
  • Search for this author on this site
  • Article
  • Figures & Data
  • Info & Metrics
  • Responses
  • References
  • PDF
Loading

Article Figures & Data

Figures

  • Tables
  • Fig 1.
    • Download figure
    • Open in new tab
    • Download powerpoint
    Fig 1.

    Differences in ADC levels of the parotid, submandibular, and sublingual glands. Graph (box plots) shows ADC levels of parotid (PG), submandibular (SMG), and sublingual (SLG) glands. The horizontal line in each box is a median (50th percentile) of the measured values, the top and bottom of the boxes represent 25th and 75th percentiles, respectively, and whiskers indicate the range from the largest to smallest observed data points within 1.5 interquartile range presented by the box. P, Mann-Whitney U test.

  • Fig 2.
    • Download figure
    • Open in new tab
    • Download powerpoint
    Fig 2.

    A 70-year-old man with pleomorphic adenoma of parotid gland. A, Axial T1-weighted (TR/TE = 426 ms/12 ms) image using 47-mm microscopy coil shows tumor (arrows) with homogeneous architectures and hypointense signals relative to gland.

    B, Axial fat-suppressed T2-weighted (TR/TE = 4677 ms/80 ms) image using microscopy coil shows heterogeneous tumor (arrows).

    C, Axial ADC map shows that tumor (indicated by white contour) contains central high ADC area and peripheral intermediate ADC area.

    D and E, Photomicrographs show area with proliferating tumor cells (D) or large cyst (E). Original magnifications, 20× (D) and 10× (E). Hematoxylin-eosin staining.
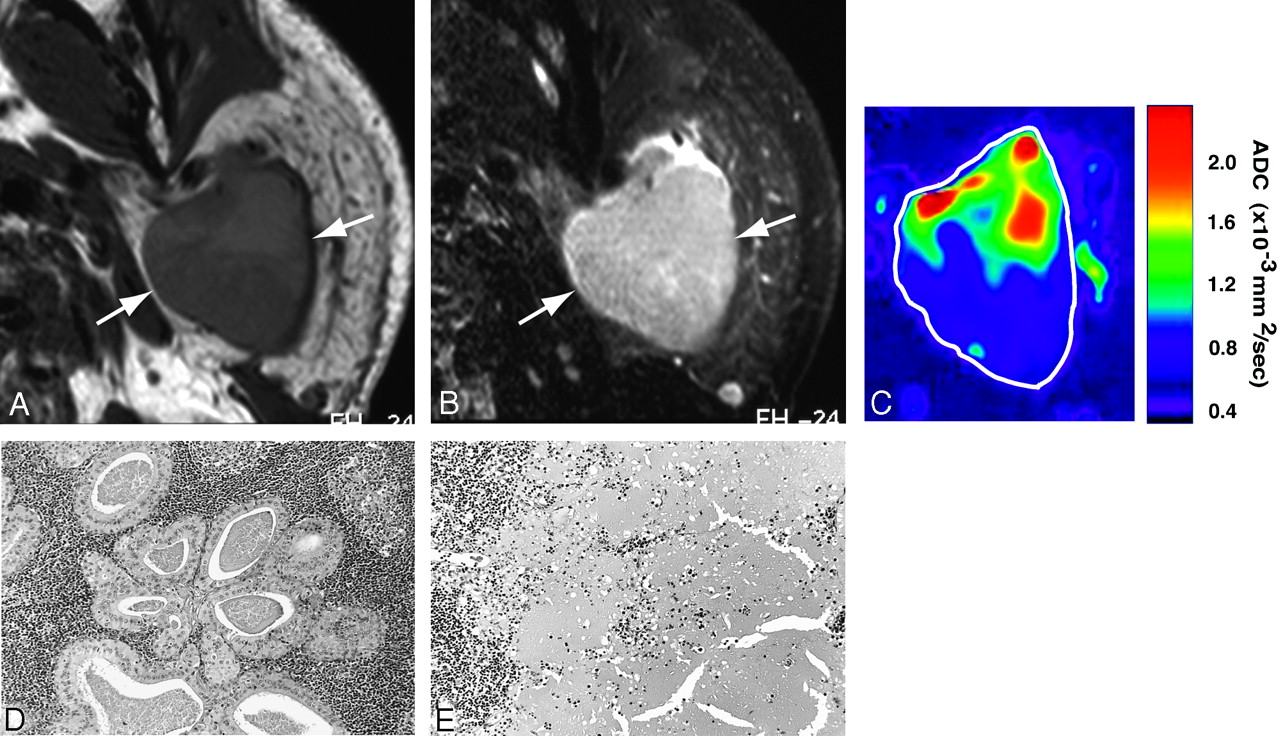
  • Fig 3.
    • Download figure
    • Open in new tab
    • Download powerpoint
    Fig 3.

    A 55-year-old man with Warthin tumor of parotid gland. A, Axial T1-weighted (TR/TE = 426 ms/12 ms) image using 47-mm microscopy coil shows hypointense and homogeneous tumor (arrows).

    B, Axial fat-suppressed T2-weighted (TR/TE = 4677 ms/80 ms) image using 47-mm microscopy coil shows roughly homogeneous tumor (arrow).

    C, Axial ADC map shows high ADC areas in proximal half and low ADC areas in distal half of Warthin tumor.

    D and E, Photomicrographs show lymphoid tumor area (D) and necrotic area (E). Original magnification, 20×. Hematoxylin-eosin staining.

  • Fig 4.
    • Download figure
    • Open in new tab
    • Download powerpoint
    Fig 4.

    A 68-year-old man with mucoepidermoid carcinoma of sublingual gland. A, Axial T1-weighted (TR/TE = 500 ms/15 ms) image using 110-mm surface coil shows homogeneous tumor (arrows) of sublingual gland.

    B, Axial fat-suppressed T2-weighted (TR/TE = 4677 ms/80 ms) image using 110-mm surface coil shows homogeneous tumor (arrows).

    C, Axial ADC map shows that major part of tumor is of low ADCs.

    D and E, Photomicrographs show proliferation of polygonal, clear cancer cells (D) and cancer cell nests in attenuated fibrous connective tissues (E). Original magnifications, 20× (D) and 10× (E). Hematoxylin-eosin staining.

  • Fig 5.
    • Download figure
    • Open in new tab
    • Download powerpoint
    Fig 5.

    A 71-year-old man with adenocarcinoma of submandibular gland. A, Axial T1-weighted (TR/TE = 500 ms/15 ms) image using 110-mm surface coil shows homogeneous tumor (arrows) of submandibular gland.

    B, Axial fat-suppressed T2-weighted (TR/TE = 4677/80) image using surface coil shows slightly heterogeneous tumor (arrows).

    C, Axial ADC map shows speckled pattern of low and high ADCs in tumor.

    D, Photomicrograph shows cancer cells proliferating in loose connective tissues. Original magnification, 20×. Hematoxylin- eosin staining.

  • Fig 6.
    • Download figure
    • Open in new tab
    • Download powerpoint
    Fig 6.

    A 56-year-old woman with malignant lymphoma of parotid gland. A, Axial gadolinium-enhanced fat-suppressed T1-weighted image (TR/TE = 426 ms/12 ms) using 47-mm microscopy coil shows homogeneous lymphoma (arrows) of superficial part of gland.

    B, Axial ADC map shows lymphoma having low ADCs throughout lesion.

    C, Photomicrograph shows lymphoma cell proliferation (B cell, medium-sized cell type) associated with germ center-like structure. Original magnification, 20×. Hematoxylin-eosin staining.

Tables

  • Figures
    • View popup
    Table 1:

    ADC map analysis of salivary gland tumors

    DiagnosisNo. of PatientsADCs (× 10−3 mm2/s)
    Extremely LowLowIntermediateHigh
    Benign2223 ± 2613 ± 1133 ± 2130 ± 23*
        Pleomorphic adenoma11014554
        Warthin tumor105022208
        Papillary cystadenoma1096428
    Malignant936 ± 4141 ± 3220 ± 194 ± 8*
        Mucoepidermoid carcinoma2977140
        Adenoid cystic carcinoma21174133
        Salivary duct carcinoma11064260
        Adenocarcinoma12442323
        Lymphoma298200
        Carcinoma ex pleomorphic adenoma15353822
    • Note:—ADC indicates apparent diffusion coefficient.

      Data are proportions of each of the areas having an indicated ADC level relative to the maximum tumor area on ADC maps and are expressed as means or means ± S.E.

    • * Statistically significant (P < 0.001, Mann-Whitney U test).

    • View popup
    Table 2:

    Predictive ability of ADC criteria for salivary gland tumors

    Diagnostic AbilityCutoff Points of Percentage Area Having High ADCs for the Diagnosis of Malignant Tumors
    <3%<5%<10%<15%
    Sensitivity (%)56898989
    Specificity (%)1001007359
    Accuracy (%)87977768
    PPV (%)100100100100
    NPV (%)85967057
    • Note:—PPV indicates positive predictive value; NPV, negative predictive value.

      On the ADC map image that demonstrates the maximum tumor area of a salivary gland tumor, diagnostic abilities for the diagnosis of malignant tumors were calculated after varying the cutoff point of percentage area having high ADCs (≥1.8 × 10⁻³ mm2/s).

PreviousNext
Back to top

In this issue

American Journal of Neuroradiology: 28 (1)
American Journal of Neuroradiology
Vol. 28, Issue 1
January 2007
  • Table of Contents
  • Index by author
Advertisement
Print
Download PDF
Email Article

Thank you for your interest in spreading the word on American Journal of Neuroradiology.

NOTE: We only request your email address so that the person you are recommending the page to knows that you wanted them to see it, and that it is not junk mail. We do not capture any email address.

Enter multiple addresses on separate lines or separate them with commas.
Apparent Diffusion Coefficient Mapping of Salivary Gland Tumors: Prediction of the Benignancy and Malignancy
(Your Name) has sent you a message from American Journal of Neuroradiology
(Your Name) thought you would like to see the American Journal of Neuroradiology web site.
CAPTCHA
This question is for testing whether or not you are a human visitor and to prevent automated spam submissions.
Cite this article
S. Eida, M. Sumi, N. Sakihama, H. Takahashi, T. Nakamura
Apparent Diffusion Coefficient Mapping of Salivary Gland Tumors: Prediction of the Benignancy and Malignancy
American Journal of Neuroradiology Jan 2007, 28 (1) 116-121;

Citation Manager Formats

  • BibTeX
  • Bookends
  • EasyBib
  • EndNote (tagged)
  • EndNote 8 (xml)
  • Medlars
  • Mendeley
  • Papers
  • RefWorks Tagged
  • Ref Manager
  • RIS
  • Zotero
0 Responses
Respond to this article
Share
Bookmark this article
Apparent Diffusion Coefficient Mapping of Salivary Gland Tumors: Prediction of the Benignancy and Malignancy
S. Eida, M. Sumi, N. Sakihama, H. Takahashi, T. Nakamura
American Journal of Neuroradiology Jan 2007, 28 (1) 116-121;
del.icio.us logo Twitter logo Facebook logo Mendeley logo
  • Tweet Widget
  • Facebook Like
  • Google Plus One

Jump to section

  • Article
    • Abstract
    • Materials and Methods
    • Results
    • Discussion
    • Conclusion
    • References
  • Figures & Data
  • Info & Metrics
  • Responses
  • References
  • PDF

Related Articles

  • No related articles found.
  • PubMed
  • Google Scholar

Cited By...

  • Diffusion weighted magnetic resonance imaging in the diagnosis of parotid masses. Preliminary results
  • Evaluating Instantaneous Perfusion Responses of Parotid Glands to Gustatory Stimulation Using High-Temporal-Resolution Echo-Planar Diffusion-Weighted Imaging
  • Head and Neck Tumors: Assessment of Perfusion-Related Parameters and Diffusion Coefficients Based on the Intravoxel Incoherent Motion Model
  • Biologic Imaging of Head and Neck Cancer: The Present and the Future
  • Efficacy of Diffusion-Weighted Imaging for the Differentiation between Lymphomas and Carcinomas of the Nasopharynx and Oropharynx: Correlations of Apparent Diffusion Coefficients and Histologic Features
  • Multiparametric MR Imaging of Sinonasal Diseases: Time-Signal Intensity Curve- and Apparent Diffusion Coefficient-Based Differentiation between Benign and Malignant Lesions
  • Apparent Diffusion Coefficient Calculated with Relatively High b-Values Correlates with Local Failure of Head and Neck Squamous Cell Carcinoma Treated with Radiotherapy
  • Apparent Diffusion Coefficient Mapping for Sinonasal Diseases: Differentiation of Benign and Malignant Lesions
  • Diagnosing common parotid tumours with magnetic resonance imaging including diffusion-weighted imaging vs fine-needle aspiration cytology: a comparative study
  • Diffusion-Weighted Echo-Planar MR Imaging of Primary Parotid Gland Tumors: Is a Prediction of Different Histologic Subtypes Possible?
  • Crossref
  • Google Scholar

This article has not yet been cited by articles in journals that are participating in Crossref Cited-by Linking.

More in this TOC Section

  • Recommendations for CT to Confirm SSCD
  • Hydrops Herniation into the Semicircular Canals
  • Diagnostic Performance of US in Neck Node NIRADS 2
Show more Head and Neck Imaging

Similar Articles

Advertisement

Indexed Content

  • Current Issue
  • Accepted Manuscripts
  • Article Preview
  • Past Issues
  • Editorials
  • Editor's Choice
  • Fellows' Journal Club
  • Letters to the Editor
  • Video Articles

Cases

  • Case Collection
  • Archive - Case of the Week
  • Archive - Case of the Month
  • Archive - Classic Case

More from AJNR

  • Trainee Corner
  • Imaging Protocols
  • MRI Safety Corner
  • Book Reviews

Multimedia

  • AJNR Podcasts
  • AJNR Scantastics

Resources

  • Turnaround Time
  • Submit a Manuscript
  • Submit a Video Article
  • Submit an eLetter to the Editor/Response
  • Manuscript Submission Guidelines
  • Statistical Tips
  • Fast Publishing of Accepted Manuscripts
  • Graphical Abstract Preparation
  • Imaging Protocol Submission
  • Evidence-Based Medicine Level Guide
  • Publishing Checklists
  • Author Policies
  • Become a Reviewer/Academy of Reviewers
  • News and Updates

About Us

  • About AJNR
  • Editorial Board
  • Editorial Board Alumni
  • Alerts
  • Permissions
  • Not an AJNR Subscriber? Join Now
  • Advertise with Us
  • Librarian Resources
  • Feedback
  • Terms and Conditions
  • AJNR Editorial Board Alumni

American Society of Neuroradiology

  • Not an ASNR Member? Join Now

© 2025 by the American Society of Neuroradiology All rights, including for text and data mining, AI training, and similar technologies, are reserved.
Print ISSN: 0195-6108 Online ISSN: 1936-959X

Powered by HighWire