Advertisement

Main menu

  • Home
  • Content
    • Current Issue
    • Accepted Manuscripts
    • Article Preview
    • Past Issue Archive
    • Video Articles
    • AJNR Case Collection
    • Case of the Week Archive
    • Case of the Month Archive
    • Classic Case Archive
  • Special Collections
    • AJNR Awards
    • Low-Field MRI
    • Alzheimer Disease
    • ASNR Foundation Special Collection
    • Photon-Counting CT
    • View All
  • Multimedia
    • AJNR Podcasts
    • AJNR SCANtastic
    • Trainee Corner
    • MRI Safety Corner
    • Imaging Protocols
  • For Authors
    • Submit a Manuscript
    • Submit a Video Article
    • Submit an eLetter to the Editor/Response
    • Manuscript Submission Guidelines
    • Statistical Tips
    • Fast Publishing of Accepted Manuscripts
    • Graphical Abstract Preparation
    • Imaging Protocol Submission
    • Author Policies
  • About Us
    • About AJNR
    • Editorial Board
    • Editorial Board Alumni
  • More
    • Become a Reviewer/Academy of Reviewers
    • Subscribers
    • Permissions
    • Alerts
    • Feedback
    • Advertisers
    • ASNR Home

User menu

  • Alerts
  • Log in

Search

  • Advanced search
American Journal of Neuroradiology

American Journal of Neuroradiology

ASHNR American Society of Functional Neuroradiology ASHNR American Society of Pediatric Neuroradiology ASSR
  • Alerts
  • Log in

Advanced Search

  • Home
  • Content
    • Current Issue
    • Accepted Manuscripts
    • Article Preview
    • Past Issue Archive
    • Video Articles
    • AJNR Case Collection
    • Case of the Week Archive
    • Case of the Month Archive
    • Classic Case Archive
  • Special Collections
    • AJNR Awards
    • Low-Field MRI
    • Alzheimer Disease
    • ASNR Foundation Special Collection
    • Photon-Counting CT
    • View All
  • Multimedia
    • AJNR Podcasts
    • AJNR SCANtastic
    • Trainee Corner
    • MRI Safety Corner
    • Imaging Protocols
  • For Authors
    • Submit a Manuscript
    • Submit a Video Article
    • Submit an eLetter to the Editor/Response
    • Manuscript Submission Guidelines
    • Statistical Tips
    • Fast Publishing of Accepted Manuscripts
    • Graphical Abstract Preparation
    • Imaging Protocol Submission
    • Author Policies
  • About Us
    • About AJNR
    • Editorial Board
    • Editorial Board Alumni
  • More
    • Become a Reviewer/Academy of Reviewers
    • Subscribers
    • Permissions
    • Alerts
    • Feedback
    • Advertisers
    • ASNR Home
  • Follow AJNR on Twitter
  • Visit AJNR on Facebook
  • Follow AJNR on Instagram
  • Join AJNR on LinkedIn
  • RSS Feeds

AJNR Awards, New Junior Editors, and more. Read the latest AJNR updates

Research ArticleBrain

Comparing Perfusion Metrics Obtained from a Single Compartment Versus Pharmacokinetic Modeling Methods Using Dynamic Susceptibility Contrast-Enhanced Perfusion MR Imaging with Glioma Grade

M. Law, R. Young, J. Babb, M. Rad, T. Sasaki, D. Zagzag and G. Johnson
American Journal of Neuroradiology October 2006, 27 (9) 1975-1982;
M. Law
  • Find this author on Google Scholar
  • Find this author on PubMed
  • Search for this author on this site
R. Young
  • Find this author on Google Scholar
  • Find this author on PubMed
  • Search for this author on this site
J. Babb
  • Find this author on Google Scholar
  • Find this author on PubMed
  • Search for this author on this site
M. Rad
  • Find this author on Google Scholar
  • Find this author on PubMed
  • Search for this author on this site
T. Sasaki
  • Find this author on Google Scholar
  • Find this author on PubMed
  • Search for this author on this site
D. Zagzag
  • Find this author on Google Scholar
  • Find this author on PubMed
  • Search for this author on this site
G. Johnson
  • Find this author on Google Scholar
  • Find this author on PubMed
  • Search for this author on this site
  • Article
  • Figures & Data
  • Info & Metrics
  • Responses
  • References
  • PDF
Loading

Article Figures & Data

Figures

  • Tables
  • Fig 1.
    • Download figure
    • Open in new tab
    • Download powerpoint
    Fig 1.

    The ROC curves associated with the model to diagnose high-grade tumors on the basis of rCBV, rCBV with Ktrans, and Ktrans alone. Diagnostic models based on Ktrans with rCBV and rCBV alone each had significantly higher (P < .01) area under the ROC curve (AUC = 0.94, 0.90, respectively) than did the model based on Ktrans alone (AUC = 0.63). Max indicates maximum.

  • Fig 2.
    • Download figure
    • Open in new tab
    • Download powerpoint
    Fig 2.

    Scatterplot of rCBV versus Ktrans shows true low-grade gliomas as crosses and true high grade gliomas as black points. The figure demonstrates that rCBV and Ktrans together are good predictors of glioma grade. The performance of the diagnostic model to predict high-grade tumors using both Ktrans and Max rCBV when overall diagnostic accuracy is highest (sensitivity = 90.7%, specificity = 76.7%) is shown.

  • Fig 3.
    • Download figure
    • Open in new tab
    • Download powerpoint
    Fig 3.

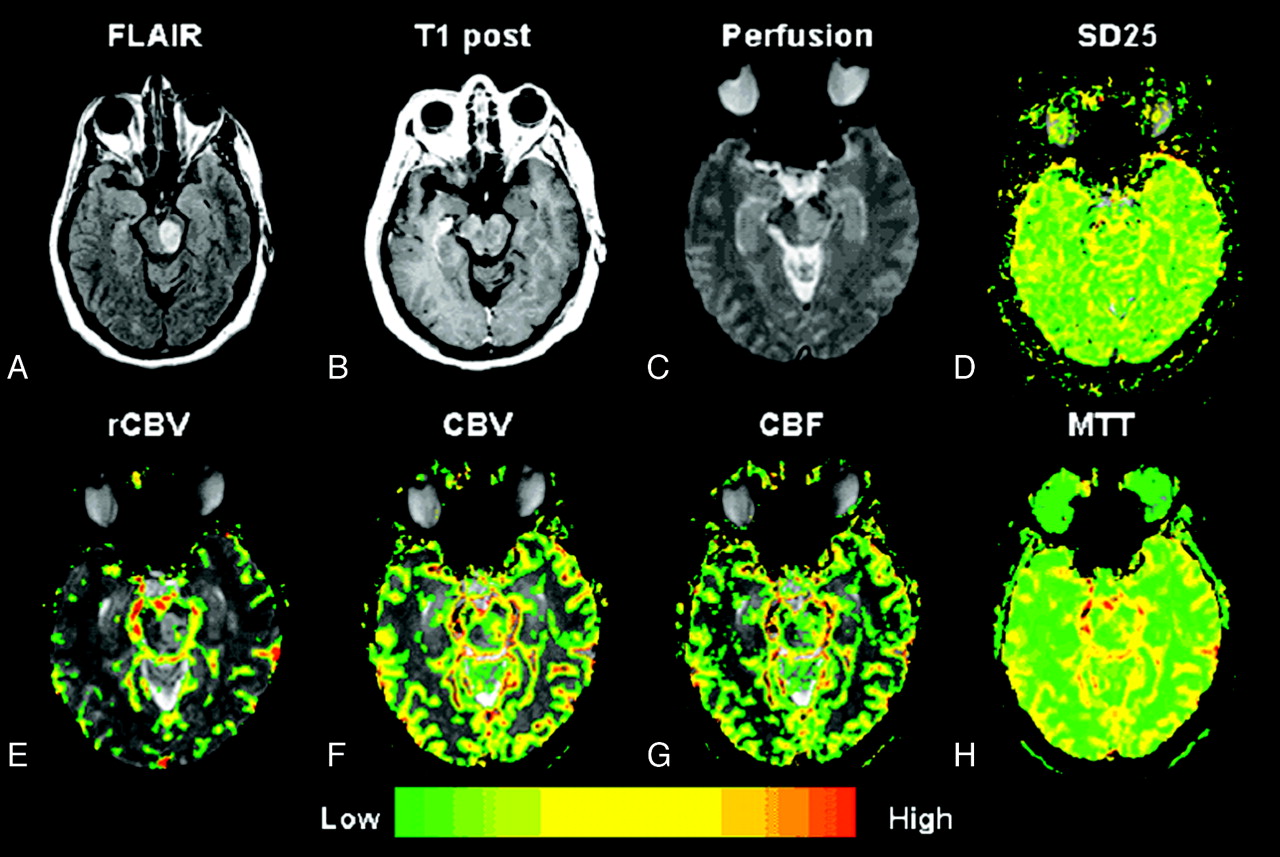
    A–H, Low-grade astrocytoma (grade II/IV). Top row, left to right.

    A, Axial FLAIR image (TR/TE/TI, 9000/110/2500 ms) demonstrates a lesion in the left midbrain with high signal intensity and minor mass effect.

    B, Axial T1-weighted postcontrast image (TR/TE, 600/14 ms; 1 excitation) demonstrates no evidence of contrast enhancement, in keeping with a low-grade astrocytoma.

    C and D, Gradient-echo (TR/TE, 1000/54 ms) axial DSC MR imaging and SD25 color map suggests low permeability throughout the lesion.

    E–G, Bottom row (left to right). rCBV, CBV, and CBF maps demonstrate a few foci of mildly elevated rCBV, CBV, and CBF within the glioma.

    H, MTT map demonstrates some prolongation in MTT within the tumor.

  • Fig 4.
    • Download figure
    • Open in new tab
    • Download powerpoint
    Fig 4.

    A–H, Anaplastic astrocytoma (grade III/IV). Top row, left to right.

    A, Axial FLAIR image (TR/TE/TI, 9000/110/2500 ms) demonstrates a dominant lesion in the right thalamus with extension to the left thalamus and parietooccipital region.

    B, Axial T1-weighted postcontrast image (TR/TE, 600/14 ms; 1 excitation) demonstrates heterogeneous contrast enhancement in keeping with an anaplastic astrocytoma.

    C, Gradient-echo axial DSC MR image (TR/TE, 1000/54 ms).

    D, SD25 color map shows foci of increased permeability throughout the lesion.

    E–G, Bottom row (left to right). rCBV, CBV, and CBF maps demonstrate elevated rCBV, CBV, and CBF within the glioma.

    H, MTT map demonstrates some prolongation in MTT within the tumor.

  • Fig 5.
    • Download figure
    • Open in new tab
    • Download powerpoint
    Fig 5.

    A–H, Glioblastoma multiforme (grade IV/IV). Top row, left to right.

    A, Axial FLAIR image (TR/TE/TI, 9000/110/2500 ms) demonstrates a lesion with surrounding increased signal intensity in the left parietooccipital region.

    B, Axial T1-weighted postcontrast image (TR/TE, 600/14 ms; 1 excitation) demonstrates heterogeneous contrast enhancement in keeping with a glioblastoma multiforme.

    C, Gradient-echo axial DSC MR image (TR/TE, 1000/54 ms).

    D, SD25 color map shows foci of increased permeability anteriorly in the lesion, which appears to “washout” on the axial postcontrast T1-weighted image (arrows), possibly indicating hyperpermeability during the first pass of contrast. The areas of enhancement more posteriorly may reflect more delayed permeability.

    E–G, Bottom row (left to right). rCBV, CBV, and CBF maps demonstrate elevated rCBV, CBV, and CBF within the glioblastoma multiforme.

    H, MTT map demonstrates some prolongation in MTT within the tumor.

Tables

  • Figures
    • View popup
    Table 1:

    Measurements for tumors of each type

    Glioma Grade/TyperCBVVPKtransCBFCBVMTT
    Low-grade glioma1.61 ± 0.80.99 ± 0.70.050 ± 0.0967.37 ± 84.22.95 ± 2.43.02 ± 1.12
    Low-grade ODG2.03 ± 0.91.12 ± 0.50.034 ± 0.06124.05 ± 104.04.43 ± 3.43.21 ± 1.31
    Low: Glioma + ODG1.75 ± 0.91.03 ± 0.70.044 ± 0.0885.66 ± 93.33.43 ± 2.83.08 ± 1.16
    Anaplastic astrocytoma3.69 ± 1.51.30 ± 0.70.167 ± 0.2099.75 ± 37.34.92 ± 2.52.98 ± 0.82
    Glioblastoma multiforme6.06 ± 2.21.86 ± 1.40.234 ± 0.23274.49 ± 430.921.68 ± 62.73.37 ± 1.45
    • Note:—Values are expressed as means ± SD. rCBV indicates maximum relative cerebral blood volume; VP, blood plasma volume; Ktrans, vascular permeability; CBF, absolute cerebral blood flow; CBV, absolute cerebral blood volume; MTT, mean transit time; ODG, oligodendroglioma.

    • View popup
    Table 2:

    P values from an exact Mann-Whitney test for all pairwise comparisons among the tumor grades

    Tumor Grades ComparedrCBVVPKtransCBFCBVMTT
    LG glioma : LG ODG.17.254.381.017.081.909
    LG glioma : ana Astro.0002.115.014.0044.0037.86
    LG glioma : GBM.0001.017.0015.0001.0001.439
    LG ODG : ana Astro.0033.637.019.941.388.98
    LG ODG : GBM.0001.204.0036.027.0013.777
    Ana Astro : GBM.0009.438.291.0027.0009.563
    • Note:—LG indicates low grade; ODG, oligodendroglioma; ana astro, anaplastic astrocytoma; GBM, glioblastoma multiforme; rCBV, maximum relative cerebral blood volume; VP, blood plasma volume; Ktrans, vascular permeability; CBF, absolute cerebral blood flow; CBV, absolute cerebral blood volume; MTT, mean transit time. Significant P values are in bold face type.

    • View popup
    Table 3:

    Spearman rank correlation coefficients with P values

    rCBVVPKtransCBFCBVMTT
    Correlation0.812370.301730.457630.677680.604170.08954
    P value<.0001.009<.0001<.0001<.0001.448
    • Note:—rCBV denotes maximum relative cerebral blood volume; VP, blood plasma volume; Ktrans, vascular permeability; CBF, absolute cerebral blood flow; CBV, absolute cerebral blood volume; MTT, mean transit time.

    • View popup
    Table 4:

    Selected combinations of sensitivity and specificity achieved (corresponding to points on the receiver operating characteristic curve) on the basis of diagnostic models using Ktrans and rCBV when considered alone and in combination

    rCBV and KtransrCBVKtrans
    Sensitivity (%)Specificity (%)Sensitivity (%)Specificity (%)Sensitivity (%)Specificity (%)
    100.033.3100.046.7100.00.0
    97.760.097.766.772.140.0
    95.366.795.370.062.866.7
    90.776.788.476.760.570.0
    81.483.386.083.332.686.7
    72.193.383.793.330.290.0
    62.896.774.496.725.693.3
    16.3100.069.8100.02.3100.0
    • Note:—rCBV indicates maximum relative cerebral blood volume; Ktrans, vascular permeability.

PreviousNext
Back to top

In this issue

American Journal of Neuroradiology: 27 (9)
American Journal of Neuroradiology
Vol. 27, Issue 9
October 2006
  • Table of Contents
  • Index by author
Advertisement
Print
Download PDF
Email Article

Thank you for your interest in spreading the word on American Journal of Neuroradiology.

NOTE: We only request your email address so that the person you are recommending the page to knows that you wanted them to see it, and that it is not junk mail. We do not capture any email address.

Enter multiple addresses on separate lines or separate them with commas.
Comparing Perfusion Metrics Obtained from a Single Compartment Versus Pharmacokinetic Modeling Methods Using Dynamic Susceptibility Contrast-Enhanced Perfusion MR Imaging with Glioma Grade
(Your Name) has sent you a message from American Journal of Neuroradiology
(Your Name) thought you would like to see the American Journal of Neuroradiology web site.
CAPTCHA
This question is for testing whether or not you are a human visitor and to prevent automated spam submissions.
Cite this article
M. Law, R. Young, J. Babb, M. Rad, T. Sasaki, D. Zagzag, G. Johnson
Comparing Perfusion Metrics Obtained from a Single Compartment Versus Pharmacokinetic Modeling Methods Using Dynamic Susceptibility Contrast-Enhanced Perfusion MR Imaging with Glioma Grade
American Journal of Neuroradiology Oct 2006, 27 (9) 1975-1982;

Citation Manager Formats

  • BibTeX
  • Bookends
  • EasyBib
  • EndNote (tagged)
  • EndNote 8 (xml)
  • Medlars
  • Mendeley
  • Papers
  • RefWorks Tagged
  • Ref Manager
  • RIS
  • Zotero
0 Responses
Respond to this article
Share
Bookmark this article
Comparing Perfusion Metrics Obtained from a Single Compartment Versus Pharmacokinetic Modeling Methods Using Dynamic Susceptibility Contrast-Enhanced Perfusion MR Imaging with Glioma Grade
M. Law, R. Young, J. Babb, M. Rad, T. Sasaki, D. Zagzag, G. Johnson
American Journal of Neuroradiology Oct 2006, 27 (9) 1975-1982;
del.icio.us logo Twitter logo Facebook logo Mendeley logo
  • Tweet Widget
  • Facebook Like
  • Google Plus One

Jump to section

  • Article
    • Abstract
    • Methods
    • Results
    • Discussion
    • Conclusion
    • Footnotes
    • References
  • Figures & Data
  • Info & Metrics
  • Responses
  • References
  • PDF

Related Articles

  • No related articles found.
  • PubMed
  • Google Scholar

Cited By...

  • Discrimination between Glioma Grades II and III Using Dynamic Susceptibility Perfusion MRI: A Meta-Analysis
  • Mitotic Activity in Glioblastoma Correlates with Estimated Extravascular Extracellular Space Derived from Dynamic Contrast-Enhanced MR Imaging
  • Impact of Software Modeling on the Accuracy of Perfusion MRI in Glioma
  • Advanced Magnetic Resonance Imaging of the Physical Processes in Human Glioblastoma
  • Exploratory Evaluation of MR Permeability with 18F-FDG PET Mapping in Pediatric Brain Tumors: A Report from the Pediatric Brain Tumor Consortium
  • Imaging biomarkers of angiogenesis and the microvascular environment in cerebral tumours
  • Relative Cerebral Blood Volume Values to Differentiate High-Grade Glioma Recurrence from Posttreatment Radiation Effect: Direct Correlation between Image-Guided Tissue Histopathology and Localized Dynamic Susceptibility-Weighted Contrast-Enhanced Perfusion MR Imaging Measurements
  • The Blood Oxygen Level-Dependent Functional MR Imaging Signal Can Be Used to Identify Brain Tumors and Distinguish Them from Normal Tissue
  • Crossref
  • Google Scholar

This article has not yet been cited by articles in journals that are participating in Crossref Cited-by Linking.

More in this TOC Section

  • Evaluating the Effects of White Matter Multiple Sclerosis Lesions on the Volume Estimation of 6 Brain Tissue Segmentation Methods
  • Quiet PROPELLER MRI Techniques Match the Quality of Conventional PROPELLER Brain Imaging Techniques
  • Predictors of Reperfusion in Patients with Acute Ischemic Stroke
Show more Brain

Similar Articles

Advertisement

Indexed Content

  • Current Issue
  • Accepted Manuscripts
  • Article Preview
  • Past Issues
  • Editorials
  • Editor's Choice
  • Fellows' Journal Club
  • Letters to the Editor
  • Video Articles

Cases

  • Case Collection
  • Archive - Case of the Week
  • Archive - Case of the Month
  • Archive - Classic Case

More from AJNR

  • Trainee Corner
  • Imaging Protocols
  • MRI Safety Corner
  • Book Reviews

Multimedia

  • AJNR Podcasts
  • AJNR Scantastics

Resources

  • Turnaround Time
  • Submit a Manuscript
  • Submit a Video Article
  • Submit an eLetter to the Editor/Response
  • Manuscript Submission Guidelines
  • Statistical Tips
  • Fast Publishing of Accepted Manuscripts
  • Graphical Abstract Preparation
  • Imaging Protocol Submission
  • Evidence-Based Medicine Level Guide
  • Publishing Checklists
  • Author Policies
  • Become a Reviewer/Academy of Reviewers
  • News and Updates

About Us

  • About AJNR
  • Editorial Board
  • Editorial Board Alumni
  • Alerts
  • Permissions
  • Not an AJNR Subscriber? Join Now
  • Advertise with Us
  • Librarian Resources
  • Feedback
  • Terms and Conditions
  • AJNR Editorial Board Alumni

American Society of Neuroradiology

  • Not an ASNR Member? Join Now

© 2025 by the American Society of Neuroradiology All rights, including for text and data mining, AI training, and similar technologies, are reserved.
Print ISSN: 0195-6108 Online ISSN: 1936-959X

Powered by HighWire