
Abstract
BACKGROUND AND PURPOSE: On diffusion-weighted imaging (DWI), metastatic tumors of the brain may exhibit different signal intensities (SI) depending on their histology and cellularity. The purpose of our study was to verify the hypotheses (1) that SI on DWI predict the histology of metastases and (2) that apparent diffusion coefficient (ADC) values reflect tumor cellularity.
MATERIALS AND METHODS: We assessed conventional MR images, DWI, and ADC maps of 26 metastatic brain lesions from 26 patients, 13 of whom underwent surgery after the MR examination. Two radiologists performed qualitative assessment by consensus of the SI on DWI in areas corresponding to their enhancing portions. We measured the contrast-to-noise ratio (CNR) on T2-weighted images and normalized ADC (nADC) values, and compared them with tumor cellularity.
RESULTS: The mean SI on DWI and the CNR on T2-weighted images were significantly lower in well differentiated than in poorly differentiated adenocarcinomas and lesions other than adenocarcinoma. The mean nADC value was significantly higher in well differentiated than poorly differentiated adenocarcinomas and lesions other than adenocarcinoma. All 3 small-cell carcinomas and 1 large-cell neuroendocrine carcinoma exhibited high SI on DWI. The nADC value showed a significant inverse correlation with tumor cellularity. There was no significant correlation between the CNR and tumor cellularity.
CONCLUSION: The SI on DWI may predict the histology of metastases; well differentiated adenocarcinomas tended to be hypointense, and small- and large-cell neuroendocrine carcinomas showed hyperintensity. Their ADC values reflect tumor cellularity.
The estimated annual incidence of central nervous system (CNS) metastasis is approximately 8.3 per 100,000 per year, similar to the reported incidence of new primary brain neoplasms.1 Although metastatic tumors of the brain can usually be diagnosed with the patient’s clinical information and imaging studies, some metastatic brain lesions cannot be differentiated from high-grade glioma, lymphoma, abscess, tumefactive multiple sclerosis, and subacute infarction on conventional MR imaging.2
On conventional MR imaging, the histology of metastatic tumors of the brain may affect their signal intensity (SI).3,4 In addition, their components (ie, solid tumor, degeneration, hemorrhage, and cyst) manifest various SIs on MR imaging. On diffusion-weighted imaging (DWI), different SIs for these tumors have been reported.5-10 These tumors can mimic brain abscesses or early brain infarction on DWI.6,10 For an interpretation of the SI of brain metastasis on DWI, an understanding of its background is required.
Although SI on DWI of the solid portion of brain metastases may be associated with their histology and tumor cellularity, these relationships remain to be investigated systematically. The hypotheses in our study were (1) that SI on DWI predicts the histology of metastases and (2) that apparent diffusion coefficient (ADC) values reflect tumor cellularity. The purpose of our study was to verify these hypotheses using the MR imaging data of our institution and neurosurgically confirmed histologic results.
Materials and Methods
Subjects
Among 21,600 consecutive patients who underwent MR imaging examination in our institution between January 1999 and January 2005, 2280 patients were imaged to rule out brain metastasis. Of these, 285 patients with MR imaging findings of suspected brain metastasis were identified in the MR imaging data base. DWI was not routinely performed for all patients with clinically suspected brain metastasis. We performed DWI in patients who had a large T2 prolonged lesion or solitary mass in the brain. Thus, 58 of 285 patients underwent conventional MR imaging and DWI. We excluded 32 patients with the following conditions: MR imaging evidence of intratumoral hemorrhage (n = 14), previous treatment of chemotherapy, radiation therapy, or biopsy for brain lesions before data acquisition (n = 8), histologically identified primary brain tumors (n = 3), no definite histologic diagnosis of extra-CNS malignant lesions (n = 3), no availability for review of digital data from conventional MR imaging and DWI (n = 2), and microscopic hemorrhage in cases with available histologic specimens of the brain lesions (n = 2). Our institutional review board approved this study, and written informed consent was obtained for MR examination.
MR Imaging
All MR imaging scans were obtained with a 1.5T superconducting system (Magnetom Vision; Siemens, Erlangen, Germany). Conventional MR imaging and DWI were acquired during the same procedure. Conventional MR imaging study consisted of a sagittal T1-weighted localizing sequence (repetition time [TR]/echo time [TE]/excitations, 15/6/1), and axial T1-weighted (670/14/1), fast spin-echo T2-weighted (TR/TEeff/excitation, 3500/96/2; echo-train length, 7), and fluid-attenuated inversion recovery (FLAIR) (TR/TEeff/inversion time, 6000/120/2000; echo-train length, 17) sequences, and triplanar contrast-enhanced T1-weighted sequences. The T1-weighted, T2-weighted, and FLAIR sequences were acquired at a section thickness of 5 mm with a 1-mm intersection gap, a 256 × 256–512 matrix, and a 22-cm field of view (FOV).
DWI was performed in the transverse plane using a spin-echo, echo-planar imaging sequence with the following parameters: TR/TE/inversion time, 12000/100/2200; diffusion gradient encoding in 3 orthogonal directions; b = 1000 s/mm2; FOV, 220 mm; matrix size, 128 × 128 pixels; section thickness, 5 mm; section gap, 1 mm; and number of signals acquired, 1. DWI scans were performed before contrast-enhanced T1-weighted imaging.
The ADC values were calculated as follows: ADC = −[ln(S/S0)]/b, where S is the SI of the region of interest (ROI) obtained through 3 orthogonally oriented DWIs or diffusion trace images, S0 is the SI of the ROI acquired through reference T2-weighted images, and b is the gradient b factor with a value of 1000 smm2. ADC maps were calculated on a pixel-by-pixel basis.
Image Evaluation
Qualitative assessment of the SI on DWI in areas corresponding to the enhanced portion of the lesions on contrast-enhanced T1-weighted images was performed by the consensus of 2 experienced neuroradiologists who were blinded to the clinical and pathologic information. In cases with multiple lesions, the largest lesion was selected for evaluation. The SI of the lesions was described with the use of a 5-point scale: −2, hypointense relative to the normal-appearing white matter; −1, isointense relative to the normal-appearing white matter; 0, isointense relative to the normal-appearing cortical gray matter; +1, slightly hyperintense relative to the normal-appearing cortical gray matter; and +2, hyperintense relative to the normal-appearing cortical gray matter.
On T2-weighted images and ADC maps of areas corresponding to the enhancing portion of the lesions on contrast-enhanced T1-weighted images, 5 uniform ROIs consisting of more than 20 pixels were manually drawn by an experienced radiologist to obtain the SI on T2-weighted images and the ADC values. The ROIs were carefully placed on the solid portion to avoid volume averaging with cystic or degenerative regions that might influence the quantitative data. The mean of the 5 ROI measurements was recorded as a representative value for each case. The same method was applied to a corresponding site in the contralateral white matter judged as normal on both contrast-enhanced T1- and T2-weighted images. On T2-weighted images, image noise measurement was performed by recording the SD of the SI within a ROI outside the head (ie, in air). The contrast-to-noise ratio (CNR) for T2-weighted images was calculated as follows: CNR = (SIt − SIc)/SDnoise, where SIt is the SI of the tumor, SIc is the SI of the contralateral white matter, and SDnoise is the SD of the SI of air. The normalized ADC (nADC) ratio was calculated as the ratio of the mean ADC of the tumor divided by the mean ADC of the corresponding contralateral area.
Tumor cellularity (nuclear attenuation), analyzed with NIH Image software (version 1.0.0.1) on a Windows computer, was defined as the total area of nuclei of tumor cells divided by the area of the histologic section (original magnification, 200×). One radiologist (S.M.) measured nuclear attenuation of the representative area 3 times in each specimen. A mean value of the measurements for each lesion was used as the representative value for each case.
Statistical Analysis
We performed statistical analyses of the qualitative and quantitative evaluation for all brain lesions and histologically confirmed brain lesions. For qualitative analysis, we performed Mann-Whitney U tests to assess the differences in the SI on DWI between well differentiated and poorly differentiated adenocarcinomas, between well differentiated adenocarcinomas and tumors with different histologic results, and between poorly differentiated adenocarcinomas and tumors with different histologic results.
In our quantitative analysis of the CNR and the nADC value, we performed unpaired t tests to assess differences between the well differentiated and poorly differentiated adenocarcinomas, between well differentiated adenocarcinomas and tumors with different histologic results, and between poorly differentiated adenocarcinomas and tumors with a different histologic results. We used the Pearson correlation tests to evaluate the correlation between tumor cellularity and the nADC value, and between tumor cellularity and the CNR on T2-weighted images. A P value of less than 0.05 was considered to indicate a statistically significant difference.
Results
A total of 26 patients, 15 men and 11 women ranging in age from 26 to 81 years (mean, 57.9 years), were included. Of these, 13 patients underwent surgical resection of the brain tumors after MR imaging study. The 13 patients were 8 men and 5 women ranging in age from 26 to 73 years (mean, 57 years). The summary of these lesions is shown on Tables 1 and 2. Because serous adenocarcinomas are considered to be well differentiated adenocarcinomas, we classified 2 serous adenocarcinomas from the ovary and uterus as well differentiated adenocarcinomas. All adenocarcinomas except these 2 derived from the lung. The interval between DWI study and surgery ranged from 0 to 7 (mean ± SD, 3.3 ± 2.4) days in the 13 operated patients.
Summary of 26 primary malignant lesions
Summary of 13 operated brain lesions
Figure 1 shows the comparison of the SI on DWI for all 26 metastatic tumors categorized according to their histology. Of the 6 well differentiated adenocarcinomas, 3 were grade −1, 2 were grade −2, and 1 was grade 0; 4 of 6 poorly differentiated adenocarcinomas were grade +1, and the other 2 were grade 0 (Figs 2 and 3). The mean SI on DWI was significantly lower in well differentiated than in poorly differentiated adenocarcinomas (P = .0065) and lesions other than adenocarcinoma (P = .0017) (Figs 2 and 3). There was no statistically significant difference for the mean SI between poorly differentiated adenocarcinomas and lesions other than adenocarcinoma (P = .46). All 3 small cell carcinomas and a large cell neuroendocrine carcinoma were ranked as grade +2 (Figs 4 and 5), a malignant melanoma as grade −1, and other tumors as grade 0 or +1.

Comparison of the signal intensity of 26 metastatic brain tumors on diffusion-weighted images. All 6 well differentiated adenocarcinomas (Well diff. AC) were classified as grade −2, −1, or 0. All 3 small-cell carcinomas (Small cell ca.) and 1 large-cell neuroendocrine carcinoma (LCNC) were graded as +2. A malignant melanoma was grade −1; all other tumors were grade 0 or +1. Poorly diff. AC, indicates poorly differentiated adenocarcinomas; Large cell ca., large cell carcinoma; SCC, squamous cell carcinoma; Papillotubular ca., papillotubular carcinoma; Mucoepidermoid ca., mucoepidermoid carcinoma; Mod. diff. AC, moderately differentiated adenocarcinoma. The signal intensity was graded on a point scale: −2 = hypointense relative to the normal-appearing white matter; −1 = isointense relative to the normal-appearing white matter; 0 = isointense relative to the normal-appearing cortical gray matter; +1 = slightly hyperintense relative to the normal-appearing cortical gray matter; and +2 = hyperintense relative to the normal-appearing cortical gray matter.

A 67-year-old man with a well differentiated adenocarcinoma from the lung.
A, T2-weighted fast spin-echo image shows a parietotemporal lesion (arrow) near the trigone of the left lateral ventricle. It is hypointense relative to the normal-appearing white matter. The CNR of the solid lesion was 12.
B, On contract-enhanced T1-weighted image, the lesion is enhanced (arrow).
C, On DWI, the lesion is hypointense relative to the normal-appearing white matter (arrow). It was graded as −2.
D, On ADC map, the nADC of the lesion was calculated as 1.95.
E, Photomicrograph of the specimen (hematoxylin-eosin stain; original magnification, 40×) shows a well-differentiated acinar structure. Tumor cellularity was calculated as 0.179.

A 41-year-old man with a poorly differentiated adenocarcinoma from the lung.
A, T2-weighted fast spin-echo image shows a left parietal subcortical lesion (arrow). It is slightly hyperintense relative to the normal-appearing white matter. The CNR of the solid lesion was 32.
B, On contract-enhanced T1-weighted image, the lesion is well enhanced (arrow).
C, On DWI, the lesion is slightly hyperintense relative to the normal-appearing cortical gray matter (arrow). It was graded as +1.
D, On ADC map, the nADC of the lesion was calculated as 1.45.
E, Photomicrograph of the specimen (hematoxylin-eosin stain; original magnification, 40×) shows higher cellularity than Fig 2E. Tumor cellularity was calculated as 0.334.

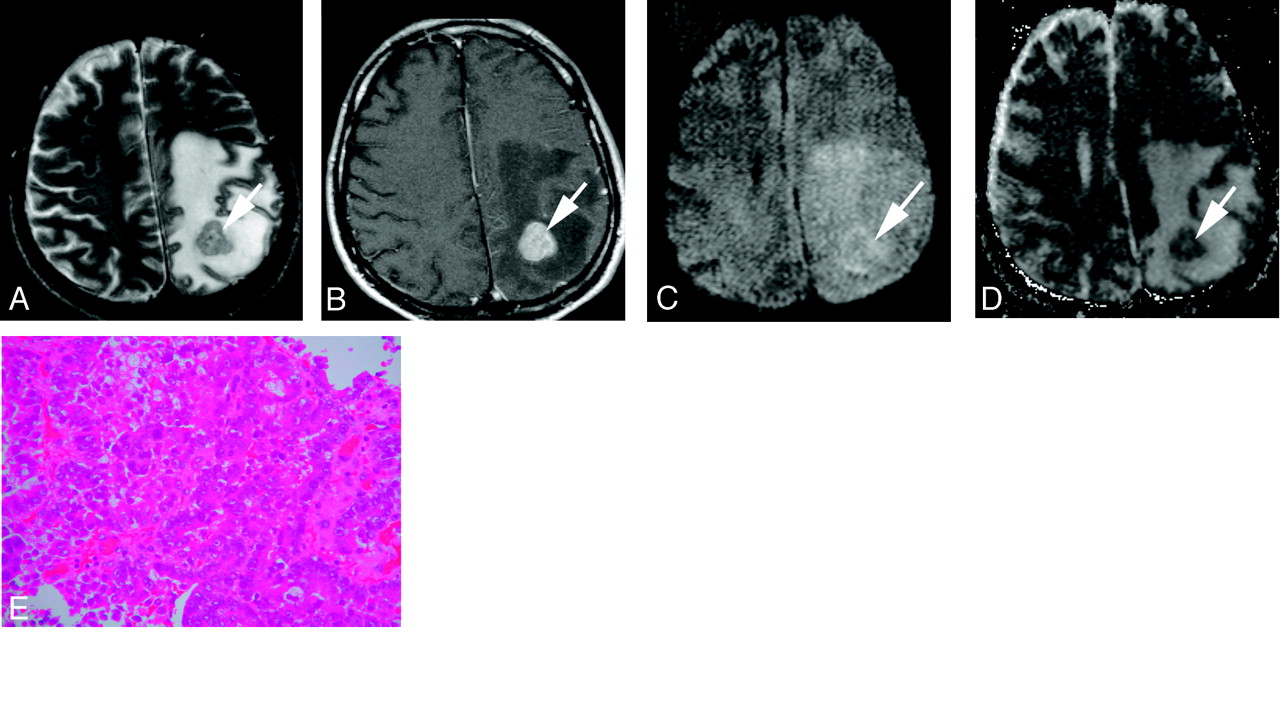
A 69-year-old man with small-cell carcinoma from the lung.
A, On T2-weighted fast spin-echo image, the solid portion of a right parietal mass lesion (arrow) is hyperintense relative to the normal-appearing white matter. The CNR of the enhancing lesion was 45.
B, On contract-enhanced T1-weighted image, the peripheral region of the lesion is enhanced (arrow).
C, On DWI, the lesion is hyperintense relative to the normal-appearing cortical gray matter (arrow). The lesion was graded as +2.
D, On ADC map, the solid lesion is slightly hyperintense. Its nADC was calculated as 0.57.
E, Photomicrograph of the specimen (hematoxylin-eosin stain; original magnification, 40×) shows high cellularity. The tumor cellularity was calculated as 0.72.

A 63-year-old man with large cell neuroendocrine carcinoma from the lung.
A, On T2-weighted fast spin-echo image, the solid portion of left occipital lesion (arrow) is hyperintense relative to the normal-appearing white matter. The CNR of the enhancing lesion was 56.
B, On contrast-enhanced T1-weighted image, the posterior part of the lesion is enhanced (arrow). There are multiple enhancing areas (arrowheads) in the left frontal lobe indicative of subacute infarction.
C, On DWI, the solid lesion is hyperintense relative to the normal-appearing cortical gray matter (arrow). The lesion was ranked as grade +2.
D, On ADC map, the solid lesion is hypointense; its nADC was calculated as 1.04.
E, Photomicrograph of the specimen (hematoxylin-eosin stain; original magnification, 40×) shows high cellularity. The tumor cellularity was calculated as 0.51.
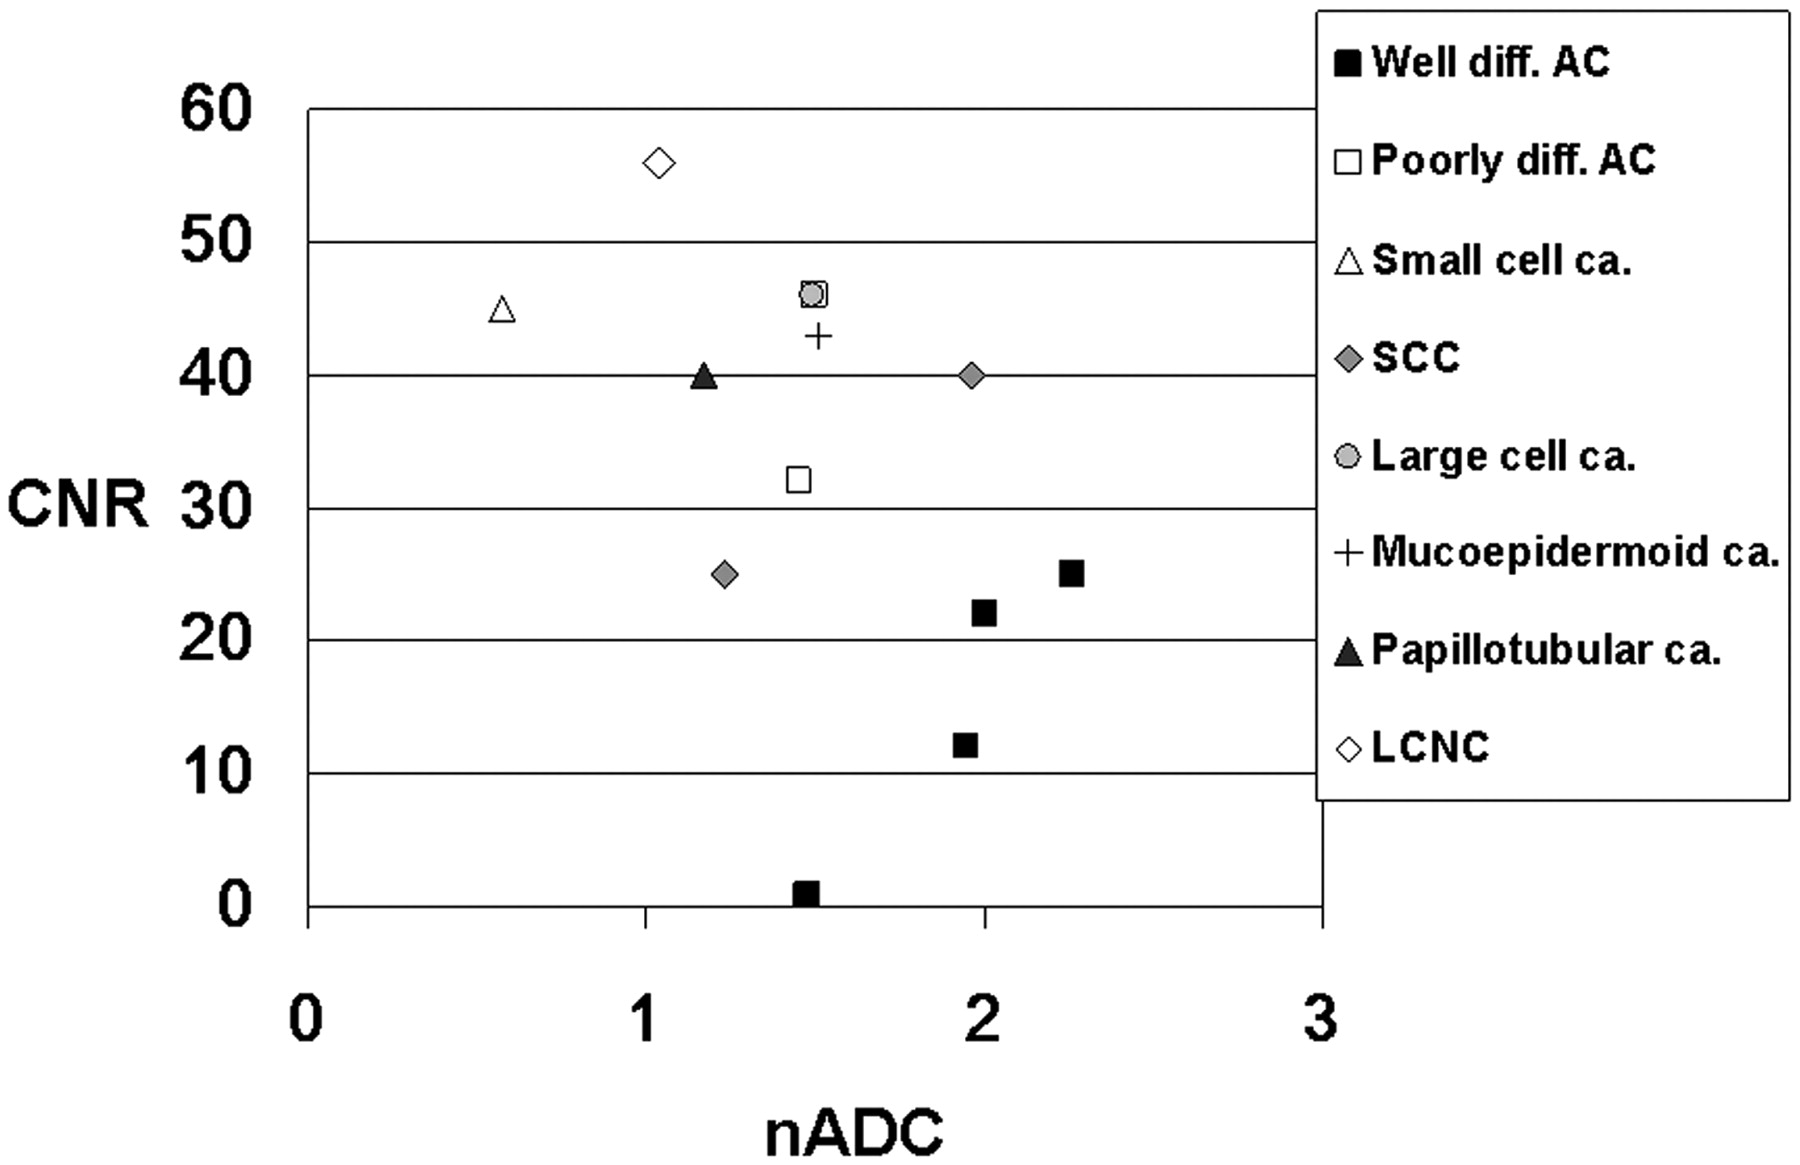
Figure 6 shows the distribution of the CNR on T2-weighted images and the nADC values of the 26 metastatic tumors grouped according to their histologic results. The mean CNR of well differentiated adenocarcinomas (12.5 ± 11.3) was significantly lower than of poorly differentiated adenocarcinomas (39.3 ± 20.3, P = .015) and of tumors of the other histologic type (35.9 ± 16.4, P = .006). There was no statistically significant difference for the mean CNR between poorly differentiated adenocarcinomas and lesions other than adenocarcinoma (P = .61). The mean nADC values of well differentiated adenocarcinomas (1.81 ± 0.36) was significantly higher than that of poorly differentiated adenocarcinomas (1.40 ± 0.27, P = .04) and that of tumors of other histologic types (1.19 ± 0.36, P = .003) (Fig 6). There was no statistically significant difference for the mean nADC between poorly differentiated adenocarcinomas and lesions other than adenocarcinoma (P = .36). Of 3 small cell carcinomas, 2 exhibited the lowest nADC among all 26 tumors. A large cell neuroendocrine carcinoma exhibited a low nADC and a high CNR, and a malignant melanoma had a low CNR and low nADC value.

Comparison of the nADC value and CNR on T2-weighted images of 26 metastatic brain tumors of different histologic types. Most well differentiated adenocarcinomas (Well diff. AC) are distributed at high nADC and low CNR. Of the 3 small-cell carcinomas (Small cell ca.), 2 exhibit nADC values below 1.0. The large-cell neuroendocrine carcinoma (LCNC) manifests low nADC value and high CNR. Poorly differentiated adenocarcinoma (Poorly diff. AC), papillotubular carcinoma (Papillotubular ca.), sarcoma, and malignant melanoma (Melanoma) also exhibit low nADC values. Large cell ca. indicates large cell carcinoma; SCC, squamous cell carcinoma; Mucoepidermoid ca.: mucoepidermoid carcinoma; Mod. diff. AC, moderately differentiated adenocarcinoma.
Figure 7 shows the comparison of the SI on DWI for 13 histologically confirmed brain tumors categorized according to their histology. All 4 well differentiated adenocarcinomas were grade −2 or −1, and both poorly differentiated adenocarcinomas were grade +1 (Figs 2 and 3). The mean SI on DWI was significantly lower in well differentiated adenocarcinoma than lesions other than adenocarcinoma (P = .0082).

Comparison of the signal intensity of 13 histologically confirmed brain lesions on diffusion-weighted images. All 4 well differentiated adenocarcinomas (Well diff. AC) were graded as −2 or −1, and 2 poorly differentiated adenocarcinomas (Poorly diff. AC) as +1. One small-cell carcinoma (Small cell ca.) and 1 large-cell neuroendocrine carcinoma (LCNC) were both graded as +2. The other lesions were graded as 0 or +1. The signal intensity was graded on 5-point scale as described in Fig 1. Large cell ca., large cell carcinoma; SCC, squamous cell carcinoma; Papillotubular ca., papillotubular indicates carcinoma; Mucoepidermoid ca., mucoepidermoid carcinoma.
Figure 8 shows the distribution of the CNR on T2-weighted images and the nADC values of 13 histologically confirmed brain lesions grouped according to their histologic results. The mean CNR of well differentiated adenocarcinomas (15 ± 10.9) was lower than that of poorly differentiated adenocarcinomas (39 ± 9.9). The mean CNR of the well differentiated adenocarcinoma was significantly lower than lesions other than adenocarcinoma (42.1 ± 9.3, P = .0017). The nADC of 4 well differentiated adenocarcinomas ranged from 1.48 to 2.26 (1.92 ± 0.33) and that of 2 poorly differentiated adenocarcinomas ranged from 1.45 to 1.5 (1.48 ± 0.35). The mean nADC of the well differentiated adenocarcinoma was significantly higher than lesions other than adenocarcinoma (1.28 ± 0.44, P = .03).

Comparison of the nADC value and CNR on T2-weighted images of 13 histologically confirmed brain lesions. Most well differentiated adenocarcinomas (Well diff. AC) are distributed at high nADC and low CNR. One small-cell carcinoma (Small cell ca.) and 1 large cell neuroendocrine carcinoma (LCNC) were distributed at low nADC and high CNR. Poorly diff. AC indicates poorly differentiated adenocarcinoma; Large cell ca., large cell carcinoma; SCC, squamous cell carcinoma; Mucoepidermoid ca., mucoepidermoid carcinoma; Papillotubular ca., papillotubular carcinoma.
As shown in Fig 9, the nADC value was inversely correlated with tumor cellularity (r = −0.70, P = .0059). On the other hand, there was no correlation between tumor cellularity and SI on the T2-weighted images (r = 0.41, P = .17).

Relationship between nADC and tumor cellularity. The nADC value inversely correlated well with tumor cellularity (r = −0.70, P = .0059).
Discussion
On DWI, well differentiated adenocarcinomas tended to show hypointensity relative to gray matter. In addition, they manifested significantly lower SI than poorly differentiated adenocarcinomas and tumors of other histologic types. The SI on DWI is influenced by T2, the ADC, b value, spin attenuation, and TE.11 All 6 well differentiated adenocarcinomas had a low CNR on T2-weighted images and high nADC values; the b value and TE were constant in our study. T2 shortening occurs in the presence of hemorrhage; however, the lesions were free of apparent hemorrhage on MR imaging, and the surgical specimens yielded no evidence of hemorrhage. Therefore, we postulate that the hypointensity of the well differentiated adenocarcinomas was associated with an inherently low T2 and high water diffusibility in the tissues, both of which resulted in decreased SI on DWI.
The reason for the hypointensity of metastatic brain adenocarcinomas on T2-weighted images remains to be elucidated.3,4 Carrier et al,4 who studied the blood products calcium, mucin, and iron in 14 patients with metastatic adenocarcinomas, concluded that their appearance on MR imaging most likely reflected the inherent T2 effect of the tissue. However, they did not group the tumors according to their degree of differentiation in their evaluation of the T2-weighted images. We found that well differentiated adenocarcinomas manifested a significantly lower CNR on T2-weighted images than did poorly differentiated adenocarcinomas, suggesting that the degree of differentiation may be relevant in their SI on T2-weighted images. The well differentiated adenocarcinomas in our series derived from the lung, ovary, and uterus. Other investigators3,4 reported that metastatic brain lesions originating from the colon, lung, or breast manifested T2 hypointensity. These results suggest that the histology of the metastatic adenocarcinomas rather than the organ harboring the primary tumor may play a role in its SI.
Although others5,10 reported that small cell carcinomas showed hyperintensity on DWI and low ADC values, the reason for their high signal intensity remains unknown. In our series, all 3 small-cell carcinomas and 1 large-cell neuroendocrine carcinoma, considered to be highly aggressive poorly differentiated lung neuroendocrine tumors,12 were hyperintense on DWI. They exhibited high cellularity and low ADC values, and they tended to have a higher CNR on T2-weighted images. We postulate that their hyperintensity on DWI is the result of synergistic effect of restricted diffusion and T2 shine-through.
Other lesions that had low nADC values of approximately 1.0 were poorly differentiated adenocarcinoma, papillotubular carcinoma, sarcoma, and malignant melanoma. Unlike the small-cell carcinomas, they did not manifest hyperintensity of grade +2 on DWI; a partial explanation for this finding may be their relatively low SI on T2-weighted images. On the other hand, 1 of 2 papillotubular carcinomas with a low ADC value and a high CNR on T2-weighted images was not hyperintense of grade +2 on DWI, indicating that larger studies are required to elucidate the mechanisms that underlie the SI on DWI.
The nADC value of the tumors was significantly correlated with tumor cellularity; our small-cell carcinomas and large-cell neuroendocrine carcinoma exhibited high tumor cellularity. Gliomas and meningiomas manifested a good correlation between the ADC value and tumor cellularity.8,13-15 We postulated that the cellularity of metastatic brain tumors might contribute to their ADC values. Our finding that there was no significant correlation between their SI on T2-weighted images and tumor cellularity suggests that various factors affect the SI on T2-weighted images, including paramagnetic (eg, iron, calcification, hemorrhagic components, melanin), nonparamagnetic (eg, protein concentration, fibrocollagenous stroma, flow-related signal intensity change), and other factors (eg, scant cytoplasm, attenuated cellularity).16 Thus, it appears unlikely that the cellularity of metastatic brain tumors can be estimated based on their SI on T2-weighted images.
There are some limitations to our study. First, half of the metastatic tumors were without histologic confirmation for the brain tumors. The qualitative and quantitative results for all 26 lesions were similar to those for the histologically confirmed 13 brain lesions. Therefore, we believe that our results reflect a tendency of the signal intensity on DWI for brain metastases.
Second, we could not rule out the presence of tiny, undetected intratumoral hemorrhagic components that may have affected the results of our study, though there was no evidence of hemorrhage on conventional MR imaging and DWI. In addition, 13 surgical specimens were available for histologic assessment, and none exhibited evidence of hemorrhage.
Third, partial volume effects could have affected our quantitative ROI measurements. However, although intratumoral cystic and degenerative changes have the potential to affect quantitative values, it is unlikely that such areas were present within the measured ROI because the DWI and T2-weighted images had a high spatial resolution (voxel sizes, 1.72 × 1.72 and 0.86 × 0.43 mm, respectively), and cysts and degenerative changes would have been recognized by the evaluators.
Finally, the original site of the examined surgical specimens may not have coincided with the site of the ROI measurement. For our quantitative analysis of tumor cellularity, we chose a representative area in the solid portion of the specimens. To obtain the ROI measurements on MR imaging, we calculated the mean value of 5 uniform ROIs in the solid portion of each tumor. Therefore, we believe that these data were derived from the representative areas in the solid portion of the metastatic brain tumors.
Conclusion
The SI on DWI may predict the histology of brain metastases. On DWI, the enhancing areas of metastatic brain tumors of different histologic types demonstrated different SI. Well differentiated adenocarcinomas tended to be hypointense; their SI was significantly lower than that of tumors with a different histology. Our 3 small-cell carcinomas and 1 large-cell neuroendocrine carcinoma manifested hyperintensity on DWI. Their ADC values reflected the cellularity of metastatic brain tumors.
Footnotes
Presented in part at the 43rd Annual Meeting of the American Society of Neuroradiology; May 21–27, 2005; Toronto, Ontario, Canada.
References
- Received October 10, 2005.
- Accepted after revision November 16, 2005.
- Copyright © American Society of Neuroradiology
In this issue


Jump to section
Related Articles
Cited By...
- Associations Between ADC Texture Analysis and Tumor Infiltrating Lymphocytes in Brain Metastasis - A Preliminary Study
- Sequential Apparent Diffusion Coefficient for Assessment of Tumor Progression in Patients with Low-Grade Glioma
- Diffusion-Weighted Imaging of Brain Metastasis from Lung Cancer: Correlation of MRI Parameters with the Histologic Type and Gene Mutation Status
- A Multiparametric Model for Mapping Cellularity in Glioblastoma Using Radiographically Localized Biopsies
- Differentiating Hemangioblastomas from Brain Metastases Using Diffusion-Weighted Imaging and Dynamic Susceptibility Contrast-Enhanced Perfusion-Weighted MR Imaging
- The efficacy of diffusion weighted imaging and apparent diffusion coefficients mapping for liver metastasis of colonic adenocarcinomas
- Parametric Response Mapping of Apparent Diffusion Coefficient as an Imaging Biomarker to Distinguish Pseudoprogression from True Tumor Progression in Peptide-Based Vaccine Therapy for Pediatric Diffuse Intrinsic Pontine Glioma
- "Dazed and diffused": making sense of diffusion abnormalities in neurologic pathologies
- Correlation of 18F-FDG Uptake with Apparent Diffusion Coefficient Ratio Measured on Standard and High b Value Diffusion MRI in Head and Neck Cancer
- Differentiation between Glioblastomas, Solitary Brain Metastases, and Primary Cerebral Lymphomas Using Diffusion Tensor and Dynamic Susceptibility Contrast-Enhanced MR Imaging
- Diffusion-weighted magnetic resonance imaging for monitoring prostate cancer progression in patients managed by active surveillance
- Imaging Immune Response In vivo: Cytolytic Action of Genetically Altered T Cells Directed to Glioblastoma Multiforme