
Article Figures & Data
Figures
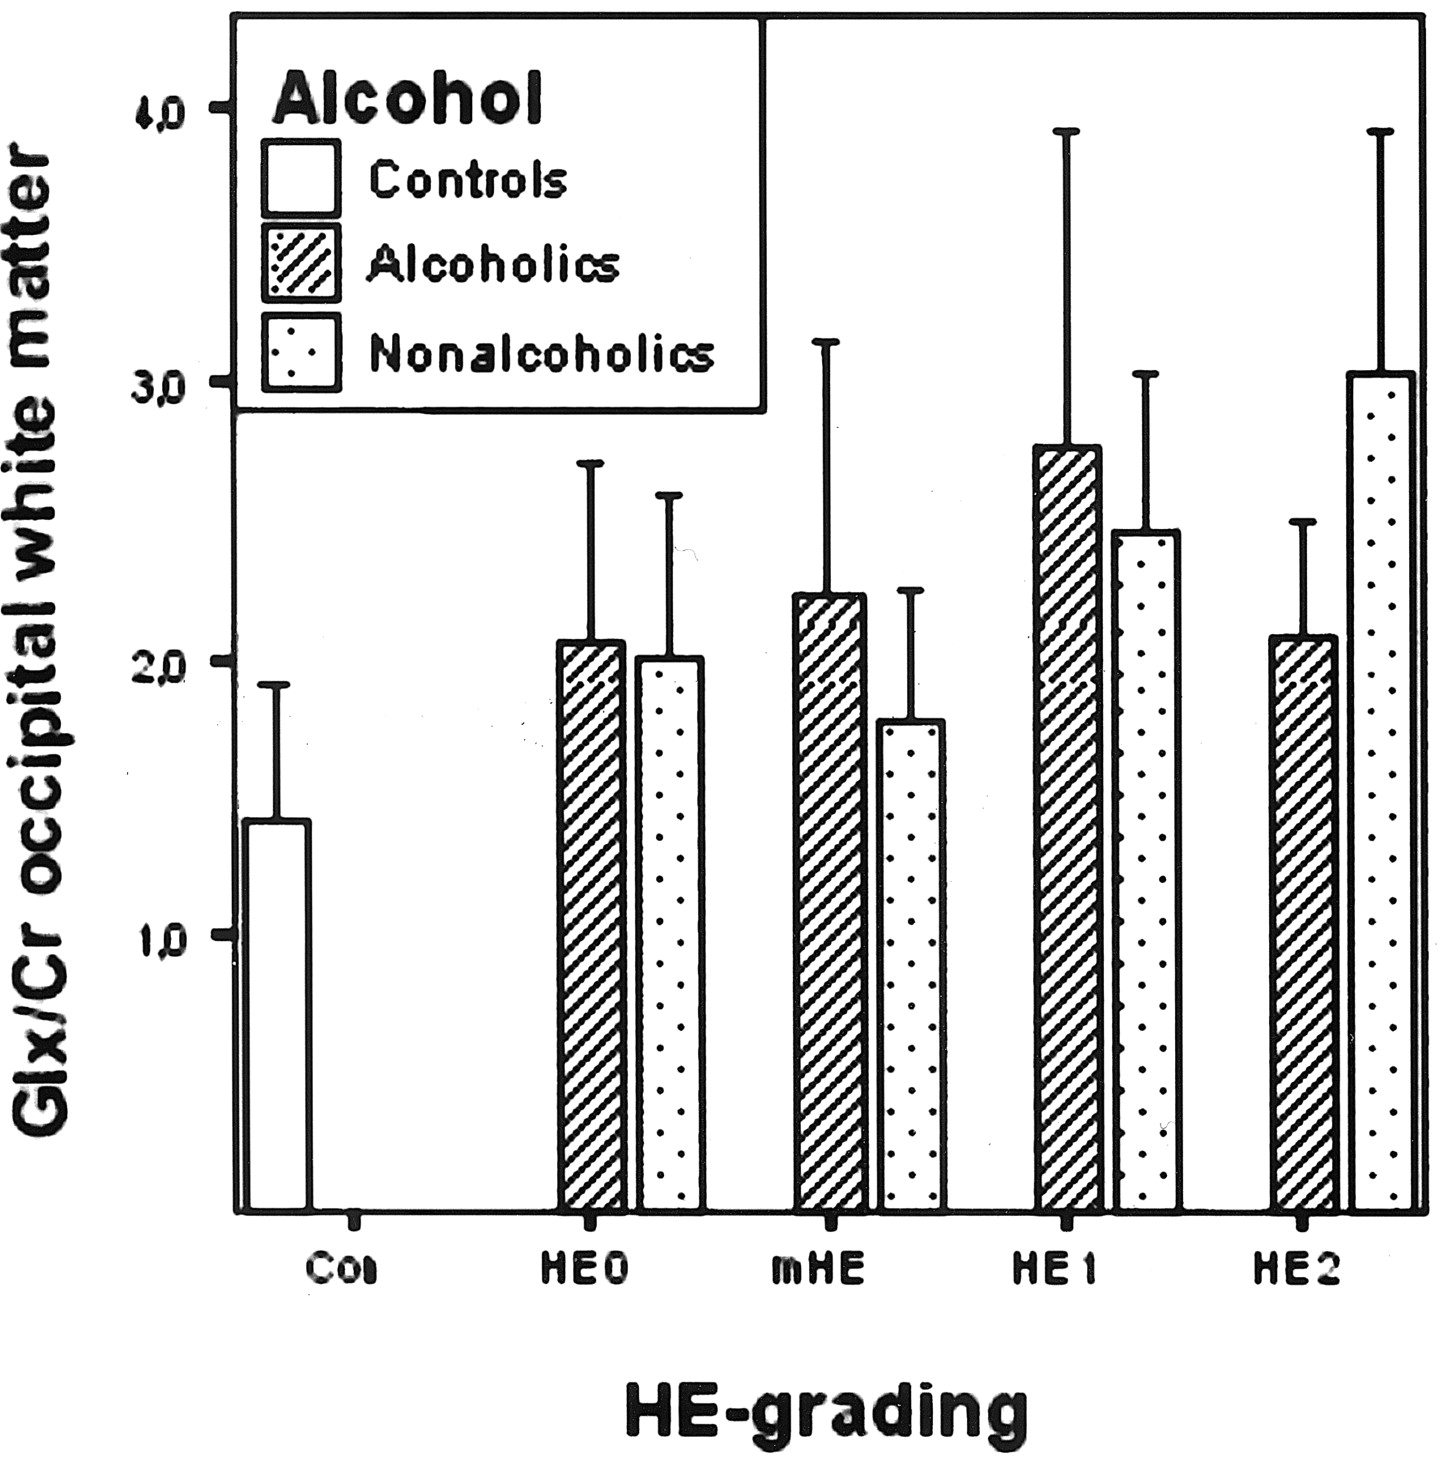
- Fig 1.
Graph shows hepatic encephalopathy grading and occipital white matter Glx/Cr in mean values; whiskers show SD. White matter Glx of alcoholics, graded mHE, HE 1, and HE 2 and white matter Glx of nonalcoholics with overt hepatic encephalopathy (HEO) are elevated, compared with that of controls (Co) (P < 0.05; Mann-Whitney U test).
- Fig 2.
Graph shows hepatic encephalopathy-grading and occipital white matter MTR in mean values; whiskers show SD. White matter MTR of alcoholics, graded any hepatic encephalopathy, and white matter MTR of nonalcoholics with overt hepatic encephalopathy (HRO) are reduced, compared with that of controls (C0) (P < 0.05; Mann-Whitney U test).
- Fig 3.
A, Nonalcoholics: occipital white matter Glx/Cr and MTR. Graph shows linear regression analysis (r2=0.48) and 95% predictive interval of means.
B, Alcoholics: occipital white matter Glx/Cr and MTR. Graph shows linear regression analysis (r2 = 0.07) and 95% predictive interval of means.
- Fig 4.
A, Nonalcoholics: occipital white matter Glx/Cr and mIns/Cr. Graph shows linear regression analysis (r2 = 0.34) and 95% predictive interval of means.
B, Alcoholics: occipital white matter Glx/Cr and mIns/Cr. Graph shows linear regression analysis (r2=0.00) and 95% predictive interval of means.
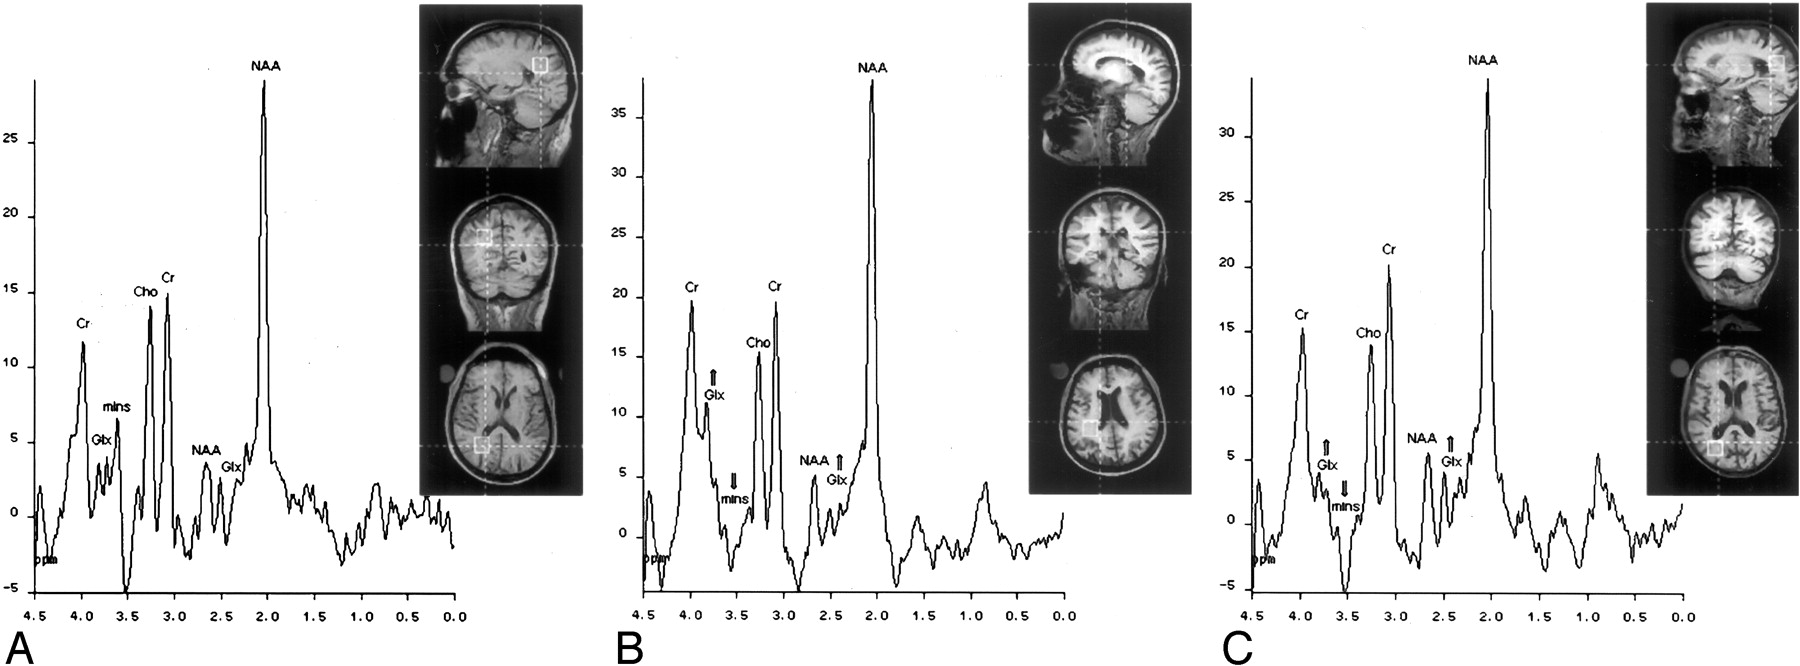
- Fig 5.
MR Spectra of posterior NAWM in a healthy control (A, patient 11), a nonalcoholic patient with cirrhosis (B, patient 55) with overt hepatic encephalopathy, and an alcoholic patient with cirrhosis (C, patient 59). Arrows indicate alterations in the patient’s spectrum, compared with that of the control group. Control (A): mIns/Cr, 0.926; NAA/Cr, 1.952; Cho/Cr, 0.301; Glx/Cr, 1.442. Nonalcoholic patient with cirrhosis (B): mIns/Cr, 0.038; NAA/Cr, 2.129; Cho/Cr, 0.255; Glx/Cr, 3.307. Alcoholic patient with cirrhosis (C): mIns/Cr, 0.260; NAA/Cr, 1.722; Cho/Cr, 0.249; Glx/Cr, 1.784.
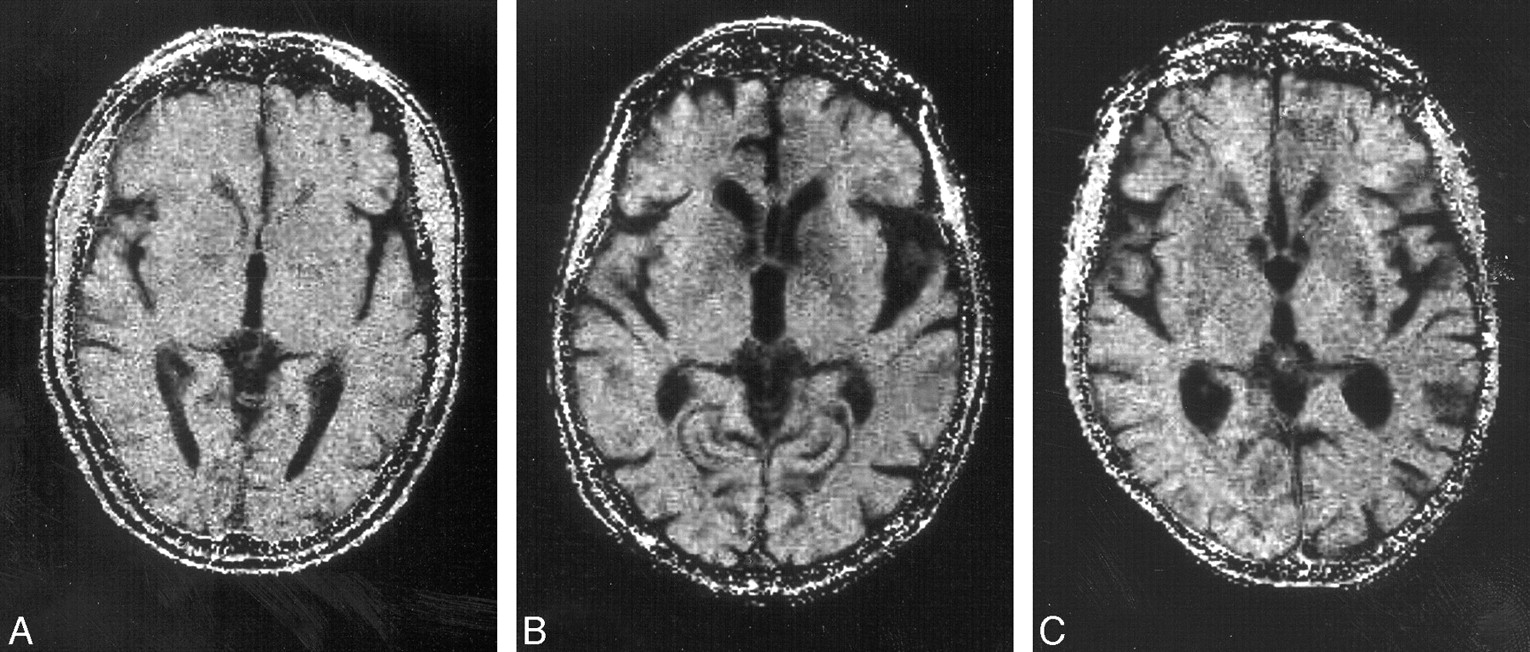
- Fig 6.
MTR map (width, 100%; center, 50%). A, Healthy volunteer (subject 8). B, Nonalcoholic patient with cirrhosis with HE 2 (subject 57). C, Alcoholic patient with cirrhosis with HE 2 (subject 59). MTR of volunteer (A): thalamus, 39.1%; pallidum, 36.4%; putamen, 37.3%; caudate, 37.5%. The following data refer to means of right and left side of the brain. MTR of nonalcoholic patients with cirrhosis (B): thalamus, 35.7%; pallidum, 27.0%; putamen, 31.1%; caudate, 27.7%. MTR of alcoholic patients with cirrhosis (C): thalamus, 34.8%; pallidum, 29.7%; putamen, 28.4%; caudate, 27.5%
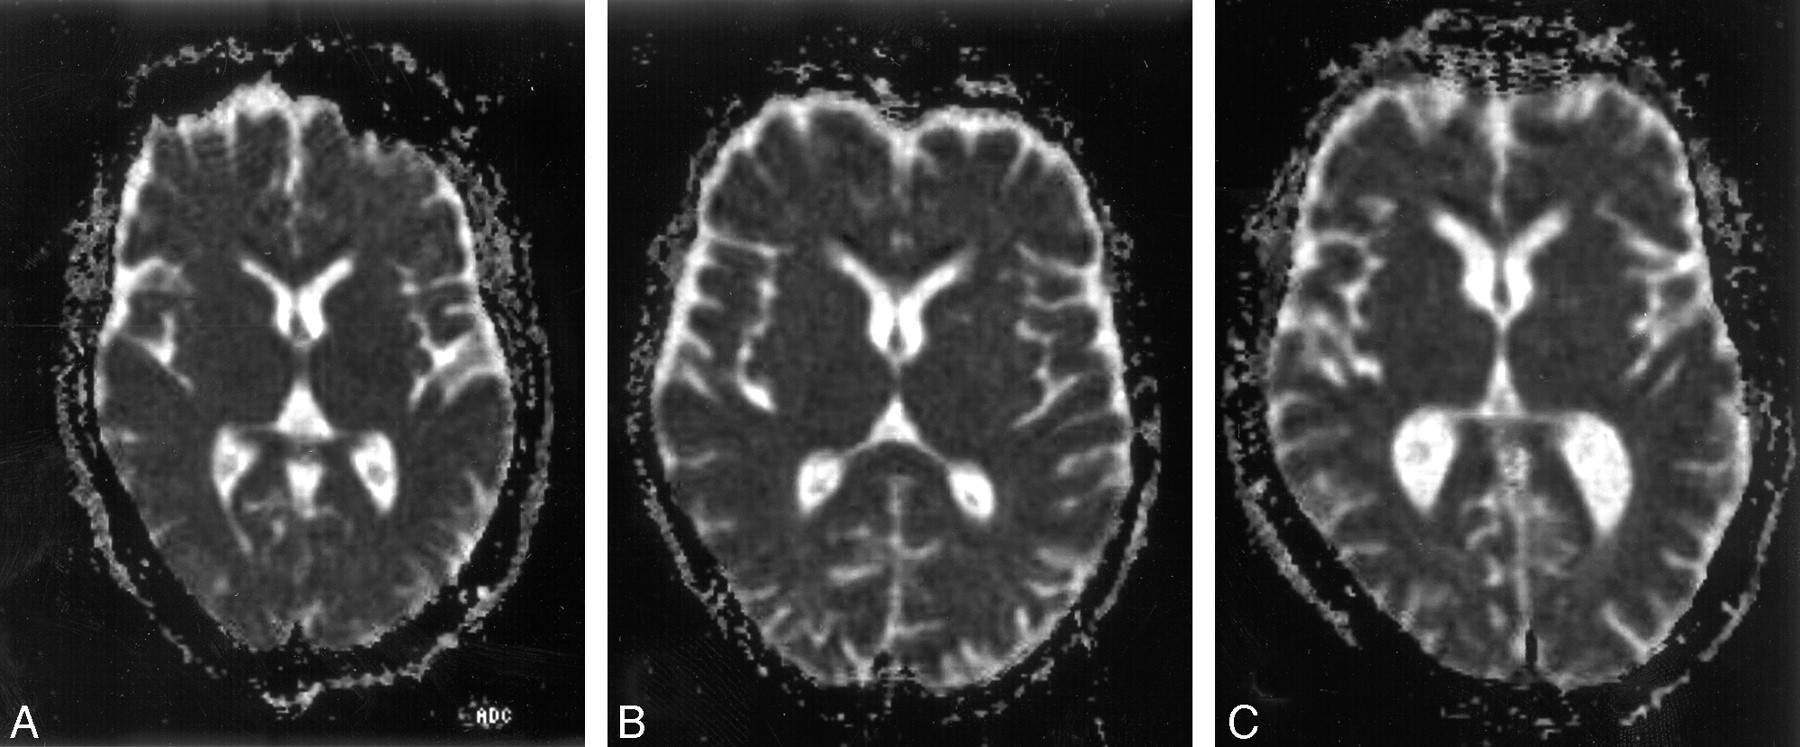
- Fig 7.
ADC map (width, 400%; center, 200%). A, Healthy volunteer (subject 14). B, Nonalcoholic patient with cirrhosis with HE 2 (subject 47). C, Alcoholic patient with cirrhosis and HE 2 (subject 50). ADC of volunteer (A): thalamus, 73.6; NAWM, 83.3. The following data refer to means of right and left side of the brain. ADC of nonalcoholic patients with cirrhosis (B): thalamus, 87.9; NAWM, 101.4. ADC of alcoholic patients with cirrhosis (C): thalamus, 80.6; NAWM, 108.


Tables
Controls (n = 18) Alcoholics (n = 26) Nonalcoholics (n = 19) (M/F) Sex 8/10 18/8 14/5 Age (±SD), y 55.7 ± 13.8 54.3 ± 12.7 NS 61.1 ± 12.4 NS CFF (±SD), Hz 41.3 ± 1.6 37.3 ± 5.0** 36.6 ± 4.9** Child-Pugh grading A 10 9 B 11 5 C 5 5 HE grading HE 0 7 5 mHE 8 3 HE 1 5 6 HE 2 6 5 Note:—Forty-five cirrhotics and 18 controls were enrolled. In 8 controls, 2 alcoholics, and one nonalcoholic patient magnetic resonance spectroscopy could not be performed. Values are reported as mean ± SD. HE indicates hepatic encephalopathy; mHE, minimal HE.
** Significantly different from controls P < .01 (Mann-Whitney U; NS indicates no significant difference.
- Table 2:
Nonalcoholics: rank correlations of 1H-MRS, MTR, and ADC and grading of hepatic encephalopathy
Nonalcoholics, Mean (±SD) Correlation (Spearman-Rho) Controls, Mean (±SD) HE 0 mHE HE1 HE2 r P 1H-MRS, n = 28 n = 10 n = 5 n = 3 n = 5 n = 5 Basal ganglia mins/Cr** 0.784 (0.570) 0.320** (0.161) 0.414 (0.154) 0.250** (0.186) 0.095** (0.097) −.56 .016 NAA/Cr 1.670 (0.252) 1.742 (0.314) 1.704 (0.057) 1.447 (0.303) 1.726 (0.292) −.11 .676 Cho/Cr** 0.267 (0.041) 0.226 (0.032) 0.261 (0.071) 0.206* (0.039) 0.190* (0.055) −.31 .206 Glx/Cr* 1.513 (0.556) 1.823 (0.608) 1.794 (0.316) 2.133 (0.554) 2.945** (0.392) .62 .006 Occipital lobe mins/Cr** 0.823 (0.099) 0.464 (0.416) 0.481 (0.423) 0.349** (0.201) 0.063** (0.072) −.53 .024 NAA/Cr* 1.708 (0.175) 1.760 (0.305) 1.781 (0.257) 1.939* (0.123) 2.110** (0.076) .63 .005 Cho/Cr 0.258 (0.042) 0.244 (0.046) 0.259 (0.075) 0.200* (0.036) 0.228 (0.030) −.21 .397 Glx/Cr** 1.413 (0.489) 1.998 (0.594) 1.774 (0.484) 2.458** (0.590) 3.035** (0.887) .52 .027 MTR (%), n = 37 n = 18 n = 5 n = 3 n = 6 n = 5 Pons 40.1 (1.5) 40.1 (3.2) 38.5 (0.9) 40.2 (2.9) 37.9 (4.8) −.17 .480 Thalamus** 39.4 (0.9) 38.8 (1.3) 38.9 (1.4) 37.1** (2.5) 35.6** (1.3) −.64 .003 Pallidum** 37.1 (1.6) 34.4 (6.0) 32.5 (6.2) 28.7** (6.0) 25.7** (2.5) −.58 .010 Putamen** 35.9 (1.5) 34.5 (3.5) 33.1 (3.1) 30.3** (3.7) 28.9** (1.7) −.61 .006 Caudate** 36.5 (2.2) 35.3 (3.9) 31.2* (3.3) 31.1** (4.4) 30.73** (1.8) −.44 .062 Occipital lobe** 39.0 (1.5) 37.2 (2.3) 35.3 (3.4) 33.2* (4.5) 30.76** (2.4) −.67 .002 ADC (10.5 mm2 s), n = 37 n = 18 n = 5 n = 3 n = 6 n = 5 Thalamus 81.8 (4.7) 78.8 (2.3) 84.1 (2.1) 82.81 (4.6) 83.8 (3.8) .42 .070 Occipital NAWM 93.1 (15.7) 86.1 (4.0) 86.7 (6.9) 94.6 (12.0) 104.0 (20.3) .48 .035 Note:—1H-MRS indicates proton magnetic resonance spectroscopy; MTR, magnetization transfer ratio; ADC, apparent diffusion coefficient; HE, hepatic encephalopathy; mHE, minimal HE; mIns, myoinositol; Cr, creatine and phosphocreatine; NAA, N-acetylaspartate; Cho, choline-containing.
Bold figures indicate significance (P < .05).
* Significantly different from control group (P < .05, Mann-Whitney U).
** Significantly different from control group (P < .01, Mann-Whitney U).
- Table 3:
Alcoholics: rank correlations of 1H-MRS, MTR, and ADC and grading of hepatic encephalopathy
Alcoholics, Mean (±SD) Correlation (Spearman-Rho) Controls, Mean (±SD) HE 0 mHE HE1 HE2 r P 1H-MRS, n = 34 n = 10 n = 6 n = 7 n = 5 n = 6 Basal ganglia mlns/Cr** 0.784 (0.570) 0.256** (0.198) 0.260** (0.214) 0.347* (0.191) 0.296* (0.247) .03 .889 NAA/Cr 1.670 (0.252) 1.623 (0.321) 1.453 (0.204) 1.645 (0.185) 1.559 (0.164) .03 .896 Cho/Cr** 0.267 (0.041) 0.205** (0.032) 0.186** (0.041) 0.217 (0.053) 0.203* (0.049) .01 .980 Glx/Cr* 1.513 (0.556) 2.079* (0.417) 2.795** (0.618) 2.597** (0.724) 2.516 (1.747) .09 .669 Occipital lobe mins/Cr** 0.823 (0.099) 0.295* (0.296) 0.272** (0.191) 0.310** (0.103) 0.252** (0.158) .12 .567 NAA/Cr 1.708 (0.175) 1.920 (0.283) 1.877* (0.118) 1.807 (0.262) 1.914 (0.365) −.11 .601 Cho/Cr 0.258 (0.042) 0.257 (0.056) 0.225 (0.055) 0.253 (0.044) 0.226 (0.036) −.12 .572 Glx/Cr** 1.413 (0.489) 2.071 (0.643) 2.229** (0.919) 2.774** (1.150) 2.084* (0.412) 0.00 .988 MTR (%), n = 44 n = 18 n = 7 n = 8 n = 5 n = 6 Pons 40.1 (1.5) 39.5 (0.5) 38.4* (1.5) 38.2 (2.6) 39.1 (2.4) −.11 .600 Thalamus** 39.4 (0.9) 39.5* (0.5) 38.4* (1.5) 38.2** (2.6) 39.1** (2.4) −.07 .730 Pallidum** 37.1 (1.6) 37.9** (1.6) 37.6** (2.0) 37.9** (0.7) 37.6** (1.6) .01 .974 Putamen** 35.9 (1.5) 32.1** (3.8) 29.1** (5.6) 28.7** (2.7) 32.9** (1.7) −.06 .774 Caudate** 36.5 (2.2) 33.1 (1.7) 31.0* (2.6) 32.3** (1.3) 32.4** (2.5) −.18 .389 Occipital lobe** 39.0 (1.5) 34.3** (4.0) 32.8** (4.1) 31.6** (2.1) 32.8** (3.6) .08 .707 ADC (10.5 mm2/s), n = 44 n = 18 n = 7 n = 8 n = 5 n = 6 Thalamus 81.8 (4.7) 79.4 (4.1) 82.1 (5.1) 86.4* (2.6) 82.4 (7.1) .31 .121 Occipital NAWM 93.1 (15.7) 91.9 (4.7) 86.7 (8.0) 100.2 (7.8) 93.6 (8.6) .18 .378 Note:—1H-MRS indicates proton magnetic resonance spectroscopy; MTR, magnetization transfer ratio; ADC, apparent diffusion coefficient; HE, hepatic encephalopathy; mHE, minimal HE; mIns, myoinositol; Cr, creatine and phosphocreatine; NAA, N-acetylaspartate; Cho, choline-containing.
* Significantly different from control group (P < .05, Mann-Whitney U).
** Significantly different from control group (P < .01, Mann-Whitney U).
In this issue


Jump to section
Related Articles
Cited By...
- J-difference GABA-edited MRS reveals altered cerebello-thalamo-cortical metabolism in patients with hepatic encephalopathy
- Meta-analysis of magnetic resonance spectroscopy in the diagnosis of hepatic encephalopathy
- Multimodality MR Imaging Findings of Low-Grade Brain Edema in Hepatic Encephalopathy
- Modulation of neural activation following treatment of hepatic encephalopathy
- Acute Hepatic Encephalopathy: Diffusion-Weighted and Fluid-Attenuated Inversion Recovery Findings, and Correlation with Plasma Ammonia Level and Clinical Outcome
- Brain MR Imaging and 1H-MR Spectroscopy Changes in Patients with Extrahepatic Portal Vein Obstruction from Early Childhood to Adulthood
- Pathogenetic mechanisms of hepatic encephalopathy