
Article Figures & Data
Figures
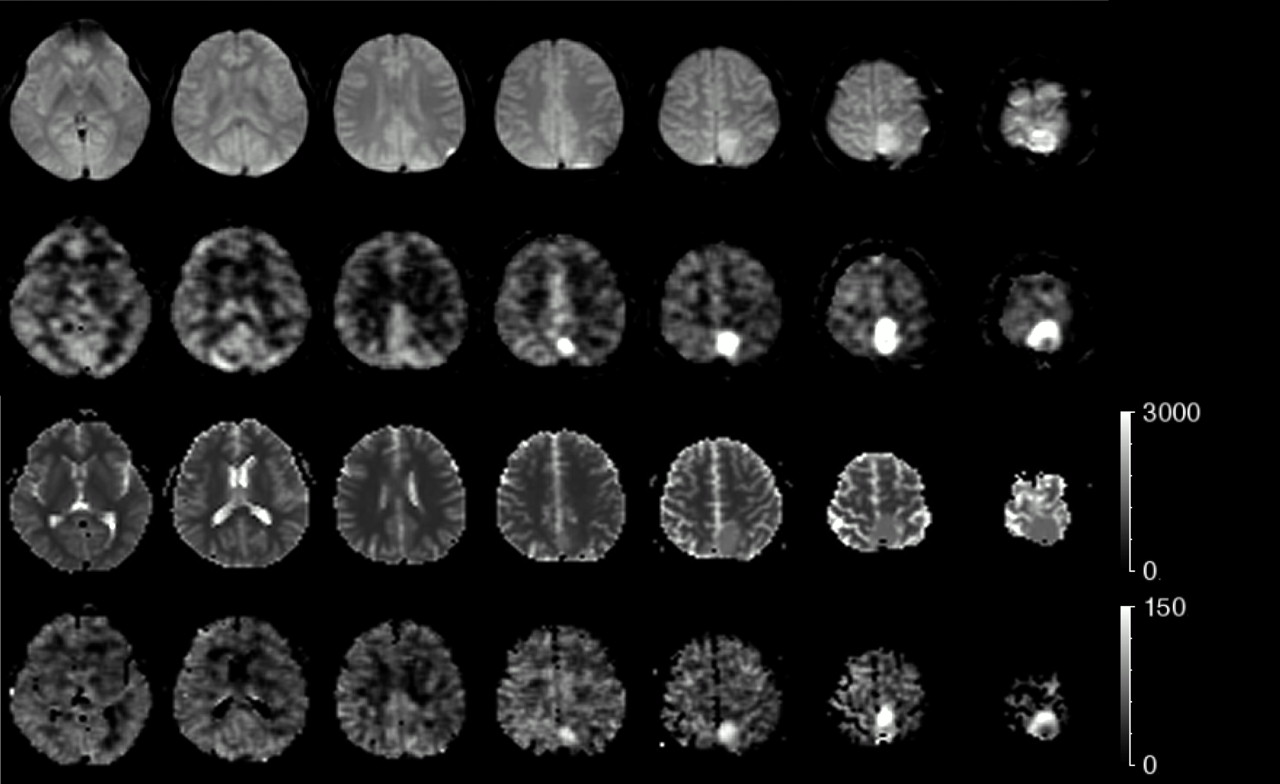
- Fig 1.
Multisection images obtained in a 60-year-old patient with meningioma (patient 8). Echo-planar images (4100/20 milliseconds), perfusion-weighted images, T1 maps, and quantitative CASL-rCBF maps are shown from the top to bottom rows. Values in rightmost column were expressed as milliseconds and mL/min/100 g in T1 maps and rCBF maps, respectively. The left parietal parasagittal meningioma is revealed as hyperperfusion in perfusion-weighted images and rCBF maps.
- Fig 2.
Conventional T2-weighted images and axial T1 images with and without Gd-DTPA. The perfusion maps obtained with T2DSC in a 60-year-old patient with parietal falx meningioma (patient 8, same as Fig 1). A, Sagittal T2-weighted image. B, T1-weighted image. C, Post-Gd-DTPA T1-weighted image. D, T2DSC perfusion image (rCBF map). E, T2DSC perfusion image (rCBV map. F, T2DSC perfusion image (MTT map). The tumor shows higher signal intensity than the cortex as well as enhancement on T2-weighted and post-Gd T1-weighted images. Dural tail sign is apparent in the anterior aspect of tumors. Note that the tumor protrudes into bone through the dura matter and cortical layers. The hyperperfusion signals are apparent on perfusion maps obtained with T2DSC, rCBF, and rCBV. Note that the MTT of tumor region has a slightly longer transit time relative to the parenchyma region.
- Fig 3.
Axial conventional images and perfusion maps obtained with CASL and T2DSC in a 78-year-old patient with frontal convex meningioma (patient 7). A, T2-weighted image. B, T1-weighted image. C, Post-Gd T1-weighted image. D, CASL perfusion-weighted image (rCBF map). E, T2DSC perfusion image (rCBF map), The tumor shows a very high signal intensity and intense enhancement on T2-weighted and post-Gd T1-weighted images, respectively. The hyperperfusion signal intensity is apparent on perfusion maps obtained with CASL and T2DSC. F, HE-stained sections (×200) from the same case. The angiomatous subtype of meningioma was confirmed on histologic examination. The large thin-walled vessels in which red blood cells are contained are found throughout the specimen.
- Fig 4.
Axial conventional images and perfusion maps obtained with CASL and T2DSC in a 49-year-old patient with frontal falx meningioma (patient 6). A, T2-weighted image. B, T1-weighted image. C, Post-Gd T1-weighted image. D, CASL perfusion-weighted image (rCBF map). E, T2DSC perfusion image (rCBF map). The tumor shows slightly higher signal intensity than the cortex as well as good enhancement on T2-weighted and post-Gd T1-weighted-images, respectively. Note that the posterior aspect of tumor revealed very low signal intensity on T2-weighted images, corresponding to hemorrhagic change, which was also confirmed by CT imaging during the same period. The hyperperfusion signal intensity is apparent on perfusion maps obtained with CASL and T2DSC. F, HE-stained sections (×100) from the same case. The fibrous subtype of meningioma was confirmed on histologic examination. Microvessels are very scantly scattered in the specimen.
- Fig 5.
Tumor blood flow in each histologic group. The plot shows absolute tumor blood flow determined by continuous arterial spin-labeling in 10 patients with histologically proved meningiomas in each histologic subtype group. Three atypical and one clear cell subtype was excluded. Error bars indicate standard deviation. The result of Tukey-Kramer Multiple Comparisons Test is shown as ns (not significant: P > .05) and ** (significant difference: P < .01).
- Fig 6.
Scatter plots of tumor blood flow between T2DSC and CASL. A, CASL-rCBF versus T2DSC-rCBF. B, Ratio of tumor blood flow relative to whole section values between T2DSC and CASL. Linear regression analyses reveal high correlation in absolute rCBF values and relative ratios. The equation of the regression line is drawn in panels A and B. r2 is the square value of correlation coefficient. Dashed lines indicate 95% confidence bands for the linear regression.
- Fig 7.
A, Microvessel immunostaining by using CD31 in meningioma (patient 6, same case as in Figs 1 and 2). The microvessel walls are positively stained. B, The microvessel areas are extracted automatically by the software. Note that the light green areas are overlaid on the immunostained specimen to the areas recognized as the lumen of microvessel structures.
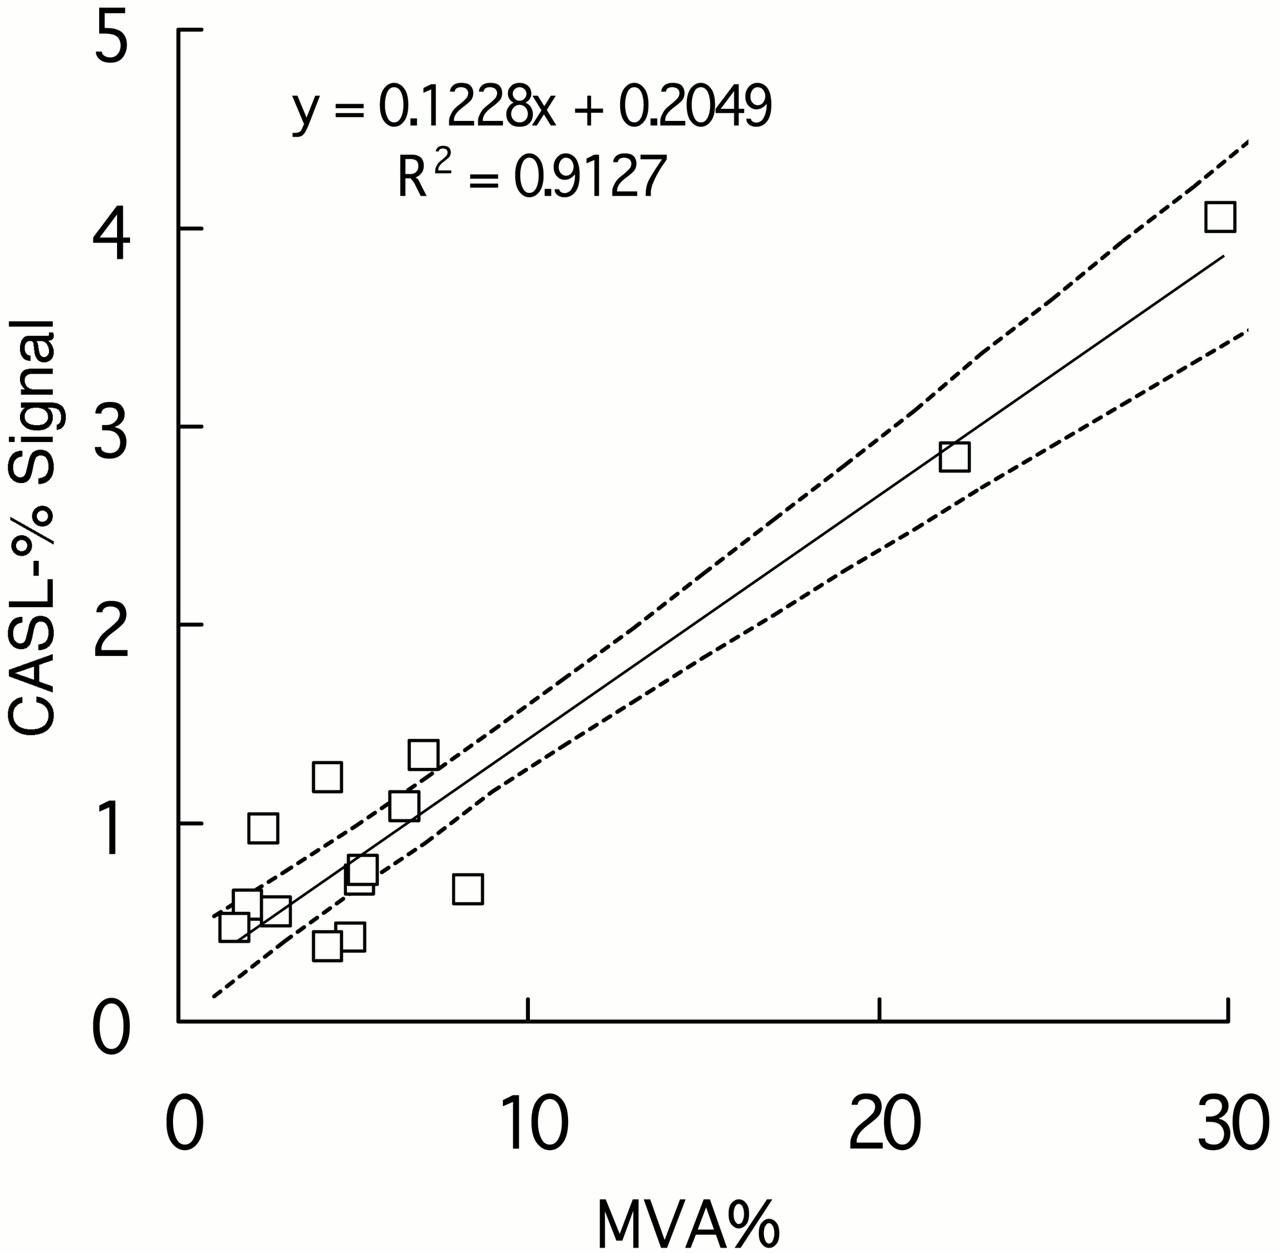
- Fig 8.
Microvessel area on histologic specimens (MVA) versus signal intensity change from CASL perfusion images in all 14 patients with meningioma. Linear regression analyses revealed high correlation, with an r2 of 0.9127; 95% confidence bands are indicated by dashed lines. Regressed linear equation is shown as an inset in the graph.


Tables
- Table 1:
Individual clinical information, conventional MRI, and histological subtypes of tumors
Patient No./Age (y)/Sex Location of Tumor MRI findings on T2WI* Histological subtype of Meningioma 1/82/F Right frontal convex, en. plaque type (++), Edema (+) Atypical meningioma 2/58/F Adjacent to the meninges of left Sylvian fissure (+++) Angiomatous/microcystic meningioma 3/67/F Left sphenoid ridge NA Meningothelial meningioma 4/35/F Suprasellar (±) Meningothelial meningioma 5/69/M Frontal falx (++), edema (+) 6/49/M Frontal fax (++) Fibrous type 7/78/M Right frontal convex (++) Angiomatous meningioma 8/60/M Parietal parasagittal (++) 9/60/F Left cerebellar tentorial (±) Fibrous type 10/32/M Right ventricle, trigonal region (++) 11/49/M Right frontal convex (±) Atypical meningioma 12/79/M Right frontal meninge, adjacent to Sylvian fissure (±) 13/50/F Right cerebellar tentorial (+) Meningothelial meningioma 14/77/F Left frontal falx (+) 15/53/F Left parietal parasagittal (+) 16/55/F Left sphenoid ridge (++) Meningothelial meningioma 17/38/M Left parietal convex (+), Edema (+) Atypical meningioma 18/33/F Left temporal fossa, cystic portion (+) (++) Meningothelial meningioma 19/76/F Right temporal fossa (±), Edema (+) Clear cell meningioma 20/63/F Right frontal parasagittal (++) 21/54/F Right parietal convex (++) Meningothelial meningioma * Signal intensity of meningioma is evaluated as high or low relative to cortical signal. The degree of hyperintensity in the tumor is divided into four groups: (±), (+), (++), and (+++) denote low to iso, iso to slightly high, high, and very high, respectively.
Patient No. CASL Perfusion T2DSC Perfusion Tumor CBF (mL/min/100 g) Tumor (% Si) Total CBF (mL/min/100 g) Tumor CBV (mL/100 g) Tumor CBF (mL/min/100 g) Tumor MTT (s) Total CBF (mL/min/100 g) 1 91 1.33 26 ND ND ND ND 2 180 4.05 33 67 342 12 55 3 110 1.07 38 22 205 7 76 4 72 0.97 41 4 44 6 49 5 197 1.79 63 59 356 10 81 6 59 0.55 47 13 135 6 76 7 191 2.83 50 68 279 15 70 8 116 1.23 49 33 177 11 71 9 48 0.57 45 ND ND ND ND 10 65 0.70 31 4 59 4 61 11 43 0.44 35 9 63 9 51 12 77 0.68 27 41 258 10 93 13 56 0.66 23 22 126 12 64 14 23 0.28 41 5 178 5 73 15 87 0.71 65 23 54 8 104 16 101 0.72 34 16 190 5 68 17 102 0.75 31 32 183 11 90 18 114 0.47 51 23 127 11 63 19 46 0.41 16 21 157 8 83 20 74 0.56 28 21 153 9 73 21 38 0.36 44 15 76 12 74 Note:—T2DSC indicates T2-dynamic susceptibility contrast; CASL, continuous arterial spin labeling; %SI, percentage signal change relative to local signal intensity; CBF, cerebral blood flow; CBV, cerebral blood volume; MTT, mean transit time.
Perfusion Parameters CASL: % Signal Change CASL: rCBF T2DSC: rCBV T2DSC: rCBF T2DSC: MTT r2 .91 .61 .83 .73 .29 Significance of correlation P < .00001 P < .001 P < .0001 P < .001 P < .05 Note:—r2: Squared Pearson’s correlation coefficient. Significance of correlation; t test for simple linear regression was performed. The p-value is calculated using the t-distribution.
CASL indicates continuous arterial spin labeling; T2DSC, T2-dynamic susceptibility contrast; rCBF, right cerebral blood flow; rCBV, right cerebral blood volume; MTT, mean transit time.
In this issue


Jump to section
Related Articles
Cited By...
- Efficacy of endovascular intratumoral embolization for meningioma: assessment using dynamic susceptibility contrast-enhanced perfusion-weighted imaging
- Relationship between Shear Stiffness Measured by MR Elastography and Perfusion Metrics Measured by Perfusion CT of Meningiomas
- Effect of Tumor Perfusion and Receptor Density on Tumor Control Probability in 177Lu-DOTATATE Therapy: An In Silico Analysis for Standard and Optimized Treatment
- Effects of Susceptibility Artifacts on Perfusion MRI in Patients with Primary Brain Tumor: A Comparison of Arterial Spin-Labeling versus DSC
- Optimized Peptide Amount and Activity for 90Y-Labeled DOTATATE Therapy
- Comparison of Multiple Parameters Obtained on 3T Pulsed Arterial Spin-Labeling, Diffusion Tensor Imaging, and MRS and the Ki-67 Labeling Index in Evaluating Glioma Grading
- Arterial Spin-Labeled Perfusion of Pediatric Brain Tumors
- Assessment of Angiographic Vascularity of Meningiomas with Dynamic Susceptibility Contrast-Enhanced Perfusion-Weighted Imaging and Diffusion Tensor Imaging
- Imaging biomarkers of angiogenesis and the microvascular environment in cerebral tumours
- Quantitative Blood Flow Measurements in Gliomas Using Arterial Spin-Labeling at 3T: Intermodality Agreement and Inter- and Intraobserver Reproducibility Study