
Abstract
BACKGROUND AND PURPOSE: Previous neuroimaging studies have suggested asymmetries in brain diffusivity may exist. The purpose of this study was to assess whether water diffusivity in deep gray matter structures shown by diffusion-weighted (DW) imaging differs between the right and left cerebral hemispheres in normal individuals.
METHODS: Brain MR imaging was obtained in 23 healthy volunteers. A multisection image without diffusion weighting, and images with weighting applied in the read, phase, and section directions with a b-factor of 1000 s/mm2 were collected. Diffusivity was computed separately in each direction, and the results were averaged to form mean diffusivity maps. Quantitative diffusivity values were obtained from the globus pallidus, putamen, caudate, thalamus, white matter, and CSF by using a standardized region of interest template. Interhemispheric differences were assessed by using a paired sample t test.
RESULTS: Mean diffusivity was higher in the: left (mean ± SD: 0.689 × 10⁻³± 0.069 × 10⁻³mm2/s) versus right (0.642 × 10⁻³± 0.071 × 10⁻³mm2/s) caudate (% difference, P value: 7.0%, P = .001); right (0.745 × 10⁻³± 0.053 × 10⁻³mm2/s) versus left (0.706 × 10⁻³± 0.050 × 10⁻³mm2/s) globus pallidus (5.2%, P < .001); left (0.720 × 10⁻³± 0.059 × 10⁻³mm2/s) versus right (0.674 × 10⁻³± 0.052 × 10⁻³mm2/s) putamen (6.4%, P < .001); right (0.750 × 10⁻³± 0.040 × 10⁻³mm2/s) versus left (0.716 × 10⁻³± 0.031 × 10⁻³mm2/s) thalamus (4.5%, P < .001). No significant right versus left difference was seen in the CSF (P = .291), anterior frontal white matter (P = .834), or centrum semiovale (P = .320).
CONCLUSION: Gray matter diffusivity may differ between hemispheres of the brain in healthy individuals. Analysis of deep gray matter lesions requires caution, as statistically significant interhemispheric differences may not always be indicative of disease.
Continuing advances in MR imaging and brain registration techniques have improved the understanding of anatomic asymmetries in the normal human brain. Recent neuroimaging studies have demonstrated left greater than right gray matter volume in the transverse temporal gyri, mesial temporal lobe, anterior cingulate sulcus, and medial cerebellum; a left larger than right first gyrus of Heschl; and a left greater than right cerebellar hemisphere volume (1–3). Positron-emission tomographic scanning has demonstrated left greater than right cerebral glucose metabolism in the medial frontal gyrus, posterior thalamus, lingual gyrus, cuneus, and superior cingulate and right greater than left cerebral glucose metabolism in the mesioanterior cerebellum, the lateral frontal lobe, and the lateral temporal lobe (4). Although pathologic studies have long demonstrated significant anatomic and functional asymmetries in the cerebral cortex, pathologic specimens are difficult to obtain and require fixation and manual tissue preparation, making it difficult for postmortem analysis to detect subtle structural differences in small sample sizes (1, 5, 6).
Anatomic changes in subcortical (deep) gray matter structures are implicated in numerous disease states. The thalamus is a deep gray matter structure that modulates various brain functions such as incoming sensory and motor information routed to higher brain centers. It is the major source of monosynaptic subcortical inputs ascending to the cerebral cortex (6). As a result, it is the focus of neuroimaging studies in multiple conditions, including but not limited to schizophrenia, autism, obsessive-compulsive disorder, multiple sclerosis (MS), epilepsy, and stroke (7–28). Structural asymmetries have yet to be reported pathologically in the thalamus (6, 29). More recently MR imaging volumetric analyses have examined thalamic asymmetries in disease states and control subjects. Results in control subjects within the schizophrenia literature, where thalamic volumes have been the most frequently analyzed, have been equivocal, with left greater than right asymmetry, right greater than left asymmetry, and no left-right asymmetry having been reported (7, 12–14, 16, 17, 30). A thalamic volumetric analysis of normal individuals reported no thalamic left-right asymmetry (3). The basal ganglia include the caudate, globus pallidus, putamen, and substantia nigra, which participate in the regulation of motor performance. Volumetric analyses of these structures have demonstrated a right-greater-than-left caudate, left-greater-than-right caudate, no left-right asymmetry in the caudate, and no left-right asymmetry in the globus pallidus or putamen (3, 18, 24, 31). Animal studies have shown a left-greater-than-right lateralization of dopamine receptor attenuation in the caudate and putamen (32).
Diffusion-weighted (DW) imaging noninvasively detects the random translational (Brownian) motion of water molecules in living tissue. The fact that water diffusion is sensitive to the underlying tissue microstructure makes DW imaging a unique and sensitive method for studying neuroanatomy (33). By generating maps of diffusivity, quantitative analyses can be performed. DW imaging has proved to be more sensitive than conventional MR imaging methods in detecting structural changes in several disease states (34–41). In acute stroke, the reduced water diffusivity in the lesion is manifested as a hyperintensity on the DW imaging image that is usually readily apparent when comparing to the contralateral side or as a reduced apparent diffusion coefficient (ADC) value in quantitative analysis. Measurement of diffusivity also has relevance to a variety of other brain disorders, such as MS, infections, neoplasms, and cysts in which similar lesion-to-normal side comparisons have been used to demonstrate disease (42–48). One assumption implicit in the comparison of lesions to the contralateral area in DW imaging analysis is the symmetry of diffusivity between hemispheres in patients free of disease. Because of conflicting evidence in previous studies regarding the extent of gray matter structure asymmetry, our aim was to provide a definitive assessment of left-right differences using a noninvasive method sensitive to neuronal densities. We evaluated the hypothesis that asymmetries would exist in the diffusivities in subcortical gray matter structures in normal individuals (22).
Methods
Subjects
Twenty-three healthy volunteers were included in the study. Subjects had no major medical disorders, were all nonsmokers, and had no history of major organ damage, psychiatric illness, childhood abuse, or alcohol or substance abuse. All subjects had a conventional MR image read as normal by an experienced observer (R.B.). Twelve (52%) of the subjects were female and 11 (48%) were male. Subject age ranged from 21 to 58 years, with a mean age of 42.7 ± 9.5 (mean ± SD) years. Twenty of the subjects were right-handed, and three were left-handed.
MR Imaging
MR Imaging.
Brain MR imaging was obtained on a General Electric Signa 4×/L× 1.5T magnet (Milwaukee, WI). All subjects had an identical scanning protocol that consisted of 5-mm nongapped axial fluid-attenuated inversion recovery, T1-weighted, and fast spin-echo T2-weighted images. In addition, DW imaging scans were performed by using a single-shot spin-echo echoplanar technique with a TR/TE/NSA of 9999/106/1, 5-mm nongapped (contiguous) sections, matrix size of 128 × 96, FOV of 36 × 27 cm, and scan time of 40 seconds, generating 28 axial sections. At each section location, four images were collected: one without diffusion weighing, and then with weighting applied in the read, phase, and section directions with a b-factor of 1000 s/mm2. None of the images were affected by gross head rotation.
MR Imaging Analysis.
Images were transferred for computer-assisted quantitative analyses on a Sun Ultra 10 workstation (Sun Microsystems, Santa Clara, CA) by using the Jim software package (version 2.0, Xinapse Systems, Northants, UK; http://www.xinapse.com). None of the images used in the study was corrupted by significant artifacts. A single trained technician performed all aspects of analysis.
Analysis of Diffusivity.
Fig 1 shows representative sections and a description of the analysis method. Mean diffusivity maps were reconstructed by using the Jim software package. The diffusivity was computed separately in the read, phase, and section directions, and the results were averaged to form mean diffusivity maps (Fig 1). In addition, the MR imaging scanner produced an average diffusion-weighted image by averaging the three diffusion-weighted images. Mean diffusivity values were obtained on the left and right from the following areas: anterior frontal white matter, caudate, centrum semiovale, globus pallidus, lateral ventricle, putamen, and thalamus (Fig 1). All region of interest templates were initially placed on the average DW image and then transferred to the corresponding mean diffusivity map, because the DW image has greater contrast and fewer artifacts than the mean diffusivity image. The mean diffusivity image and the average DW image are fully in register.

DW images for each section were collected with diffusion weighting in three orthogonal directions and a b factor of 1000 s/mm2. The DW images, together with a T2-weighted image (b = 0), were used to calculate three ADC images (one for each weighting direction), which were then averaged to form the mean diffusivity image used in analysis (B, D, F, H). In addition, the three DW images were averaged to form an average DW imaging (A, C, E, G). Region of interest analysis was then used to determine quantitatively the mean diffusivity in the selected gray matter structures. Five-millimeter-diameter circular regions of interest were drawn on the average DW images (C, E, G), because of the higher anatomic detail visualized on these images, for the anterior and posterior thalamus (C), caudate (C), lateral ventricle (E), anterior frontal white matter (E), and centrum semiovale (G). Freehand structure tracing was performed by a trained observer on the average DW image to create the region of interest for the putamen (A). The globus pallidus region of interest was created on the average DW image by a semiautomated edge-finding technique (A). The regions of interest were then copied to the mean diffusivity maps (B, D, F, H). The data from the anterior and posterior thalamus regions of interest were averaged to estimate the mean diffusivity for each thalamus (D).
One circular region of interest template 5 mm in diameter (9.93 square pixels) was placed in the anterior frontal white matter, caudate, and centrum semiovale on the left and the right side to obtain the mean diffusivity for these regions (Fig 1). The anterior frontal regions of interest were placed at the midventricular level and the centrum semiovale regions of interest were placed on the image two sections superior to lateral ventricles (Fig 1). A 5-mm circular region of interest was also placed bilaterally in the posterior horn of the lateral ventricle to obtain a mean diffusivity value for CSF (Fig 1). The globus pallidus was traced by using a semiautomated edge-finding technique on the axial section in which it appeared most prominently (Fig 1). The putamen was manually traced on the same section, as was the globus pallidus region of interest (Fig 1). Two circular region of interest templates 5 mm in diameter were placed in each thalamus by first dividing the thalamus into anterior and posterior portions and then placing one region of interest in the center of each portion (Fig 1). Section selection for analyses was determined by using the axial section showing the largest portion of the thalamus, which was typically the middle of three sections transecting the thalamus. As decided before the study, to reduce the number of statistical tests, the data from the anterior and posterior thalami regions of interest were averaged to produce a single value for the thalamus in each hemisphere. This collapsing was justified as a t test indicated no significant anteroposterior thalamic diffusivity difference in either the left (P = .499) or right (P = .309) hemisphere. The region of interest size was chosen to maximize coverage of each structure, create uniformity among structures, and minimize partial volume effects from adjacent structures. In light of the relatively small sizes of the regions of interest, however, we felt it necessary to test for potential undersampling effects leading to increased variability. Thus, for the left thalamus we used a 7-mm-diameter circular region of interest (19.91 square pixels) to measure mean diffusivity in five randomly chosen patients. The mean diffusivity values were similar between those obtained with 5-mm versus 7-mm regions of interest (P = .79).
Statistical Analysis
A paired sample t test was used to compare differences between the left and right hemispheres for each individual structure. A paired sample t test was also used to compare each individual structure in left-handed subjects to the corresponding structure in right-handed individuals to assess the effects of handedness. Group differences were assessed by independent sample t tests. To correct for the number of statistical tests performed, a two-tailed P value <.005 was required for significance.
Results
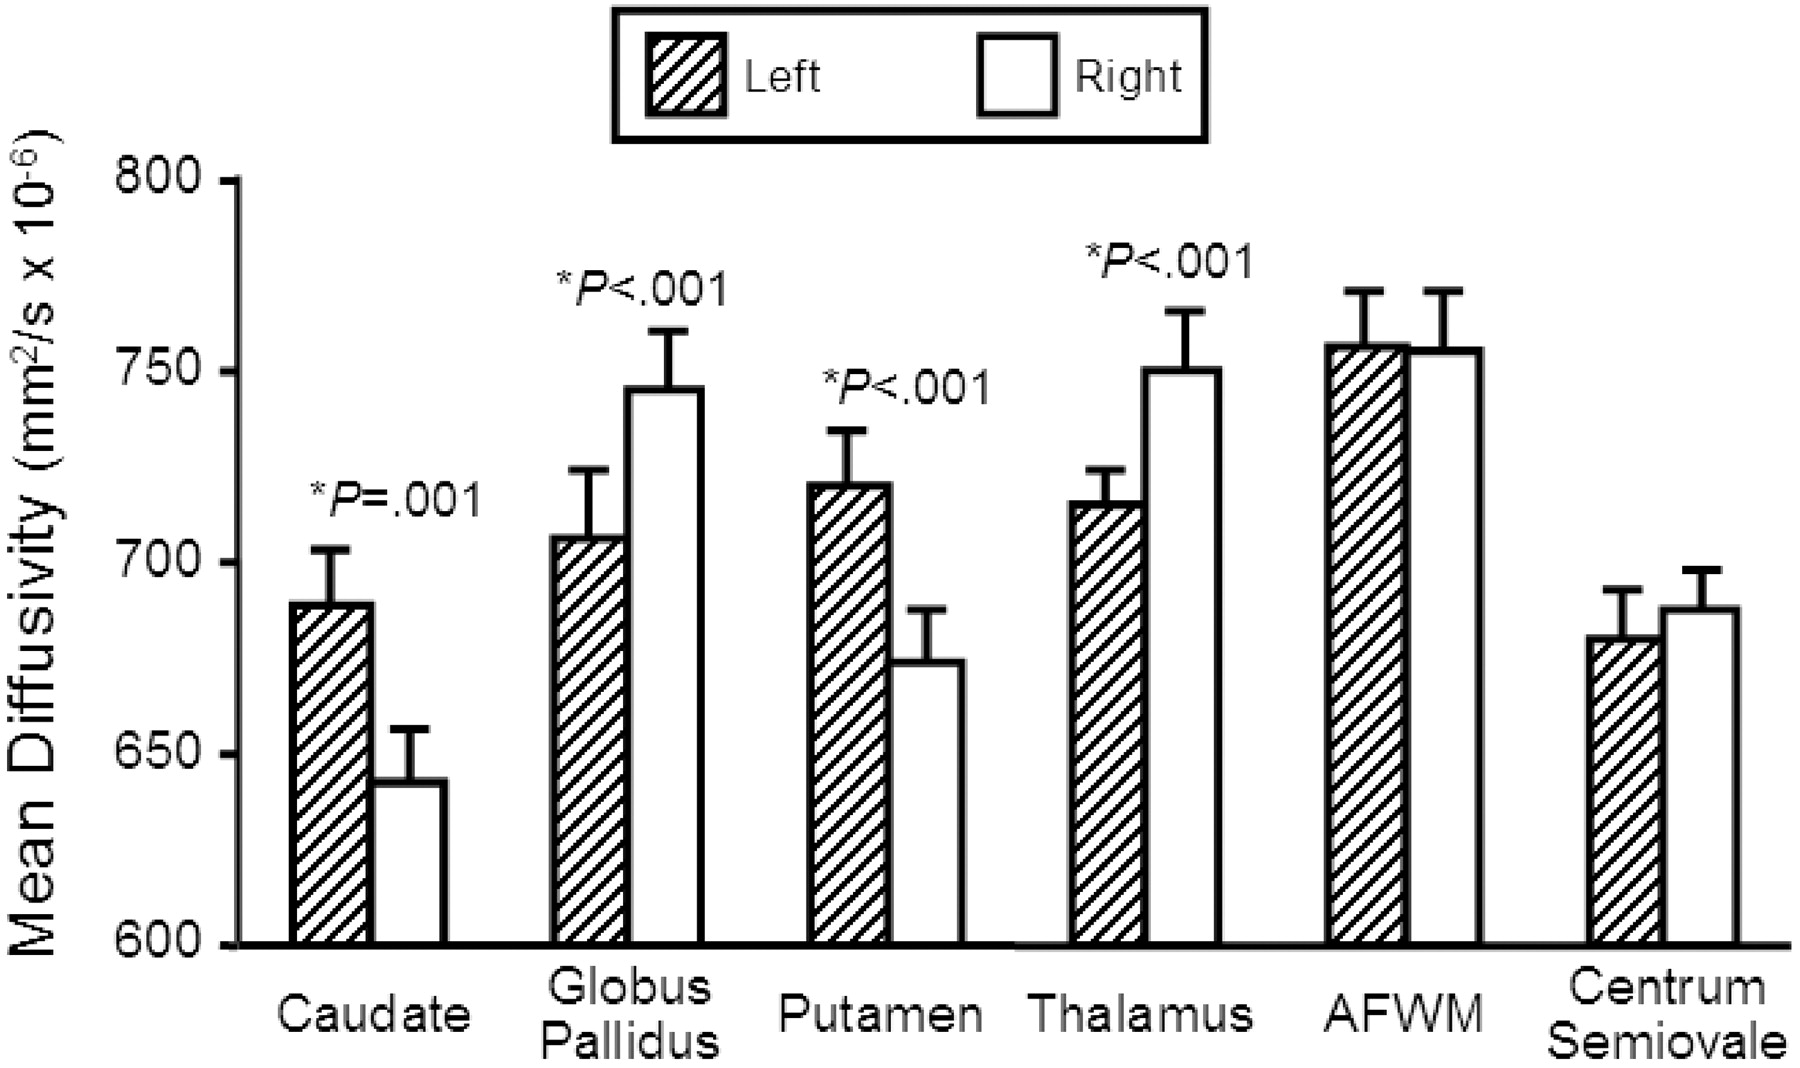
The main findings are summarized in Table and Fig 2. Mean diffusivities were significantly greater in the left (mean ± SD: 0.689 ± 0.069 mm2/s × 10−3) versus right (0.642 ± 0.071 mm2/s × 10−3) caudate (difference, P value: 7.0%, P = .001). Mean diffusivities were significantly greater in the right (0.745 ± 0.053 mm2/s × 10−3) versus left (0.706 ± 0.050 mm2/s × 10−3) globus pallidus (5.2%, P < .001). Mean diffusivities were significantly greater in the left (0.720 ± 0.059 mm2/s × 10−3) versus right (0.674 ± 0.052 mm2/s × 10−3) putamen (6.4%, P < .001). Mean diffusivities were significantly greater in the right (0.750 ± 0.040 mm2/s × 10−3) versus left (0.716 ± 0.031 mm2/s × 10−3) thalamus (4.5%, P < .001). No significant left versus right difference occurred in the CSF (right = 3.312 ± 0.524 mm2/s × 10−3, left = 3.356 ± 0.507 mm2/s × 10−3; 1.3%, P = .291), anterior frontal white matter (right = 0.755 ± 0.052 mm2/s × 10−3, left = 0.757 ± 0.042 mm2/s × 10−3; 0.2%, P = .834), or centrum semiovale (right = 0.688 ± 0.049 mm2/s × 10−3, left = 0.680 ± 0.054 mm2/s × 10−3; 1.1%, P = .320). Thus, the asymmetries were specific to deep gray matter structures and not seen in neighboring white matter structures or CSF. There was no significant difference in mean diffusivity between left and right-handed subjects in any structure (P value range, 0.169–.920). Thus, handedness could not account for the asymmetries.

Comparison of regional mean diffusivity values (mm2/s × 10−6) between the left and right hemisphere in 23 normal individuals. Those structures in which there was significant difference (P < .005) between hemispheres are marked with an asterisk and the P value is given. Bar heights indicate the mean, and error bars are standard error of the mean. AF WM, anterior frontal white matter.
Mean Apparent Diffusion Coefficient (ADC) Values of Gray Matter Structures in Normal Individuals
Discussion
This study shows that water diffusivity in subcortical (deep) gray matter structures, measured by DW imaging, differs significantly between hemispheres. In the caudate and putamen, diffusivities are greater on the left; in the globus pallidus and thalamus, diffusivities are greater on the right. No significant left-right differences in diffusivities were detected in the anterior frontal white matter, centrum semiovale, or CSF. Subject handedness could not account for the water diffusion asymmetry for any structure. The significant asymmetries in deep gray matter structures but not in white matter structures or CSF in close proximity to the gray matter strongly suggests that the findings are not an artifact but instead represent true biologic differences.
DW imaging is sensitive to water diffusion, the physical process of translational water molecule movement via thermally driven random motions (33). In a bulk water sample, the diffusion process is isotropic, but in biologic systems, such as the human brain, tissue microstructure provides barriers and creates compartments that limit molecular movement creating an anisotropic diffusion pattern. Because neuronal cell attenuation varies in different brain regions, water diffusion will also vary depending on which region of the brain is being measured. In this study, the diffusivity in subcortical structures was measured and compared with the homologous structure on the contralateral side, and a significant asymmetry was observed in the gray matter.
This asymmetry could be due either to a greater neuronal attenuation or to a greater number of reciprocal connections with neighboring brain regions on the side with reduced diffusivity. We tested whether some of the asymmetry was attributable to the preponderance of left hemisphere-dominant individuals and the laterality of language functions. We had only three left-handed individuals and, although handedness was not related to the asymmetries observed in this study, definitive conclusions on the relationship between handedness and the observed asymmetries cannot be drawn. Furthermore, a recent study of normal brains found greater diffusivities on the left versus right temporal lobe (49). These results argue against language centers in the left hemisphere accounting for higher neuronal densities and lower diffusivity. Previous studies using volumetric analysis of subcortical structures have been equivocal in assessing asymmetry (1, 3, 7, 12–14, 16–21, 24, 30, 31). It is unlikely that the noted asymmetries of diffusivity are due to technical factors related to the DW imaging technique employed, because the central location of the structures, their relative distinctness from surrounding brain tissue, and the lack of diffusion asymmetry observed in the CSF, anterior frontal white matter, and centrum semiovale points to the reliability of the measures. Although the possibility of false-positive results cannot be ruled out, these asymmetries should nonetheless be taken into account in the clinical realm when right versus left diffusivity is compared.
Our diffusivity values were obtained by using two b values (0 and 1000 s/mm2), which produce results similar to those obtained with six b values when measuring diffusion in the human brain (50, 51). Indeed, the use of just two b values is the most time-efficient way of measuring diffusivity when the diffusion coefficients are approximately known (52). Because we averaged diffusivity values measured in three orthogonal directions, to produce the mean diffusivity, our procedure produced a rotationally invariant measure of water diffusivity that is independent of any small differences in patient position (such as head tilt) with respect to the scanner coordinate system.
Deep gray matter structure DW imaging asymmetry was seen in the control group of a study evaluating thalamic changes in MS (22). The control group, however, was composed of referred patients with normal MR imaging findings, not normal volunteers. Our study extends those previous observations to other gray matter structures in a sample of true (healthy) normal volunteers. In both studies, significant asymmetries were observed. Further studies defining cortical cytoarchitecture and tractography of subcortical white matter fiber tracts may be helpful in understanding the structural relationships explaining the asymmetries we describe (53).
Most previous studies involving the measurement of diffusivities of gray matter structures in normal human brains have collapsed the regions of interest from the left and right side to obtain one number representing the bilateral diffusivity for the structure of interest (54, 55). Naganawa et al (49) analyzed normal brains to observe the effect of aging on diffusivity values and looked separately at the left and right hemispheres. When looking for laterality, they found left greater than right thalamic diffusivity in subjects 20–29 years of age, right greater than left thalamic diffusivity in subjects 30–59 years of age, and right significantly greater than left thalamic diffusivity in subjects 60–89 years of age. In their study, a single region of interest was placed directly on the mean diffusivity map in the medial thalamus. The present study also demonstrated significant right greater than left asymmetry in the thalamus. The thalamic regions of interest in our study were placed in the anterior and posterior thalamus and then collapsed, giving a value more representative of overall thalamic diffusion. These regions of interest were initially placed on the DW imaging scan, which provides better contrast in the areas being studied than does the mean diffusivity image. Another group examined diffusivities in the caudate, putamen, and thalamus and found no significant left-right asymmetry (56). A single thalamic region of interest was used in the study. A single, circular region of interest was also used in their study to obtain the diffusivity value for the putamen compared with our method of tracing the entire structure. Obtaining values from the anterior and posterior portions versus solely the medial thalamus and tracing the entire putamen may have allowed us to obtain a value more representative of the structure being studied and to reduce a potential sampling bias. The regions of interest used in our study were smaller than the single thalamic regions of interest, which allowed the structure of interest to be sampled while minimizing partial volume effects.
Diffusion asymmetry in subcortical gray matter structures has implications for research and clinical practice. The caudate, globus pallidus, putamen, and thalamus are the focus of imaging and pharmacologic research projects in a variety of nervous system disorders (7–28, 57–60). Normative interhemispheric differences must be established so that this asymmetry is not interpreted as pathologic in future studies. These left-right differences in diffusivity would manifest themselves either on DW imaging as differences in signal intensity or on ADC maps as differences in quantitative values. In a clinical setting, analysis of the diffusivity in unilateral deep gray matter lesions requires caution, particularly with the region of interest approach used in the present study, because significant differences in lesions compared with contralateral normal tissue may not always be pathologic.
Conclusion
Gray matter diffusivity may differ between hemispheres of the brain in healthy individuals. Analysis of deep gray matter lesions requires caution in both clinical and research settings, because statistically significant interhemispheric differences may not always be indicative of disease.
Footnotes
Supported by an Alpha Omega Alpha medical student research grant (to A.F.) and research grants from the National Institutes of Health NIH-NINDS one K23 NS42379-01 (to R.B.) and National Science Foundation DBI-0234895 (to R.B.).
References
- Received May 31, 2004.
- Accepted after revision October 12, 2004.
- Copyright © American Society of Neuroradiology


