
Abstract
BACKGROUND AND PURPOSE: Subdural empyema (SDE), an infection of the subdural space, occurs most often in pediatric patients as a complication of meningitis, sinusitis, or otitis media. Diffusion-weighted imaging (DWI) has been used in the past to investigate intracerebral infections. The purpose of this study was to determine the signal intensity characteristics of SDE on DWIs as well as the corresponding apparent diffusion coefficient (ADC) maps.
METHODS: MR studies of 10 patients with SDEs were retrospectively reviewed. Included were routine sequences and DWI, which consisted of an axial single-shot echo-planar spin-echo sequence (TR/TE, 4000/110) with b values of 0, 500, and 1000 s/mm2. Signal-intensity characteristics on routine MR images and DWIs were evaluated. In seven patients, ADC values of the lesions were calculated by using two b values. Follow-up imaging study was performed in seven patients.
RESULTS: In nine patients, the empyema was hyperintense on DWIs. In the remaining patient, the empyema showed mixed hyperintensity and hypointensity. ADC values were lower than those of normal cortical gray matter and much lower than those of reactive subdural effusions. In all seven patients with persistent clinical signs of infection, the empyemas were hyperintense on follow-up DWIs.
CONCLUSION: SDE had high signal intensity on DWIs and low signal intensity on ADC maps, with an ADC value lower than that of the normal cortical gray matter. Diffusion MR imaging can be valuable in distinguishing SDE from effusion and in the follow-up of subdural collections.
Subdural empyema (SDE) is an infection of the potentially extensible subdural space (1). In infants, SDE is most commonly a complication of purulent meningitis, while in older children, the source of SDE is typically direct extension of sinusitis or otitis media into the extracranial spaces (2, 3). SDE, which is associated with venous sinus thrombosis and thrombophlebitis, may cause cerebral abscess or infarction (4, 5). Early and accurate diagnosis, timely surgical intervention, and appropriate antibiotic therapy are the keys to a more favorable clinical outcome.
CT and MR imaging have been the mainstays of the imaging diagnosis of SDE (2, 6). A fluid collection surrounded by a contrast-enhancing rim is characteristic of SDE. MR imaging is superior to CT in demonstrating extra-axial fluid and its rim enhancement (2). However, no MR imaging features definitely distinguish SDE from reactive subdural effusion (RSE) (3, 7), which may also occur in the setting of meningitis or penetrating trauma or after cranial surgery.
The value of diffusion-weighted imaging (DWI) for the diagnosis of various intracranial infectious processes has been described (8–12). DWI has proved to be more sensitive than conventional MR in detecting the intra-axial involvement (8, 11). Reduced water diffusion can be found in the center of a brain abscess and is shown as increased signal intensity on trace images and decreased signal intensity on corresponding apparent diffusion coefficient (ADC) maps. This characteristic feature has also been reported in other pyogenic infections such as ventriculitis (13). One case report described the DWI features of SDE (14). However, reports in a series of DWI of SDEs are lacking in the literature. The purpose of this study was to determine the DWI characteristics of SDE and the role of DWI in the diagnosis and follow-up of inflammatory subdural collections.
Methods
We reviewed our imaging experience and found 10 patients with intra-axial SDE who had undergone conventional and diffusion MR studies between 1997 and 2003 (Table 1). They included seven male patients and three female patients aged 5 weeks to 17 years. The source of infection was meningitis in three patients, paranasal sinusitis in six, and mastoiditis in one. The diagnosis of SDE was made by means of craniotomy in five patients, burr-hole drainage in one, and clinical follow-up after antibiotic therapy in four. Follow-up MR studies were available in seven patients. Institutional review board approval for this study was obtained before the data were compiled.
Clinical features of 10 patients with SDE
All MR studies were performed on a 1.5-T system (Vision; Siemens, Erlangen, Germany). Conventional MR imaging sequences included: axial and sagittal spin-echo T1-weighted imaging (T1WI; TR/TE, 650/14), axial and coronal turbo spin-echo T2-weighted imaging (T2WI; 6000/99), and axial and coronal fluid-attenuated inversion recovery imaging (TR/TE/TI, 9000/119/2200). Postgadolinium images were obtained with axial, sagittal, and coronal spin-echo T1WI (800/20). A magnetization transfer (MT) pulse was applied after the administration of a gadolinium-based contrast agent. For all conventional MR images, the field of view was 20 cm, the matrix was 256 × 256, and the section thickness was 5 mm without an intersection gap.
Diffusion-weighted MR imaging was performed in all patients with an axial single-shot echo-planar spin-echo sequence (4000/110, 22-cm field of view, 96 × 200 matrix, 5-mm section thickness). The images were acquired with b values of 0, 500, and 1000 s/mm2. Three images were generated for each nonzero b value to give diffusion weighting in three orthogonal directions corresponding to the x, y, and z directions of the magnet. Images in the z direction were selected for analysis of signal intensity. ADC maps were generated for all patients on a pixel-by-pixel basis, and ADC values were calculated in seven patients according to the following equation: ADC = −[1/ (b2 − b1)]ln(SI2/SI1), where SI1 and SI2 are the signal intensity in the regions of interest (ROIs) obtained with two different gradient factors (seconds per millimeter squared) of b1 and b2, respectively (15).
Images with diffusion gradient factors of b = 0 and 1000 in the z direction were used to calculate the ADC values. One radiologist (A.M.W.) performed the quantitative ADC measurements by manually placing circular ROIs over the SDE on DWIs. The mean area of the ROI was 0.477 cm2. In patients with multiple lesions, the largest lesion was measured. Lesions were measured three to five times to obtain a mean value. ADC values of normal cortical gray matter were also calculated in the same fashion.
A two-tailed independent Student t test was used to assess the difference of mean ADC values between the normal and the lesion groups (normal cortical gray matter vs SDE, normal cortical gray matter vs RSE). A P value less than .05 (two-tailed) was considered to indicate a statistically significant difference.
Results
All 10 patients had reduced water diffusion in their SDE (Table 2). On DWIs, SDE showed high signal intensity in nine patients (90%) (Fig 1) and mixed hyperintensity and hypointensity in one (Fig 2). The mean ADC value of the seven SDE was 0.604 ± 0.18 mm2/s (mean ± SD) and lower than that of normal cortical gray matter (1.029 ± 0.175 mm2/s; P = .001). On T1WIs, the SDE were isointense in five patients (50%) (Fig 1), mildly hypointense in one (10%), and hypointense in four (40%) (Fig 2). On T2WIs, they were hyperintense in five patients (50%) (Fig 2), mildly hyperintense in four (40%), and isointense in one (10%) (Fig 1). Postcontrast T1WI showed smooth, linear, capsular enhancement in nine patients (90%) with SDEs (Fig 1) and irregular capsular enhancement in one (10%). The SDE showed mass effect on brain parenchyma in eight patients (80%).

Patient 8. Bifrontal and right parafalcine SDE.
A. Axial T1WI (650/14) shows slight hypointensity in the SDE (arrows).
B, Axial T2WI (6000/99) shows intermediate signal intensity in the bifrontal collections (arrows) and hyperintensity in the right parafalcine collection (arrowheads).
C, Coronal contrast-enhanced T1WI (800/20) with MT shows irregular capsular enhancement of the collections (arrows).
D and E, Axial DWI (4000/110, b = 1000 s/mm2) and ADC map show reduced water diffusion in the SDE.

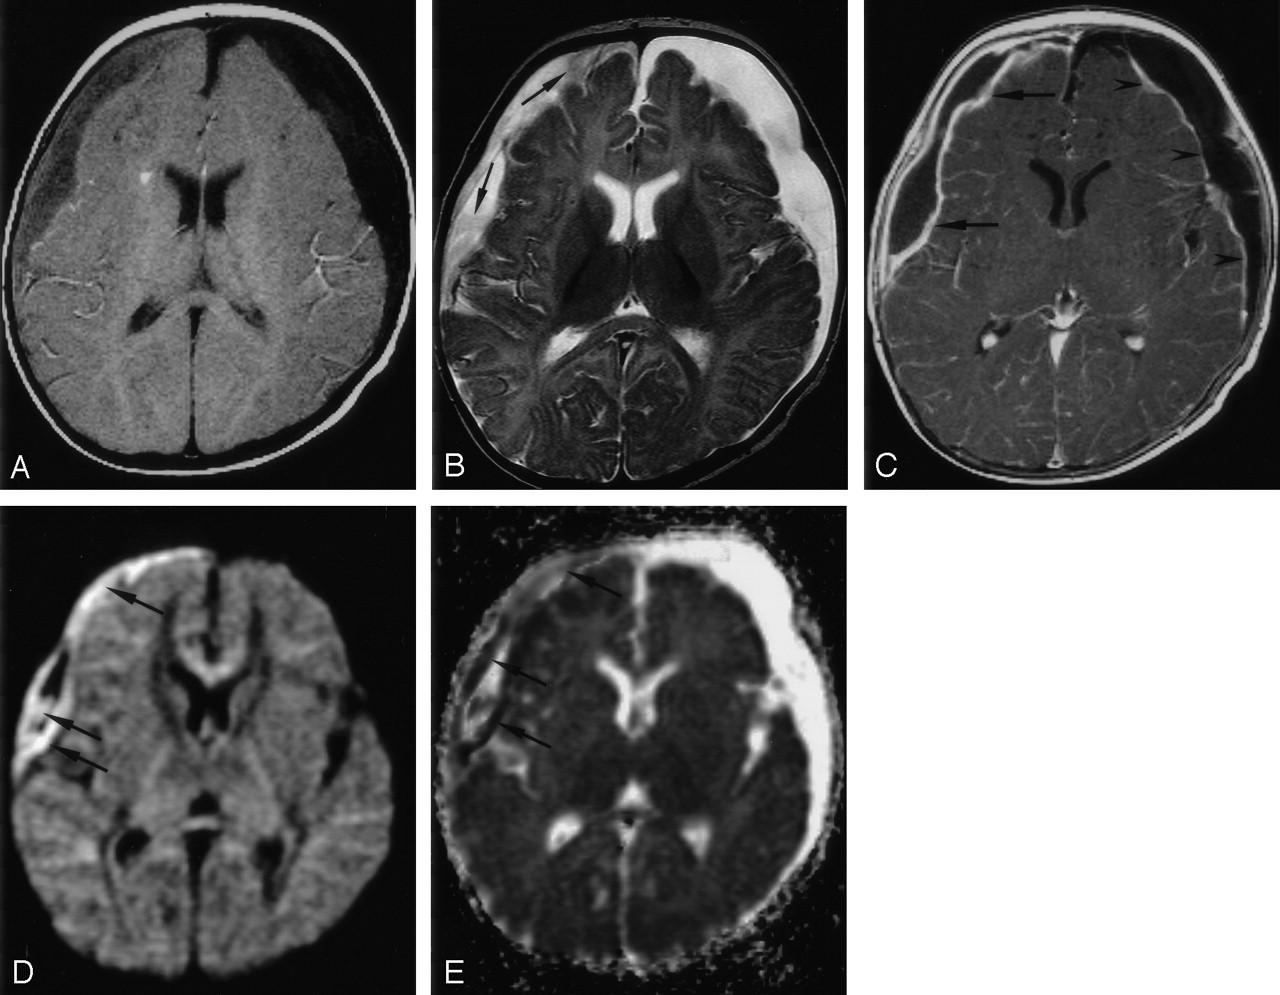
Patient 1. Right SDE and left RSE.
A, Axial T1WI (650/14) shows intermediate signal intensity in the right SDE and hypointensity in the left RSE.
B, Axial T2WI (6000/99) shows high signal intensity in both subdural collections. Strands of intermediate signal intensity (arrows) are noted in the right SDE.
C, Axial contrast-enhanced T1WI (800/20) with MT shows peripheral enhancement of both subdural collections. The enhancement is thicker in the right SDE (arrows) than in the left RSE (arrowheads).
D, Axial DWI (4000/110, b = 1000 s/mm2) shows mixed high (arrows) and low signal intensities in the right SDE.
E, Corresponding ADC map shows mixed low (arrows) and high signal intensities in the right SDE, indicating heterogeneous water motion. Increased water motion is noted in the left RSE.
Initial and follow-up imaging findings in 10 patients with SDE
RSE were also present in two patients (patients 1 and 7) and showed low signal intensity (Figs 2 and 3) on the DWIs and high signal intensity (Fig 2) on the corresponding ADC maps; this indicated increased water motion. The mean ADC value of the RSE measured 3.332 ± 0.237 mm2/s and was significantly greater than that of normal cortical gray matter (P < .001). The RSE was hypointense on T1WIs and hyperintense on T2WIs and showed no mass effect on brain parenchyma in these two patients.

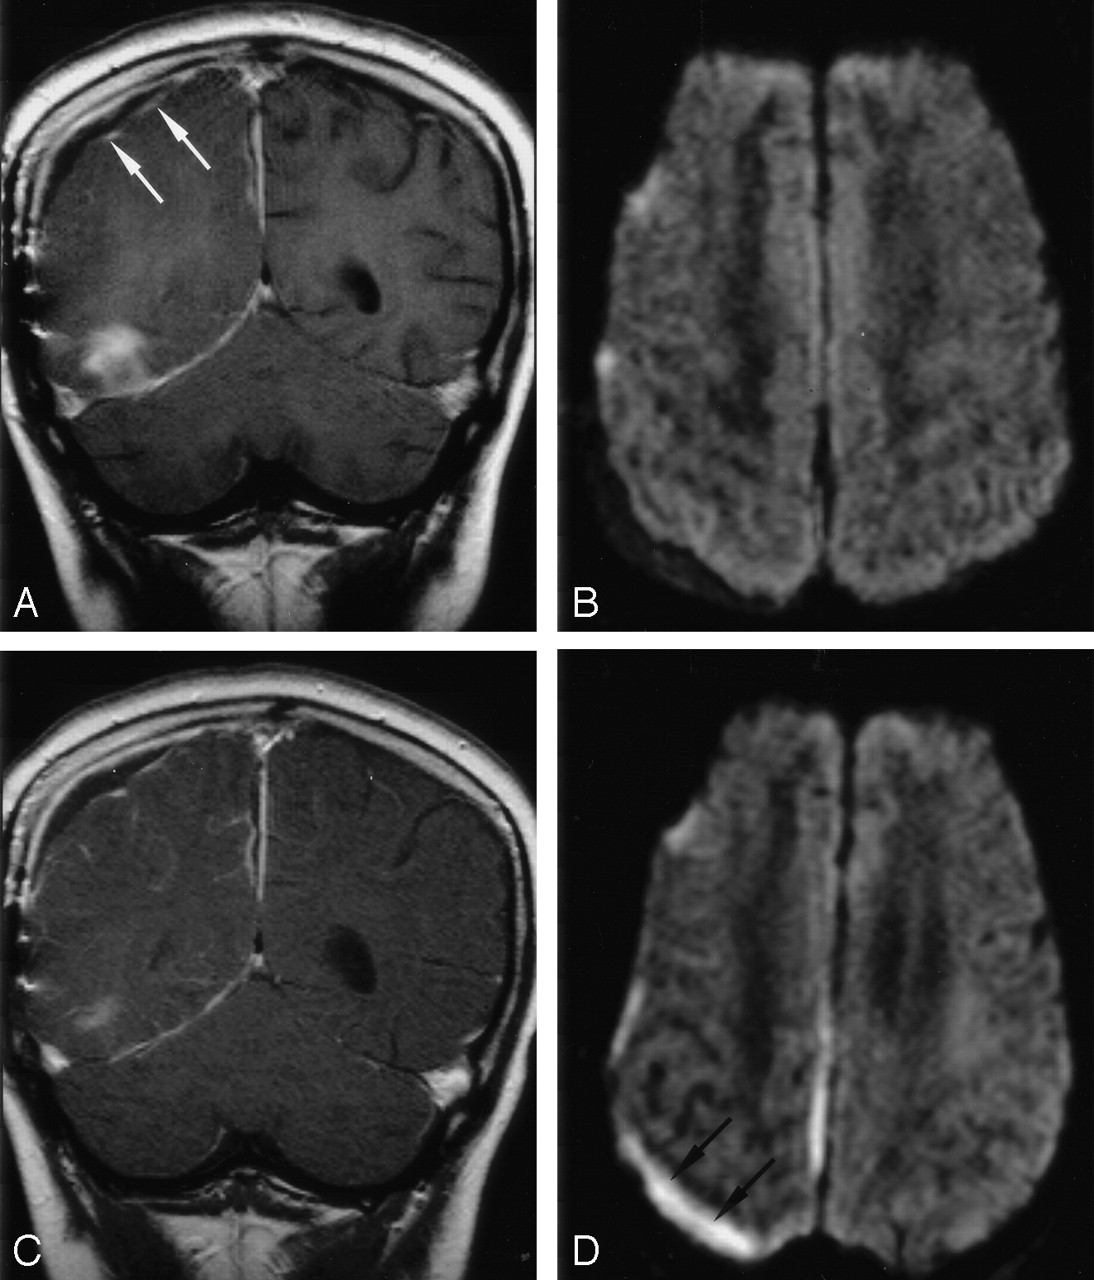
Patient 7. Follow-up DWI show superimposed infection of a right RSE in this 10-year-old boy with right temporal and parafalcine SDEs.
A, Coronal contrast-enhanced T1WI (800/20) with MT shows capsular enhancement (arrows) of the right parietal subdural collection and the anterior aspect of the right temporal base SDE.
B, Axial DWI (4000/110, b = 1000 s/mm2) shows increased diffusion in the collections.
C, Follow-up coronal contrast-enhanced T1WI (800/20) with MT shows no substantial change in the capsular contrast enhancement of the collection.
D, Follow-up axial DWI (4000/110, b = 1000 s/mm2) shows increased signal intensity in the collection (arrows) and the interhemispheric fissure, suggesting superimposed infection.
In the seven patients with follow-up imaging studies, the SDE remained hyperintense on DWIs in all (Table 2). All had persistent clinical signs of infection at the time of the follow-up study. In addition, the right-sided RSE in patient 7 became hyperintense on the follow-up DWIs (Fig 3) and hypointense on the corresponding ADC maps, concerning for superimposed infection. However, postcontrast T1WI showed no change in the degree and extent of the contrast enhancement of this subdural collection (Fig 3).
Discussion
An SDE is composed of small abscesses in the subdural space (1). Microscopically, it has the same composition as an abscess, consisting of pus, inflammatory cells and granulation tissue. Previous reports have shown that abscesses generally have reduced ADC values due to reduced water diffusion (9–12). Furthermore, it has been suggested that the high viscosity of the pus within an abscess cavity is responsible. Therefore, we hypothesized that empyemas could have the same diffusion characteristics as abscesses.
One patient in our series had SDEs of heterogeneous DWI signal intensity. We speculate that this signal-intensity heterogeneity may have been related to three unusual clinical features in this patient. First, he had an unusually low white blood cell count. Second, the responsible pathogen was Escherichia coli, which can produce mixed acids and gas through anaerobic fermentation. Third, he had the longest disease course among the patients; this may have allowed for the coexistence of newly and chronically infected materials.
DWI may be helpful in the imaging follow-up of subdural collections and appears to provide definite and specific information about the nature of the collection. In cases with clinical progression of the infection, as in patient 7, DWI tended to show changes of the lesions earlier than did contrast-enhanced T1WI on follow-up imaging (Fig 3). Pathologically, the enhancing capsule represents an inflammatory membrane of granulation tissue (6, 16). This forms in the late stages of the infection (1), and therefore, capsular enhancement is unusual when imaged early (3). The time needed for the granulation tissue to resolve may also explain the persistent enhancement of the subdural collection, even if the infection appeared to be resolving.
RSE is a frequent complication of meningitis, especially in infants. It is due to tears in the arachnoid membrane leading to CSF leakage in the subdural space (1). In patients with meningitis, differentiating between SDE and RSE is critical, as RSE tends to spontaneously regress (3), whereas SDE generally requires aggressive intervention. This differentiation can occasionally be difficult based on conventional imaging characteristics alone. At MR imaging, both may be hyperintense on T2WI, and both may show enhancement on postcontrast T1WIs along the cerebral surface of the lesion (3, 16, 17). In patient 1, both subdural collections had capsular contrast enhancement, though the enhancing rim of the right SDE was thicker than that of the left RSE (Fig 2). DWI may aid in distinguishing these two processes. Moreover, DWI may be useful in the follow-up of RSE, particularly if secondary infection is a clinical concern.
Because of its high sensitivity to off-resonance effects and inhomogeneities in magnetic field, echo-planar diffusion imaging is particularly susceptible to artifacts from paramagnetic objects (18). These susceptibility artifacts can be most commonly observed at the brain surface near the skull base, the frontal sinuses, or other areas with an air-brain interface. Therefore, it could be difficult to differentiate SDE from artifact solely on the basis of DWI findings. In all MR applications, distinguishing true findings from artifact requires careful interpretation of conventional MR images, DWIs/ADC maps, in their proper clinical context.
Limitations in our study include the small number of patients and the lack of microbiological confirmation of the SDE in some patients.
In conclusion, we have shown that SDEs have reduced diffusion with an ADC lower than that of normal cortical gray matter. We speculate that this finding may be due to the viscosity of the empyema. We recommend the use of DWI to aid in the diagnosis and follow-up of inflammatory subdural collections.
Acknowledgments
We thank Morris M. F. Wu for his invaluable help in the statistical evaluation.
References
- Received June 20, 2003.
- Accepted after revision December 22, 2003.
- Copyright © American Society of Neuroradiology
In this issue


Jump to section
Related Articles
Cited By...
- Subdural and subarachnoid empyema as a complication of an acute meningococcal meningitis
- Subdural empyema in bacterial meningitis
- Role of imaging in the diagnosis of acute bacterial meningitis and its complications
- The clinical challenge of recognizing infratentorial empyema
- Unusual findings in cerebral abscess: report of two cases.