
Abstract
Summary: We applied computational fluid dynamic (CFD) analysis on the numerical grid of a 3D rotational digital subtraction angiogram obtained in a 22-year-old male patient, with an accidentally discovered vein of Galen malformation associated with single feeder aneurysm, to understand the flow pattern through the two aneurysms and improve our general understanding of hemodynamic characteristics of this variety of fusiform aneurysm. This technical note provides a good example of the application of CFD to 3D digital subtraction angiography for studying the flow pattern in patients with cerebrovascular disease.
Vein of Galen aneurysm malformations (VGAMs) are rare congenital anomalies that often manifest in the neonatal period with apparent congestive heart failure. During infancy, progressive head enlargement from hydrocephalus, seizures, encephalomalacia, and subcortical calcification may be seen (1–5). VGAMs are rare in older children and adults, but older patients present with headache, or occasionally, subarachnoid hemorrhage (6–8).
The association of an adult VGAM with a fusiform arterial aneurysm in asymptomatic patients has motivated us to create a computational model from 3D rotational digital subtraction angiography and apply computational fluid dynamic (CFD) analysis to study the hemodynamic pattern of this anomaly.
Case Presentation
A 22-year-old male patient presented to our hospital reporting mild head trauma. MR imaging revealed no abnormal findings apart from a large midline sac on T2-weighted MR images, with no apparent clinical symptoms related to it.
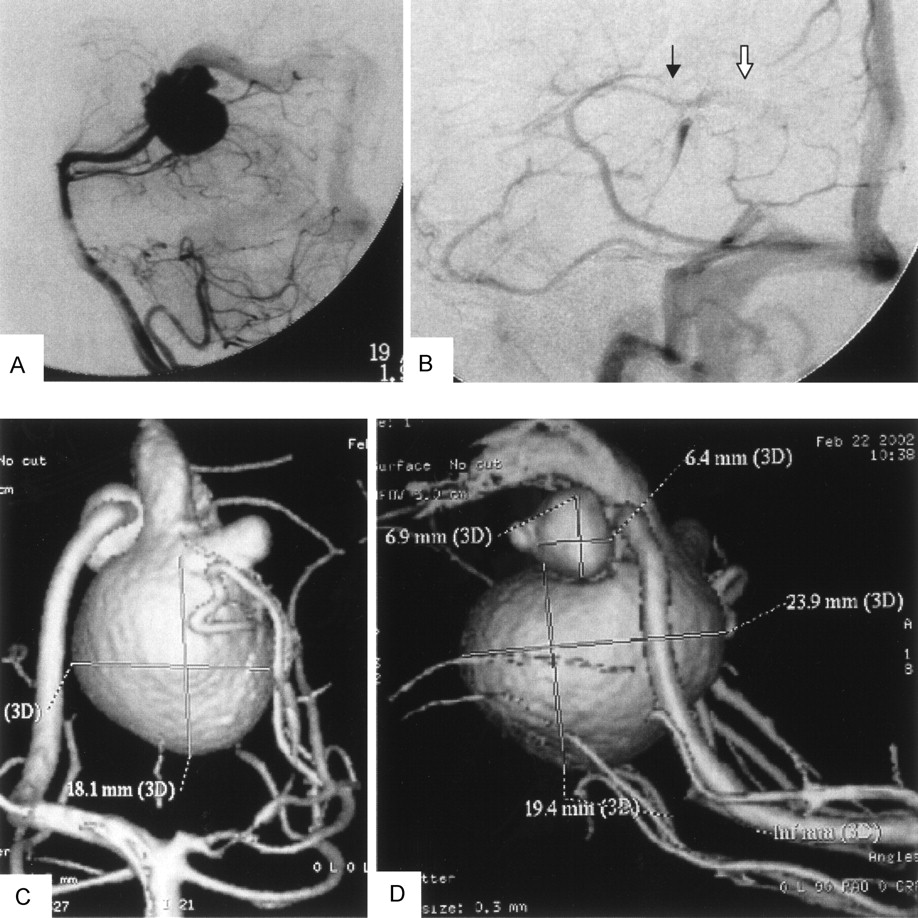
Angiographic studies demonstrated a mural VGAM supplied by a single feeder from the medial posterior choroidal artery (MPChA), as shown in Fig 1.

Left vertebral angiography (arterial phase, lateral view) showing VGAM supplied from medial posterior choroidal artery and drained to an old embryonic falcine sinus (A). Panel B (internal carotid angiogram [venous phase, lateral view]) shows the venous drainage pattern of the patient after endovascular aneurysm embolization. Normal drainage of the internal cerebral vein (black arrow) to the median prosencephalic vein and then into the accessory embryonic falcine sinus (white arrow) is evident. Rotational 3D digital subtraction angiography with volume rendering, anteroposterior (C) and lateral (D) views, show the feeding artery from MPChA, MPChA aneurysm, and preaneurysmal stenosis. Greatly dilated old embryonic median prosencephalic vein and an associated hypoplastic left posterior cerebral artery are also clearly seen.
We decided to treat the patient by means of transarterial embolization with Guglielmi detachable coils (GDCs) and n-butyl cyanoacrylate (NBCA) injection. The transarterial approach was performed via the right femoral artery by using a 6F femoral sheath; the patient was under general anesthesia and complete heparinization. A 6F guiding catheter (Envoy; Cordis, Miami Lakes, FL) was placed in the left vertebral artery, and a microcatheter (Prowler; Cordis) and guidewire (GT 12, Terumo, Japan) were used to navigate the MPChA. Coil embolization of the arterial aneurysm was done by using 12 GDCs of variable sizes, followed by injection of 0.03 mL NBCA (40% diluted in lipiodol).
Computational Analysis*
Rotational Angiography
We analyzed 3D rotational digital subtraction angiography data by use of commercially available software (Advantx UNV; General Electric [GE] Medical Systems, Milwaukee, WI) installed on a workstation (Advantage Workstation 3.1; GE Medical Systems); 3D data sets were obtained from rotational series consisting of two rotations. The first provided the subtraction mask. The C-arm was rotated 200° within 5 seconds at the exposure rate of 8.8 frames per second. A total of 44 images with matrix size of 512 × 512 pixels were acquired. The second rotation was performed during the administration of contrast material. Seventeen milliliters of contrast medium were automatically injected at a flow rate of 3 mL/s through a catheter positioned in the left vertebral artery by using a power injector (Medrad Mark V Plus; Sugan, Osaka, Japan). All 88 images of the mask data and contrast data were immediately transferred to the workstation for volume analysis via the network. A 3D reconstruction algorithm based on algebraic reconstruction technique was used to digitally produce the 3D digital subtraction angiograms on the workstation within 8 minutes. Reconstructed images including maximum intensity projection (MIP), surface-shaded display (SSD), and virtual endoscopic images were created from the data. Algorithms used were MIP and SSD at an isosurface with mean threshold value of 1100 HU.
The SSD image displayed on the monitor in 10-cm displayed field of view (DFOV) is subjected to reformatting into 460 transverse regularly spaced sections with 0.2-mm distance between the sections and with a section thickness of 0.3 mm (which is equal to 1 voxel size) as shown in Figure 2A. The batch function of the volume analysis allows setting up such a set of images rapidly. It is possible to preview the set as an animated sequence (movie loop) and save it on the image disk in secondary DICOM format. At the end of this stage, we have a separate DICOM file for each section of data that represents a cross section in the 3D image, as shown in Fig 2B.

Detailed procedure of image reconstruction.
A, Reformatting protocol of the angiographic image into 460 secondary DICOM sections in 10-cm DFOV.
B, Examples of the sequential secondary DICOM sections including sections of the two aneurysms and most distal part of MPChA.
C, Raster gray scale 3D binary image output by (X) MedCon to AVS/Express. Note that the columns around the image are the patient’s data and image parameters. Under AVS/Express, image manipulation and cutting out of the region of interest is done as shown in panel D. The figure in panel D is the STL file output from AVS/Express to ICEM CFD. Panel E demonstrates the STL file in its mesh form in ICEM CFD. Finally, mesh reconstruction, smoothing, and closure of the inlet and outlet are done by using the mesh generator ICEM CFD before volume mesh generation and CFD calculation with Fluent on the tetrahedral mesh illustrated in panel F.
DICOM Reader
All secondary DICOM files must be concatenated (ie, using the “concatenate” command under Unix) in a single file that is to be read by the DICOM reader. We use the X-windows medical image conversion utility (X) MedCon (version 0.5.10), because it can output DICOM files into raw binary or ASCII formats. The conversion always uses the original image dimensions and pixel values. The binary output format includes binary image data as well as all other information contained in the original section image files (such as the image size, patient’s name, etc.) that is to be cut in the next stage by using AVS/Express. The resulting binary file is in fact a 3D raster grayscale image, as shown in Fig 2C.
AVS Express Visual Tool
The main role of AVS/Express visual development tool (version 5.1, Advanced Visual System Incorporation) is to extract the region of interest in blood vessel surface data and output it to the mesh generator in the suitable file format.
Under AVS/Express, the full 3D image may undergo adjustments to cut out the region of interest by removing the patient data and parameters written around the image to increase the computational processing speed and, finally, write an output file in the STL (stereolithography) format, as shown in Fig 2D. The STL format can be used as geometry input format in most modern commercial grid generators. The basilar artery has been cut out in this step to decrease the computational time of the CFD code.
Grid Generator
The grid-generation software ICEM CFD version 4.1 (ICEM CFD Engineering) is used to discretize the computational domain with unstructured tetrahedral boundary-fitted mesh containing 77,696 nodes and 384,129 tetrahedrons.
The grid generator allows cutting out unnecessary parts like small vessels not related to the region of interest and closing the computational domain by defining inlet, outlet, and wall boundaries to finally define the region of interest on which CFD will be applied, as shown in Figs 2E and F. Our region of interest is the two aneurysms and the preaneurysmal stenotic area, so we deleted the basilar artery (done in the previous step by AVS/Express) and set the inlet boundary condition in the MPChA as far as possible from the region of the two aneurysms and the outlet boundary condition as far as possible from the venous aneurysm in the falcine sinus.
Interactive modifications of grid node coordinates can be done as well. Finally, mesh smoothing allows further improving of the quality of the grid. The number of grid nodes or tetrahedrons should be chosen as a reasonable compromise between better accuracy and shorter computational time of subsequent simulations.
CFD Calculation
The governing equations for CFD calculation are the 3D incompressible unsteady Navier-Stokes equations written in strong conservative form for mass and momentum. They are discretized with a finite-volume method and solved in time-marching manner by using the pseudocompressibility technique. The simulation was performed with the following material constants: blood density, 1060 kg/m3 and dynamic viscosity, 0.004 Poiseuille. Blood is considered as a Newtonian fluid. Because the governing equations and boundary conditions include only pressure gradient, the simulation produced relative pressure values to be considered with respect to a basal pressure.
The software Fluent (version 6.0.12; Fluent, Inc.) was applied to solve the physiologic pulsating flow in our model. The boundary condition at the inflow boundary of the MPChA was based on the pulsatile periodic flow rate obtained by transcranial ultrasonography (GE Medical Systems) of the posterior cerebral artery, which amounted to a mean velocity of 0.75 m/s. On the vessel walls, which are considered rigid, we applied the nonslip and nonpenetration conditions (ie, all velocity components at the vessel walls were set to zero). For the outlet, Fluent’s outflow boundary condition was used.
The SIMPLE method for solving the discretized equations was chosen. The unsteady flow was computed with a time step of 0.025 seconds for a time interval of 3 seconds (over three cardiac cycles). The time step was found to be sufficient from the point of view of accuracy. The results corresponding to the last, third cycle were considered independent from the initial conditions and used for the flow analysis.
The calculation condition required approximately 12 hours on a single processor of SGI Origin 2000 (Silicon Graphics, Inc.). To improve the convergence speed, relaxation factors were applied to velocity and pressure modifications.
Video depiction of the Fluent’s results (Fig 3) was performed by means of Ensight software (version 7.3.0; Computational Engineering International, Inc.). Ensight is general-purpose postprocessing software used in engineering and scientific postprocessing. It can work on all major computing platforms. We used it for creating a video of the unsteady blood flow through both aneurysms, as shown in Fig 3C.

A, Left vertebral angiography (left oblique view; arterial phase), revealing the linear contrast stream through the hole between the two aneurysms. B, Computational grid representing the VGAM provides an endoscopic view (the front wall of the arterial aneurysm is removed) demonstrating the hole between the two aneurysms. C, One movie frame of typical instant streamlines colored according to the velocity values (in m/s). Compare the linear stream entering the venous aneurysm with its angiographic representation in the upper image.
Discussion
Endovascular treatment of intracranial aneurysms has advanced significantly in the past 10 years. This has led to a greater need to understand the hemodynamic map of various cerebrovascular diseases. Several researchers have studied the hemodynamic factors beyond the formation and growth of intracranial aneurysms (9–15). Most of these articles have concentrated on the sidewall and bifurcation aneurysms. The hemodynamic patterns of fusiform aneurysms have not been adequately studied in the literature. The interpretation of the three hemodynamic determinants in our patient, which are the preaneurysmal stenosis, the arterial aneurysm, and the venous aneurysm, is the goal of CFD analysis.
During the angiography, we noticed that the smaller arterial aneurysm has the same contrast filling time as the arterial feeder. It communicates with the large venous aneurysm by a narrow hole through which linear contrast stream passes (as seen in Fig 3A) to fill the second, large aneurysm whose filling is comparatively delayed after the arterial phase. The large aneurysm is washed out faster than the nearby normal veins.
Detailed inspection of the computational replica representing the VGAM geometry revealed a narrow hole between the two aneurysms through which a linear contrast stream passes, as shown in Fig 3B. This may explain why this patient did not suffer from the usual symptoms of a VGAM anomaly, such as heart failure, encephalomalacia, or subcortical calcification, which are attributed to the presence of a high flow shunt in the brain. This suggests that the shunting volume of blood through this narrow hole is low, giving the patient’s brain the chance to acquire a normal deep venous system pattern, as shown in Fig 1B (that is unusual in these cases [16]) and have normal growth of brain cells. This patient grew up without symptoms and was progressing well as an intelligent university student.
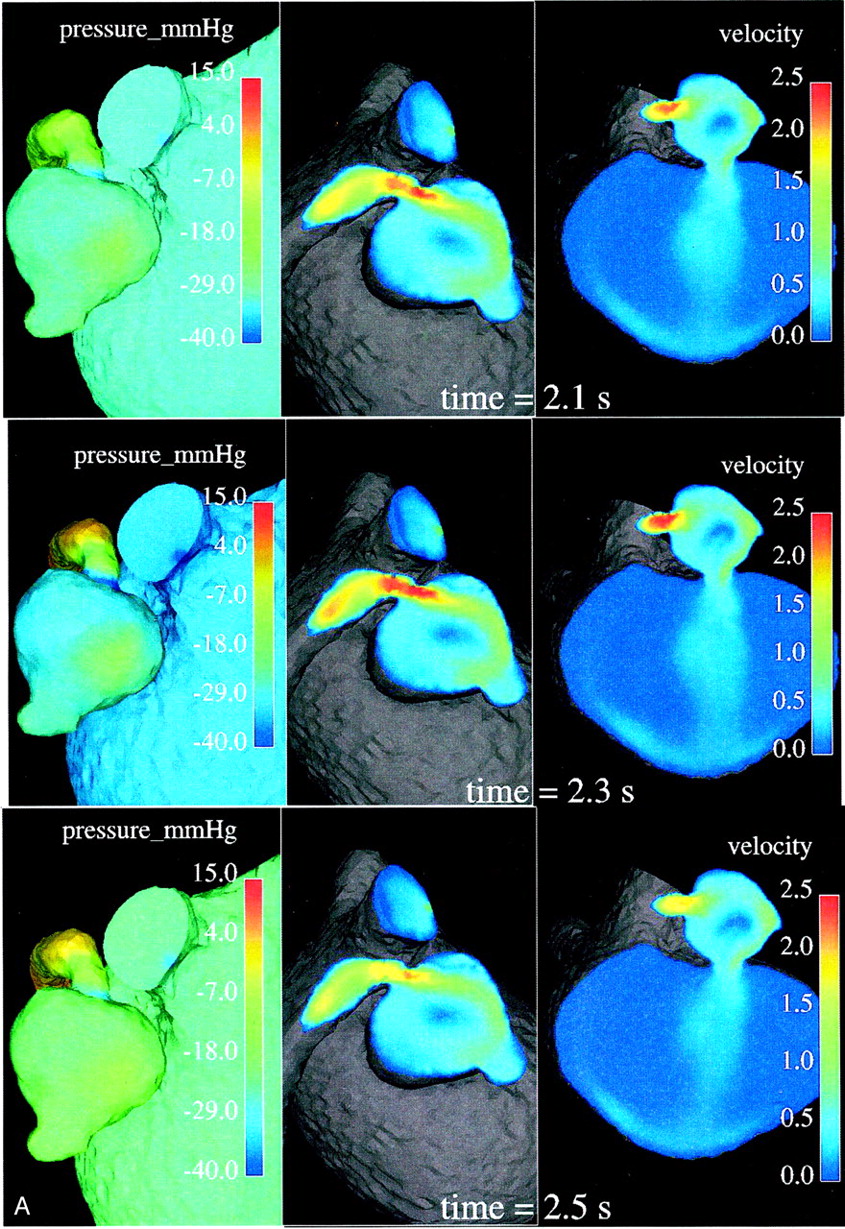
In a normal cardiovascular system, blood vessels narrow or dilate smoothly and gradually, resulting in the respective gradual variations of pressure and velocity. In diseased states such as stenosis, however, the Bernoulli affect becomes quite marked: the smaller cross section of the stenotic segment results in much higher velocities and a significant drop in pressure. A velocity value range of 1.48–2.15 m/s, with a mean value of 1.83 m/s, was observed numerically in the stenotic segment. These values are very high compared with the velocity values calculated in the parent artery or even in any part of the geometry all over the cardiac cycle. This is illustrated by the central and right images in Fig 4, whereas the left images clearly show the abrupt pressure decrease along the stenotic segment, with the minimum pressure at its exit into the arterial aneurysm.


Relative surface pressure maps (left images; in mm Hg) for both aneurysms and MPChA at different time moments of one cardiac cycle show marked pressure variations in the arterial aneurysm caused by the jet coming from the parent artery stenosis. High-pressure areas all over the cardiac cycle are seen opposite of the stenotic artery entry hole. Central and right images demonstrate the blood velocity (magnitude; in m/s) maps in two cross sections and outflow boundary.
The increased velocity of flow through the stenotic segment makes the blood stream rush from the stenotic area in the form of a jet. This jet subjects the wall of the aneurysm to high pressure (see the higher-pressure spot on the aneurysm wall facing the jet over one cardiac cycle in the left-side images of Fig 4) and shear stresses when it impinges on the wall at an angle and propagates along it. Such permanently applied high pressure and shear stresses may contribute to the growth of the aneurysm and cause structural fatigue, which may pose some risk for its rupture. Such a mechanism may explain why we found an arterial aneurysm just past the stenotic area, the so-called poststenotic dilatation.
Variations of pressure over one cardiac cycle on the walls of the arterial and venous aneurysms may be seen in the left-side images of Figure 4. One can conclude that the wall pressure variations are quite marked for the arterial aneurysm, whereas pressure on the venous aneurysm walls is much more uniform, showing rather minor variations only in a small area just opposite its entry hole (not visible in Fig 4, left). It seems that the smaller arterial aneurysm works as a kind of safety valve for the large venous aneurysm, offering protection from pressure variations and regulating a low shunt surgery volume of blood flowing through the narrow hole to the venous aneurysm. It is also seen in Figure 4 that the pressure in the venous aneurysm is the lowest in the entire computational domain. One may speculate that it is not high enough to cause apparent radiologic venous reflux to the deep venous system.
The images in Figures 3C and 4 clearly reveal that the high-speed blood jet enters the arterial aneurysm from the stenotic arterial segment, hits the opposite aneurysm wall at an angle, and moves further along the wall toward the hole between the aneurysms. It then splits into two parts. One of them forms a whirling, rotating, circulatory motion inside the small arterial aneurysm. The other passes through the narrow hole directly into the venous aneurysm as a linear, straight jet flow. The main features of the flow in the vascular system under investigation include the high-speed jet formed in the stenotic segment and entering the arterial aneurysm, a circulatory motion inside the arterial aneurysm, and a straight jetlike flow entering the venous aneurysm. Understanding the flow structure helps us to interpret what happened during the subsequent endovascular intervention.
In our patient, GDCs filled the arterial aneurysm entirely and successfully eliminated the whirling flow inside the aneurysm; however, because of high blood velocities in the stenotic segment, they could not terminate the blood influx completely. Therefore, blood flow found its way around the coils and the jetlike linear flow entering the venous aneurysm through the hole was still observable. After full arterial aneurysm packing with 12 GDCs, the microcatheter was withdrawn slightly and N-butyl cyanoacrylate (NBCA) was injected to secure the occlusion of the stenotic segment of MPChA and stop the blood flow coming from it. In fact, the operator (A.T.) was obliged to inject NBCA to secure the stenotic segment occlusion; otherwise the jet would not stop. We concluded prospectively from this experience that occlusion of the preaneurysmal stenotic segment to stop the high-speed blood jet coming from it is an essential step in this patient radiologic cure.
Our approach for image extraction is very general (17); it works with any 3D image data in DICOM format as the source of original information and as a result produces grid output for virtually any commercial CFD software. It should be noted that some software packages used in our grid-generation procedure may possibly be substituted for others having similar functions, if they are more readily available to a particular user. In the future, it is also possible that some stages of the procedure will be combined within some new software; however, the main stages of our method and their sequence are to be kept.
Conclusion
Application of CFD on the computational model representing this anomaly helped us to understand its special hemodynamic pattern that was well correlated to our observations during the angiographic and endovascular treatment procedures. CFD helped us to understand why this patient escaped the usual presenting symptoms of VGAM. This case study may indicate the future promising role of application of CFD on the 3D rotational angiography to understand the hemodynamic profile in patients with cerebrovascular diseases.
Footnotes
↵* To view a live simulation of the numerical analysis described herein, go to http:\\ivns.med.tohoku.ac.jp/galenmovie.html. For technical assistance, contact Akira Takahashi at [email protected].
References
- Received December 16, 2002.
- Accepted after revision January 16, 2003.
- Copyright © American Society of Neuroradiology
In this issue


Jump to section
Related Articles
Cited By...
- Youre so vein, you probably think this models about you: opportunities and challenges for computational fluid dynamics in cerebral venous disease
- Effect of Bifurcation Angle Configuration and Ratio of Daughter Diameters on Hemodynamics of Bifurcation Aneurysms
- Risk Analysis of Unruptured Aneurysms Using Computational Fluid Dynamics Technology: Preliminary Results
- Computational Simulation of Therapeutic Parent Artery Occlusion to Treat Giant Vertebrobasilar Aneurysm