
Abstract
BACKGROUND AND PURPOSE: Blood vessels are usually conspicuous on dynamic CT perfusion images. The presence of large vessels may lead to overestimation of the quantitative value of cerebral blood flow (CBF). We evaluated the efficacy of the vascular-pixel elimination (VPE) method in quantitative CT perfusion imaging, in comparison with positron emission tomography (PET).
METHODS: Five healthy volunteers underwent CT perfusion and PET studies. A four-channel multi-detector row CT scanner was used. Dynamic cine scanning was performed after bolus injection of an intravenous contrast agent. CT-CBF was calculated by the central volume principle and deconvolution method. PET was performed after infusion of 15O-labeled water. PET-CBF was calculated by using a nonlinear least squares method. Average CBF values of the whole section, gray matter, and white matter with both CT and PET were compared after image registration. The comparison was performed with and without VPE. In the VPE method, the vascular pixels were defined by the cerebral blood volume value of the pixel. The threshold of VPE was changed from 5 to 20 mL/100 g. Pixel-by-pixel correlation between CT-CBF and PET-CBF and linear regression analysis were also performed.
RESULTS: Without VPE, CT-CBF was overestimated in all subjects. As the VPE threshold decreased, CT-CBF decreased and the correlation coefficient increased. The best correlation was observed at a VPE threshold of 8 mL/100 g in four of the five subjects. Average CT-CBF values, without VPE, of the whole section, gray matter, and white matter were 59.01, 66.73, and 42.53 mL/100 g/min, respectively. With VPE (threshold, 8 mL/100 g), average CT-CBF values of the whole section, gray matter, and white matter were 45.56, 52.75, and 30.38, respectively. The corresponding PET-CBF values were 46.86, 50.89, and 38.20 mL/100 g/min, respectively.
CONCLUSION: Vascular pixels should be excluded from the calculation of CT-CBF to avoid overestimation of the CBF values. If vascular pixels are excluded, CBF calculation with CT perfusion imaging is considerably accurate.
Severity and extent of brain tissue ischemia can be assessed with cerebral perfusion imaging (1, 2). In patients with acute stroke, information regarding blood perfusion could be helpful in assessment of potential benefit of thrombolytic therapy (3–5) and in predicting final infarct size (2, 5, 6).
Cerebral perfusion can be measured by using several methods, such as positron emission tomography (PET) (7–9), single photon emission CT (SPECT) (10), xenon-enhanced CT (11), and MR imaging (12–14). Among these techniques, PET and SPECT have been used to measure cerebral perfusion in vivo for more than a decade, and PET is accepted as the current standard of reference for the in vivo assessment of cerebral blood flow (CBF) and brain metabolism (8). However, high cost and limited accessibility have restricted the widespread clinical use of PET.
Compared with the above-mentioned imaging modalities, dynamic CT perfusion imaging has a number of practical advantages: 1) It can be performed immediately after nonenhanced brain CT, which is performed in patients with acute stroke; 2) examination time is considerably short (acquisition times are typically <1 minute); 3) it has a higher spatial resolution; and 4) no special equipment, except a power injector, is required. The potential limitation of scan range will be overcome by the advancement of multi-detector row CT technology. One drawback of CT perfusion imaging is exposure to radiation. Attempts have been made to reduce the radiation dose, and a tube voltage of 80 kVp has been shown to lower the radiation dose by a factor of 2.8 while providing greater contrast than a tube voltage of 120 kVp (15).
Despite the advantages of CT perfusion imaging, little is known about the relationship between CBF measured with CT and CBF measured with PET or SPECT. Gillard et al (16) reported good correlation in CBF values between CT and PET. In their study, however, the slope of the linear regression ranged from 1.2 to 3.4, which indicated overestimation of CBF with CT. The same overestimations of CBF were reported with MR perfusion imaging (17–19).
Contrast material used in CT perfusion imaging acts as a nondiffusible, intravascular tracer, whereas PET and SPECT use diffusible tracers. Therefore, blood flow measured with CT perfusion imaging reflects intravascular blood flow; however, PET or SPECT do not measure intravascular blood. We hypothesized that the major cause of overestimation of CBF measurements in human subjects by using the CT perfusion technique was the presence of blood vessels on the surface of the brain and perforating arteries. Therefore, if large vessels are excluded from the CBF calculation, CBF values measured with CT perfusion imaging would become closer to those measured with techniques that use radioactive tracer substances.
The same approach was reported by Ernst et al (12), in which good correlation between CBF measured with MR perfusion imaging and CBF measured with SPECT was observed if large vessels were excluded. However, to our knowledge, there has been no report on the effectiveness of elimination of large vessels in a CT perfusion study. Because the effect of contrast material in CT perfusion imaging is different from that in MR perfusion imaging, the effect of vessel-elimination on calculated CBF value would be different. In gadolinium-enhanced dynamic MR perfusion imaging, the presence of an intravascular gadolinium-based contrast agent affects not only the signal intensity of pixels that include vessels, but also the signal intensity of the surrounding tissue. Moreover, the relationship between the concentration of contrast material and the signal intensity is not linear, but logarithmic. However, in CT perfusion imaging, attenuation of the pixel is changed only when contrast material exists in the pixel, and the relationship between the concentration of contrast material and the attenuation has linear characteristics.
The purpose of this study was to evaluate the efficacy of a vascular-pixel elimination (VPE) method in quantitative CT perfusion imaging, in comparison with PET imaging.
Methods
Subjects
Five healthy volunteers were recruited in this study. Age of the subjects ranged from 28 to 33 years (mean age, 30.4 years). All subjects were men and confirmed to have no history of brain disorders or neurologic symptoms. Written informed consent was obtained from all volunteers.
All subjects underwent PET-CBF imaging, followed by CT perfusion imaging. The interval between these two studies ranged from 1 to 23 days (mean, 12.6 days). All examinations were performed at almost the same time in the afternoon, to reduce diurnal fluctuations.
Perfusion CT Protocol
The perfusion CT studies were performed with a four-channel multi-detector row CT scanner (Aquilion Multi-Section; Toshiba Medical Systems, Tokyo, Japan), which allows continuous scanning at the same anatomic level (cine scanning) and can acquire four sections simultaneously.
The CT protocol consisted of three series. First, a lateral scout scan was obtained. Second, a nonenhanced scan of the whole brain was obtained. This whole-brain scan was used to determine the scan levels of the following dynamic cine series and was used in registration of CT and PET images. The parameters of the whole-brain scan included a detector row configuration of 4 × 2 mm, gantry rotation speed of 1 second, 120 kVp, and 150 mAs. After data acquisition, contiguous images of 4- or 8-mm thickness were reconstructed. Third, a dynamic contrast material-enhanced cine scan for CBF calculation was obtained after bolus injection of intravenous contrast agent. A 20-gauge catheter was inserted into a superficial vein at the antecubital fossa or forearm. Forty milliliters of iopamidol (370 mg of iodine per milliliter, Iopamiron; Schering, Osaka, Japan) was injected by a power injector at a rate of 5 mL/s. The injection of the contrast agent was started 5 seconds before the start of cine scanning. In the cine scanning, four sections of 8-mm thickness were obtained simultaneously by using a detector row configuration of 4 × 8 mm. Section locations were chosen from the whole-brain sections scanned before. The most caudal section was set at the level of the circle of Willis and the most cranial section at the level of the basal ganglia. To avoid unnecessary irradiation to the lens, the orbit was excluded from the scanning range. The scanning parameters included a field of view of 22 cm, gantry rotation speed of 1 second, 80 kVp, 200 mAs, matrix of 512 × 512, and acquisition time of 35–40 seconds. A tube voltage of 80 kVp was selected to increase contrast enhancement and reduce irradiation to the subject (15).
CBF Calculation with Perfusion CT
We developed our original work program that runs on Microsoft Windows (Microsoft Corp., Seattle, WA) to calculate CBF with perfusion CT and PET. CBF of perfusion CT was calculated by the central volume principle (20). This principle relates CBF, cerebral blood volume (CBV), and mean transit time (MTT) values in the following relationship:  1 When contrast material has reached the destination, the concentration of the contrast material in the brain tissue (tissue residue function, C[t]) and the artery (arterial input function, Ca[t]) can be measured with a CT scanner as an increase in CT number (HU). The following relationship has been shown:
  2 where ⊗ denotes the convolution operation and R(t) is the impulse residue function (17, 20). R(t) represents the fraction of the injected tracer remaining in the vasculature at time t and is calculated by means of deconvolution. MTT is calculated after determination of R(t) (17, 21) as follows:
  3 where Rmax is the maximum value of R(t).
Absolute CBV in a capillary network can be calculated (17, 18) as follows:  4 where κ = (1 − HCTLV)/(1 − HCTSV) corrects for the hematocrit (HCT) difference between small vessels (HCTSV = 0.25) and large vessels (HCTLV = 0.45), and ñ is the brain tissue density (1.04 g/mL) (17).
All calculation was performed on a voxel-by-voxel basis. Arterial input function (AIF) was determined by measuring the time-attenuation curve of the supraclinoid segment of the right or left internal carotid artery. Singular value decomposition was used in the deconvolution process to determine R(t) (17). MTT was calculated from Equation (3), and CBV was calculated from Equation (4) by using time-attenuation curves of C(t) and Ca(t). Finally, CBF was calculated from Equation (1).
PET Protocol and CBF Calculation
Quantitative CBF measurement was performed by using intravenous administration of 15O-labeled water (9, 22). Transmission scanning was performed for attenuation correction and registration. After transmission scanning, 10-minute emission scanning was performed following infusion of 15O-labeled water (2 GBq) over 2 minutes through a venous catheter. During image acquisition, continuous arterial blood sampling was performed for 10 minutes by means of an arterial catheter in the radial artery.
Regional CBF was calculated for each voxel by using the following equation:  5 where C(t) and Ca(t) are the radioactivity concentrations (in Bq/g/s) in tissue and in arterial blood, respectively, f is the regional CBF (in mL/s/g), and p is the partition coefficient of water (in mL/g). This equation was solved for each voxel by using a nonlinear least squares method (the Powell method). Data acquisition in the PET study was performed with a 128 × 128 × 64 matrix. To reduce calculation time, the matrix of the CBF calculation was decreased to 64 × 64 × 32 by using median filter.
Registration of PET and CT Images
Registration of PET and CT images was also performed by using our original program. Before registering PET-CBF and CT-CBF images, transmission images of PET were registered to whole-brain CT scans. A nonlinear least squares method was used in this registration procedure, and the three-dimensional vector of translation and rotational angles were recorded during this automatic registration. PET-CBF images were then translated and rotated by using these vector and angles to lie in the same imaging plane as CT-CBF. The most cranial sections of CT-CBF were used for data analysis.
Data Analysis
To eliminate the differences in image matrix between PET and CT, the image matrix of PET-CBF was converted from a 64 × 64 matrix to a 512 × 512 matrix by using simple linear interpolation. These high-resolution images were used for the following image segmentation.
To confine the data comparison to brain parenchyma only, automatic image segmentation was performed on nonenhanced CT images. Any voxel of which the attenuation was 100 HU or above was recognized as bone. Bones and outer area of the bone were excluded from the following analysis.
We calculated the average CBF values for the whole section with and without VPE. The precise method for VPE will be described later. We also tried to calculate CBF for gray matter and white matter separately. To distinguish gray matter and white matter, thresholding was done on nonehanced CT images. Gray matter was defined as a voxel value of 32 HU or higher, and white matter as a voxel value of less than 32 HU.
The average values of CT-CBF and PET-CBF of the whole section, gray matter, and white matter were then analyzed. A paired t test was used for statistical analysis. A P value less than .01 indicated a statistically significant difference. Pixel-by-pixel correlation between CT and PET and linear regression analysis were also performed. In this study, to reduce the spatially distributed noise, the matrix sizes of both CT-CBF and PET-CBF were reduced to 32 × 32, and the comparison of average CBF value and pixel-by-pixel correlation were carried out thereafter.
VPE Method
The VPE method was applied both to the average CBF comparison and the pixel-by-pixel correlation. The vascular pixels were simply defined by the CBV value of the pixel derived from CT perfusion imaging, because the CBV value of the pixel reflects blood content of the pixel. Theoretically, a pure blood vessel pixel without partial volume averaging has a CBV value of 104 mL/100 g.
In the VPE method, to elucidate the best threshold of CBV value, the threshold was changed from 5 to 20 mL/100 g. Any pixel that has a higher CBV value than the threshold was marked as a vascular pixel and excluded from the CBF calculation. The resultant CT-CBF values were compared with PET-CBF values.
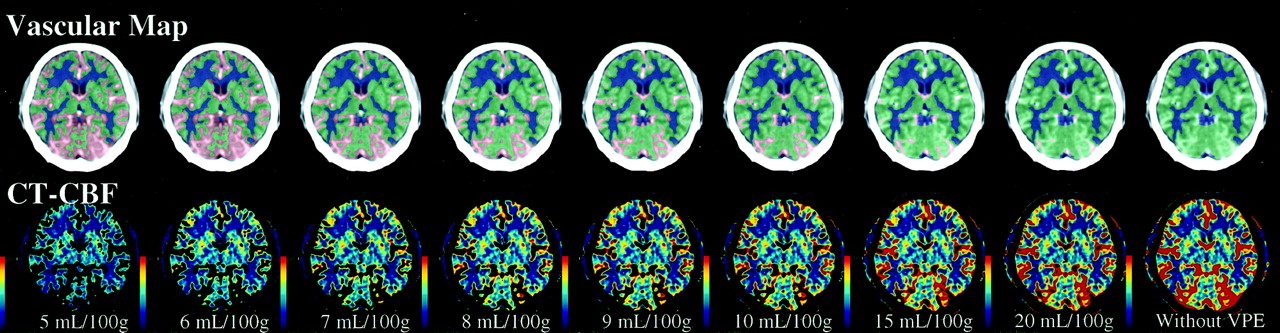
Visual assessment was conducted by two neuroradiologists (K.K., S.T.). The vascular maps were created by superimposition of vascular pixels defined by CBV threshold on the CT image used for CBF calculation in which the vessels were intensely enhanced. Gray and white matter pixels were also superimposed. CT-CBF images with VPE, in which vascular pixels were excluded from the image, were made. The two neuroradiologists visually evaluated the vascular maps and CT-CBF images with VPE at various levels of VPE threshold.
Results
All CT perfusion and PET studies were completed without complication. Figure 1 shows PET-CBF images and CT-CBF and CT-CBV images obtained in the five subjects. The image registration between CT and PET was acceptable in all subjects, and CT-CBF images were similar to PET-CBF images. However, large vessels at the surface of the brain were more conspicuous on CT-CBF than on PET-CBF images.

PET-CBF, CT-CBF, and CT-CBV images obtained in the five subjects. The CBF images of both PET and CT are displayed at the same window level. Note that large vessels on the brain surface are more prominent on CT-CBF than PET-CBF images. CT-CBV images were used for the VPE method.
Typical CT-CBF images obtained from subject 1 by using various thresholds of the VPE method are shown in Fig 2. On visual assessment, gray and white matter separations were satisfactory in all subjects. Large vessels on the brain surface were successfully excluded from CT-CBF images, and the extent of the vascular area increased as the level of the VPE threshold decreased. However, part of the brain parenchyma was also excluded when the threshold was less than 8 mL/100 g.

Vascular maps and CT-CBF images obtained in subject 1 at various levels of VPE threshold. On the vascular maps, gray matter is displayed in green, and white matter in dark blue. The separation between gray matter and white matter was performed on the basis of the pixel attenuation on nonenhanced scans. Vascular pixels are expressed in red. The extent of the vascular area increases as the level of VPE threshold decreases. VPE threshold is indicated below the CT-CBF images. If the VPE threshold is very small (such as 5 mL/100 g), part of the brain parenchyma also disappears from the CT-CBF image.
Correlation between CT-CBF and PET-CBF
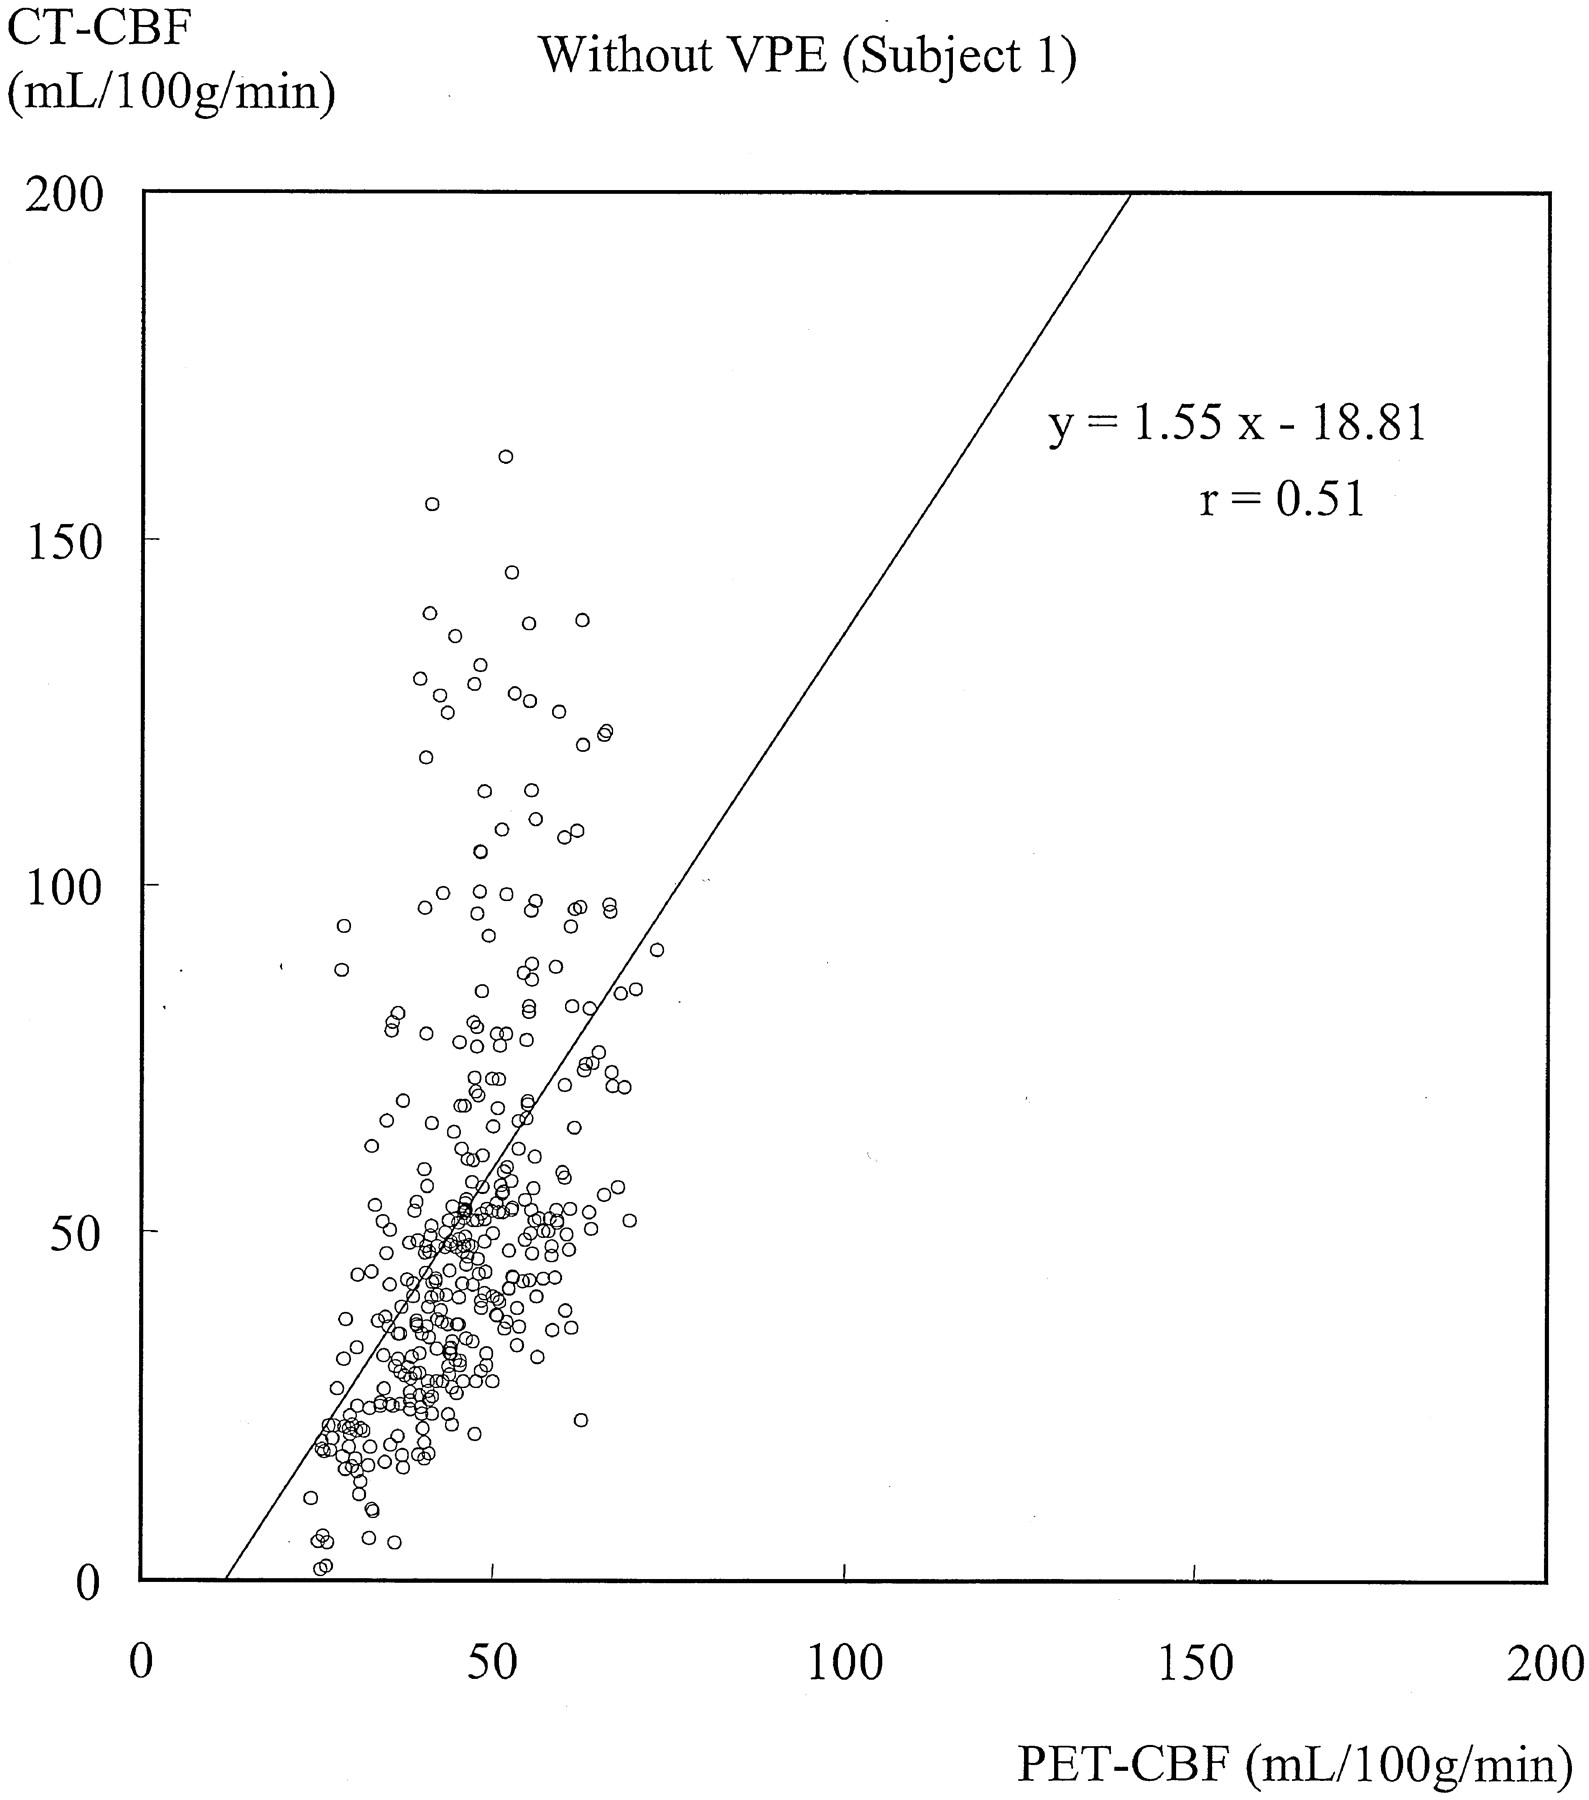
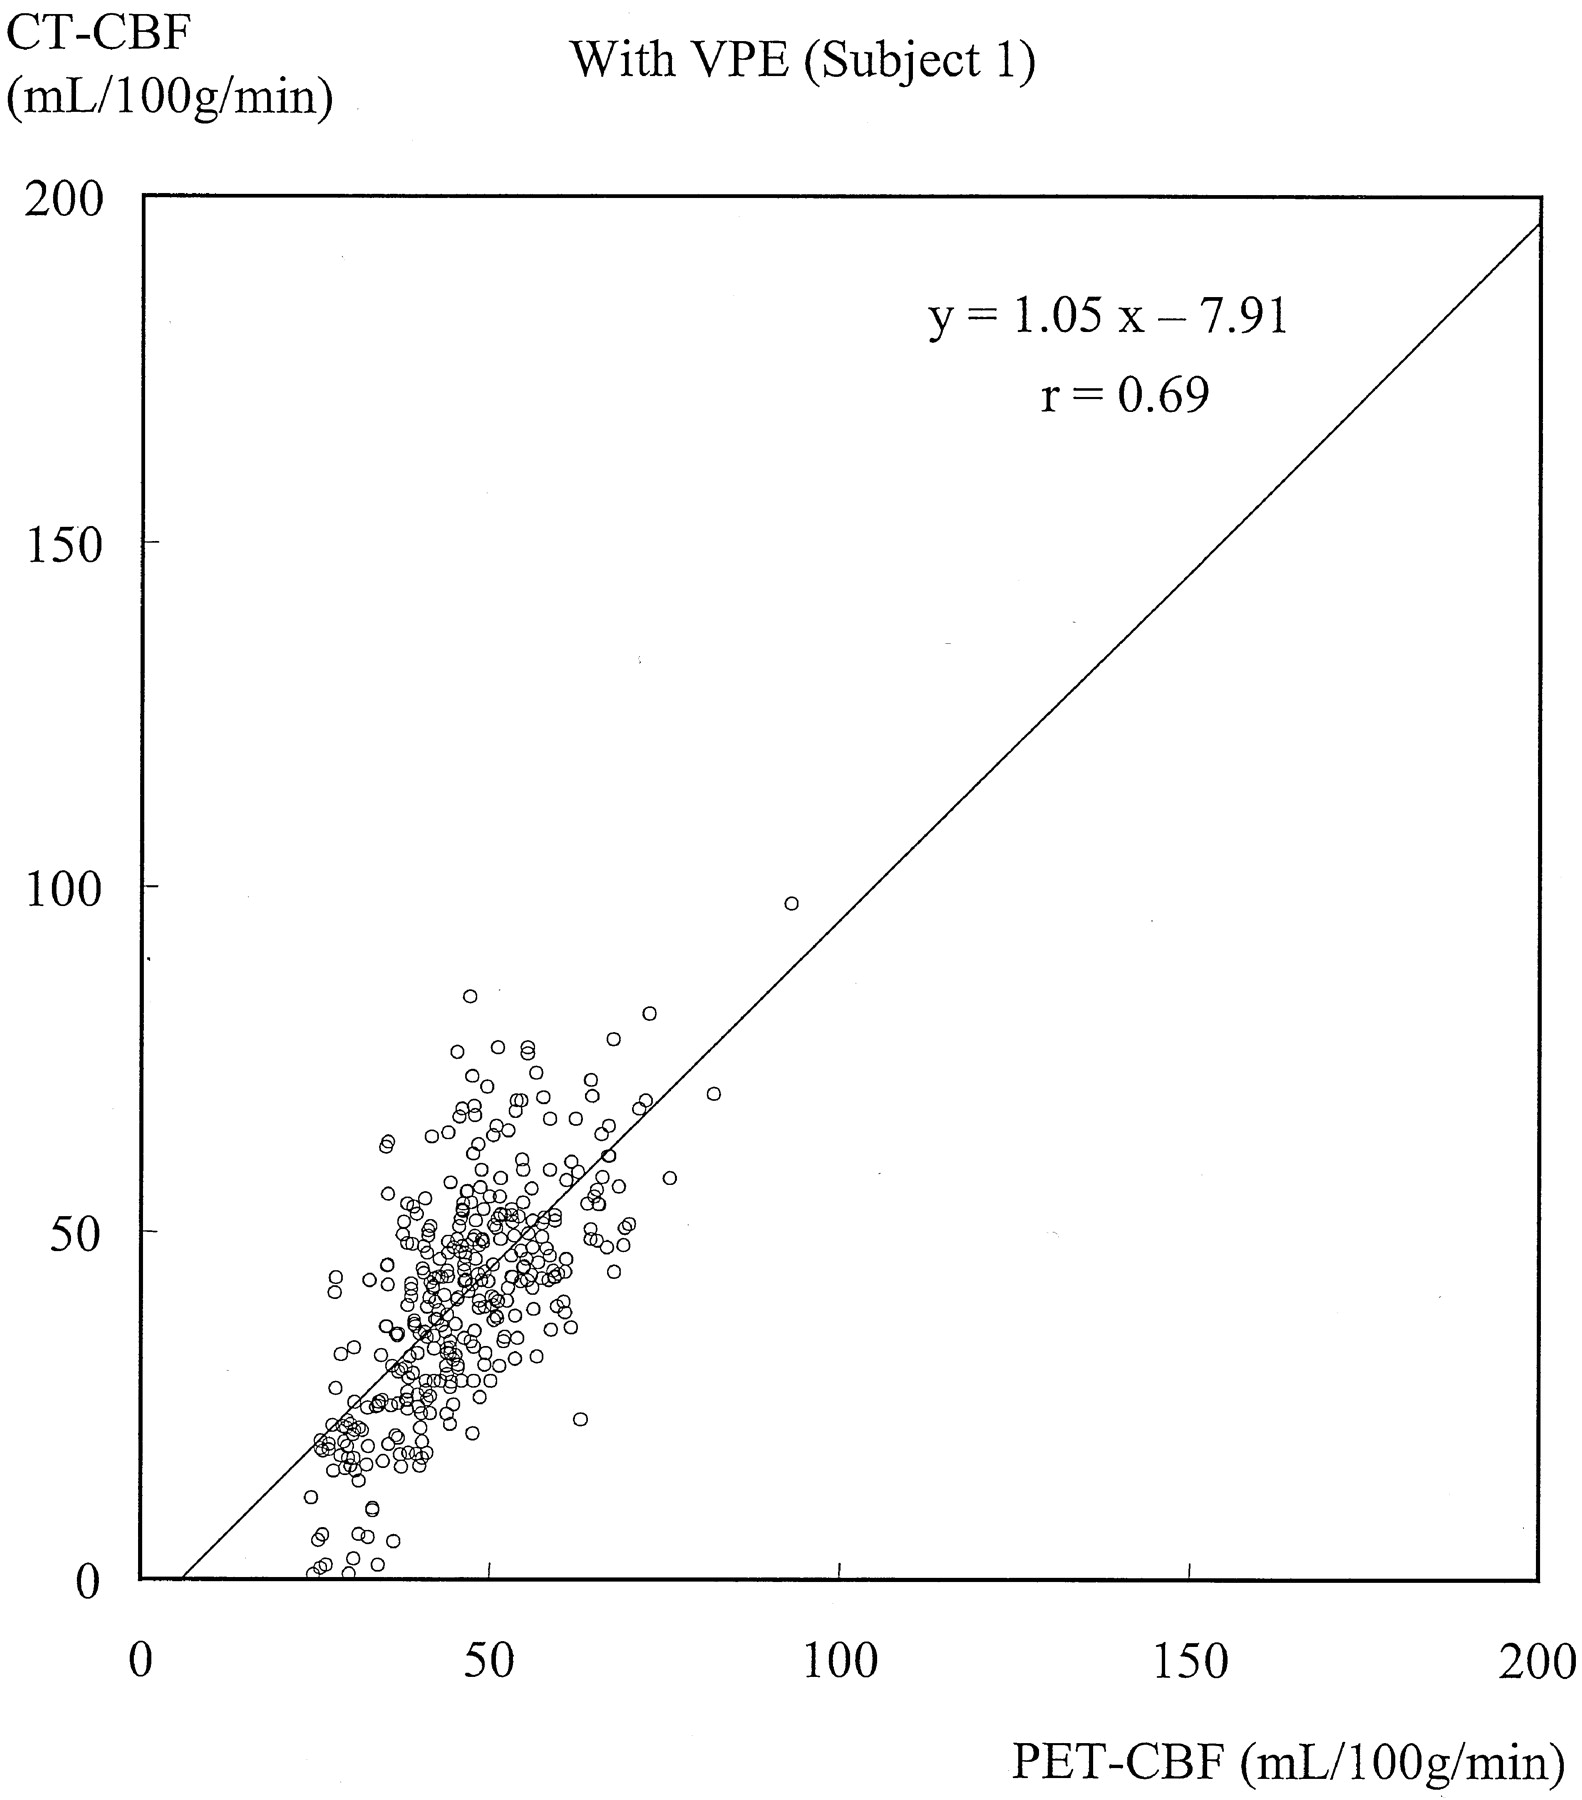
Figures 3 and 4 show typical scatterplots of CT-CBF against PET-CBF obtained in subject 1 without and with VPE (threshold of 8 mL/100 g), respectively. Their associated linear regressions are also shown. Figure 5 shows results of the linear regression analysis against various VPE thresholds. As the VPE threshold decreased, the correlation coefficient increased, slope approached 1.0, and intercept approached zero. Note that the correlation coefficients rapidly decreased when the VPE threshold was less than 8 mL/100 g.

Scatterplot of CT-CBF without VPE against PET-CBF and associated linear regression in subject 1. The slope is larger than 1.0, which suggests overestimation of CBF measured with perfusion CT. The correlation coefficient (r = 0.51) indicates moderate correlation.

Scatterplot of CT-CBF with VPE (threshold of 8 mL/100 g) against PET-CBF and associated linear regression in subject 1. The slope approaches 1.0, and the correlation coefficient (r = 0.69) increases compared with that without VPE.

Results of linear regression analysis obtained in subject 1 against various VPE thresholds. Values without VPE are plotted at the most right-hand side (threshold of 104 mL/100 g).
A, Correlation coefficient. As the VPE threshold decreases, the correlation coefficient increases. The best correlation is observed at a VPE threshold of 8 mL/100 g. Note that correlation coefficients rapidly decrease when VPE threshold is less than 8 mL/100 g.
B, Slope of linear regression. As the VPE threshold decreases, the slope also decreases and approaches 1.0. When the VPE threshold is less than 8 mL/100 g, the slope becomes less than 1.0.
C, Intercept of linear regression. As the VPE threshold decreases, the intercept increases and approaches zero.
Results obtained in the other subjects had the same trend as those in subject 1, and the results of all subjects are summarized in Table 1. Without VPE, the slopes were larger than 1.0 (range, 1.27–2.65), which suggested overestimation of CBF measured with perfusion CT. Correlation coefficients showed weak or moderate correlation (range, 0.37–0.52). When VPE was used, the slopes approached 1.0 (range, 1.00–1.55) and the correlation coefficients increased (range, 0.62–0.69) compared with those without VPE. The best correlation was observed in four of the five subjects when a VPE threshold of 8 mL/100 g was used. The one remaining subject had the best correlation when a VPE threshold of 6 mL/100 g was used.
Results of linear regression analysis
Absolute CBF Value
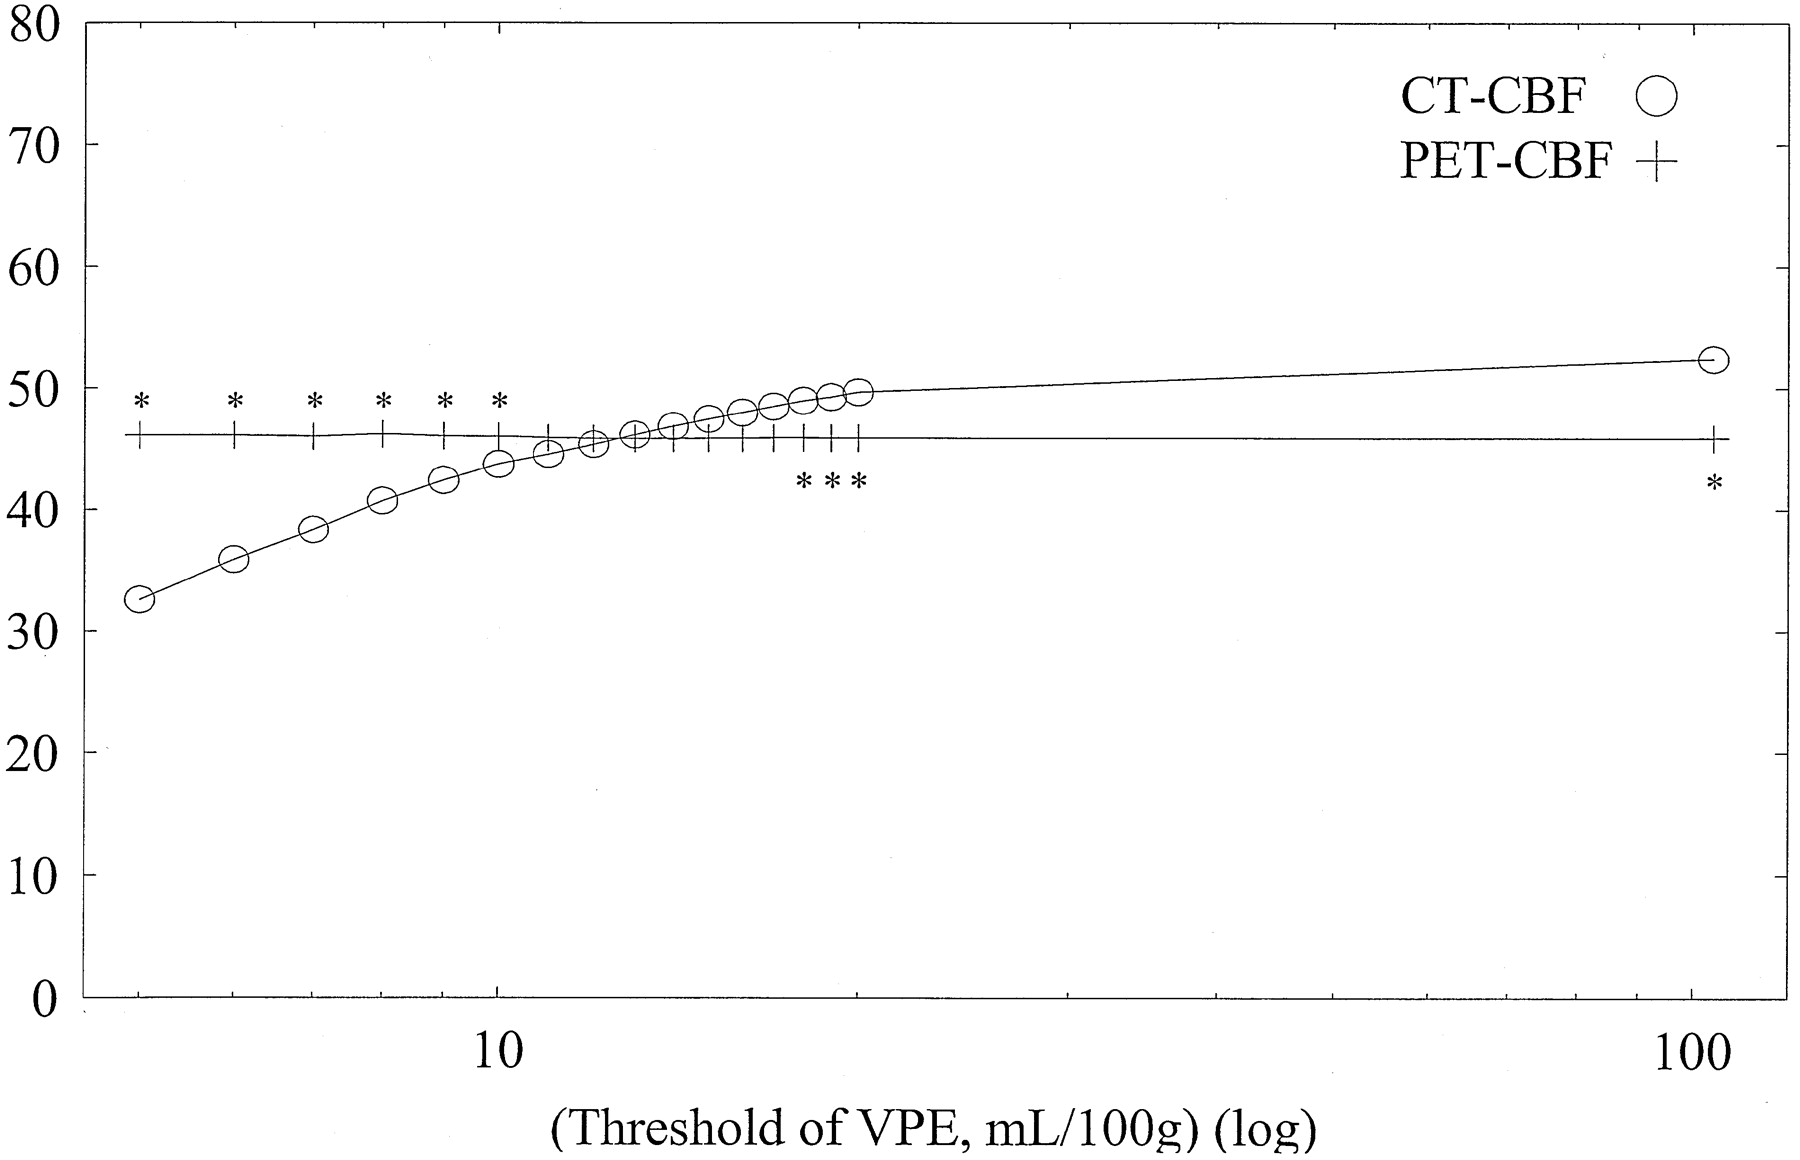
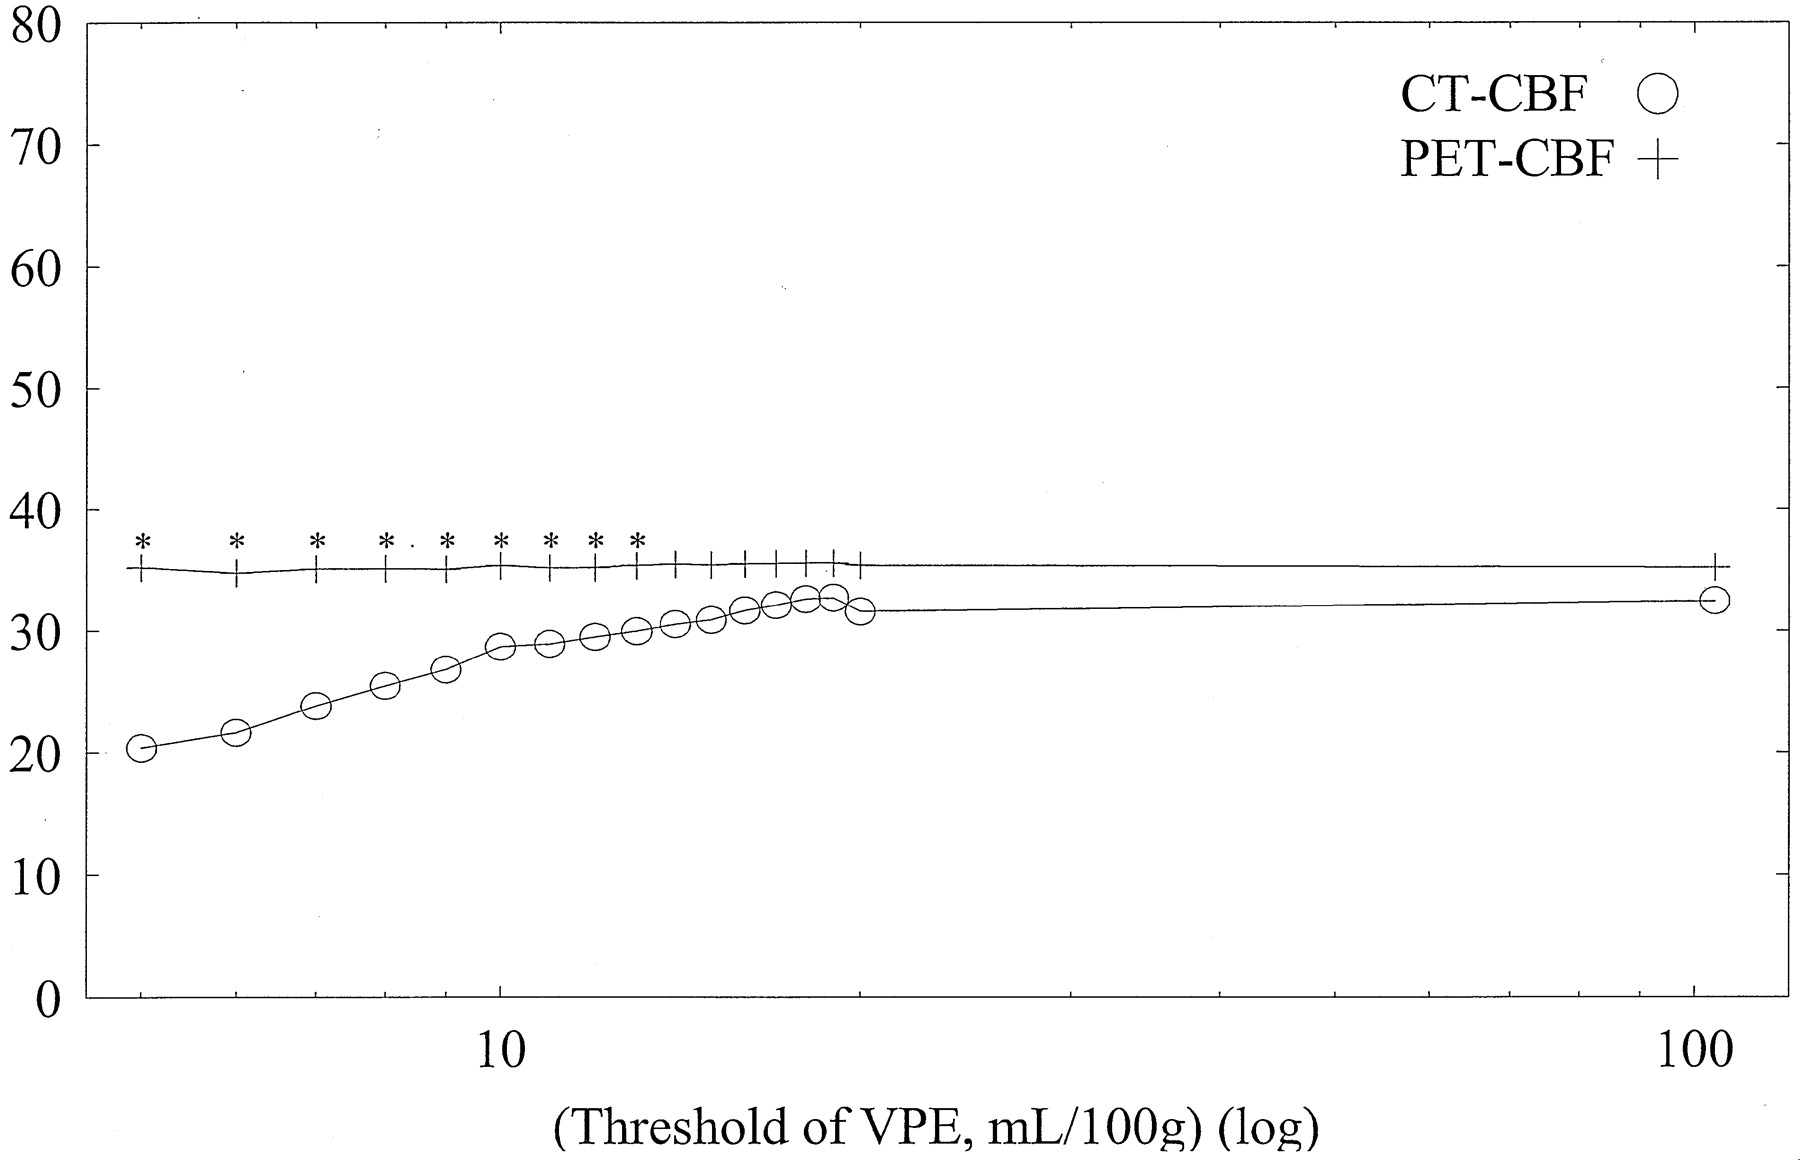
Average CBF values of whole-section, gray matter, and white matter with both CT and PET against varying VPE thresholds in subject 1 are shown in Figs 6, 7, and 8, respectively. Without VPE, average CT-CBF values of the whole section and gray matter were higher than PET-CBF values. CBF values of PET were almost constant, despite the change in VPE threshold. CT-CBF values decreased along with the decrease in VPE threshold. CT-CBF values of the white matter without VPE were closer to PET-CBF values than were those of the whole section and gray matter. Results for the other subjects showed almost the same trends, and results for all subjects are summarized in Table 2.

Average CBF values of the whole section (pixels) with both CT and PET against varying VPE threshold values in subject 1. Without VPE (plotted at the most right-hand side, threshold of 104 mL/100 g), the CT-CBF value is higher than the PET value. CBF values with PET are almost constant despite the change in the VPE threshold. As the VPE threshold decreases, CBF values with CT decrease and approach the corresponding PET values. * indicates a statistically significant difference (P < .01)

Average CBF values of gray matter with both CT and PET against varying VPE threshold values in subject 1. Without VPE (plotted at the most right-hand side, threshold of 104 mL/100 g), the CT-CBF value is overestimated. As the VPE threshold decreases, CT-CBF values decrease and approach the corresponding PET values. * indicates a statistically significant difference (P < .01)

Average CBF values of white matter with both CT and PET against varying VPE threshold values in subject 1. Overestimation of CT-CBF is not observed. As the VPE threshold decreases, CT-CBF values decrease. * indicates a statistically significant difference (P < .01)
Average CBF values with and without VPE
Average CT-CBF values of the whole section with and without VPE (threshold of 8 mL/100 g) were 45.56 and 59.01 mL/100/min, respectively, and the corresponding PET-CBF values were 47.17 and 46.86 mL/100 g/min, respectively. CT-CBF values of the whole section without VPE were 14.2–37.3% (mean, 25.9%) larger than PET-CBF values. When a VPE threshold of 8 mL/100 g was applied, the difference reduced to 4.0–11.9% (mean, 3.4%) in the whole section.
Average CT-CBF values of the gray matter with and without VPE were 52.75 and 66.73 mL/100 g/min, and the corresponding PET-CBF values were 51.37 and 50.89 mL/100 g/min, respectively. CT-CBF values of gray matter without VPE were 19.2–46.4% (mean, 31.1%) larger than PET-CBF values. When a VPE threshold of 8 mL/100 g was applied, the difference reduced to 2.5–10.4% (mean, 2.7%) in the gray matter.
Average CT-CBF values of the white matter with and without VPE were 30.38 and 42.53 mL/100 g/min, and the corresponding PET-CBF values were 37.86 and 38.20 mL/100 g/min, respectively. The difference ranged from 7.8% to 44.5% (mean, 11.3%) without VPE. When VPE was used, CT-CBF values of white matter became lower than PET-CBF values. The difference was 9.7–25.9% (mean, 19.7%) when a VPE threshold of 8 mL/100 g was used.
Discussion
Quantitative CBF values with CT perfusion imaging have been verified by means of the microsphere technique in animals (23, 24) and compared with those obtained with PET (16). Both results are encouraging; however, CBF values derived from the CT perfusion study had a tendency toward overestimation compared with those derived from the PET study (16). The limitation of the method was due to the use of operator-dependent region-of-interest-based analysis.
The principles of measurement of blood flow are not identical between CT and PET. CBF measurement with H215O PET uses diffusible tracer, and tissue perfusion can be directly measured. Because the iodinated contrast material used in dynamic CT perfusion imaging acts as a nondiffusible intravascular tracer, absolute tissue perfusion cannot be directly measured. Instead, intravascular blood flow is measured. We hypothesized that overestimation of CBF measurement with CT perfusion imaging was attributed to the presence of large blood vessels on the surface of the brain and perforating arteries in the basal ganglia.
To minimize the effect of large vessels on the CBF calculation, we tried to exclude all vascular pixels from the calculation of CBF value. In our study, the vascular pixels were defined by a certain threshold of CBV value, because CBV in CT perfusion imaging simply reflects vascular content in the pixel. As it was difficult to determine the best threshold value before this study, the extent of vascular area was visually assessed at varying levels of VPE threshold. We also compared the calculated CT-CBF values to PET-CBF values with varying levels of VPE threshold. The best correlation of CBF value between CT and PET was observed at a threshold of 8 mL/100 g in four of the five subjects. The remaining one subject had the best correlation when a VPE threshold of 6 mL/100 g was used; a threshold that was not much different from 8 mL/100 g. With the use of that threshold, the difference of CBF values between CT and PET became smaller than without VPE, and CBF images with VPE were acceptable on visual assessment. In addition, both PET-CBF values and calculated CT-CBF values of the whole section with VPE agreed with the reported PET-CBF values of the whole brain by Frackowiak et al (8). Thus, we consider that the best VPE threshold is approximately 8 mL/100 g.
PET-CBF values of the whole brain, gray matter, and white matter have been reported to be 47.7, 65.3, and 21.4 mL/100 g/min, respectively (8). In our study, the average PET-CBF value of the whole section (46.86 mL/100 g/min) was in good agreement with that value in the previous study (8). However, our PET-CBF value of the gray matter (50.89 mL/100 g/min) was lower and our PET-CBF value of the white matter (38.20 mL/100 g/min) was higher than those of the previous study (8). The difference is possibly attributable to the method of differentiation between gray matter and white matter. The differentiation was based on CT values of a pixel on a nonenhanced CT image. A certain part of the gray matter could be misregistered as white matter, because some part of the cerebral cortex showed lower attenuation due to undershooting or beam hardening caused by a focal projection on cranial bone. The misregistration can explain the overestimation of white matter CBF. The underestimation of gray matter CBF may occur if pixels of higher CBF values than the average gray matter CBF are misregistered as the white matter (and consequently excluded from the calculation of gray matter CBF). Moreover, precise differentiation of gray matter from white matter may be difficult in a PET study as well, because PET-CBF images are blurred owing to the lower spatial resolution and scattering. Therefore, accuracy of the reported CBF values of gray matter and white matter with PET can be a matter of question. If the border between the gray matter and white matter is excluded from PET-CBF calculation, the CBF of gray matter might become higher and that of white matter become lower than actual values.
In our study, the average CT-CBF value with VPE (45.56 mL/100 g/min) agreed with the average PET-CBF value (47.17 mL/100 g/min) for the whole section. However, the average CT-CBF with VPE for the gray matter (52.75 mL/100 g/min) showed a slightly higher value than the corresponding PET-CBF value (51.37 mL/100 g/min), and average CT-CBF value with VPE for the white matter (30.38 mL/100 g/min) was much lower than the corresponding PET-CBF value (37.86 mL/100 g/min). The underestimation of white matter CBF with CT perfusion imaging might be explained by misregistration of gray matter and white matter, as discussed above, or might be explained by a difference in the nature of the tracers used in CT perfusion imaging and PET studies. Because the fraction of gray matter pixels outnumbered white matter pixels, the underestimation of white matter CBF exerted little effect on the CBF of the whole section.
The VPE method of CT perfusion imaging appears to be useful when the CBF value of cortical gray matter is of concern. When region-of-interest-based analysis is used to evaluate the absolute CBF value, the measured value can easily fluctuate owing to the amount of vascular pixels in the region of interest. As it is difficult to place an ideal region of interest that does not contain leptomeningeal vessels to measure cortical gray matter CBF, the VPE method is expected to be valuable in evaluating parenchymal blood flow of the cerebral cortex.
There are several limitations in our study. The limited number of subjects is a major drawback. Because of the high cost and limited availability of PET, we could not perform a study containing a large number of subjects. Radiation exposure was another factor, which limited the recruitment of subjects. Another limitation was the delay between PET and CT studies, which was also attributed to restricted availability of PET. Discrepancy of measured CBF values can occur because of this delay. However, all the examinations were performed at almost the same time in the afternoon to avoid diurnal fluctuation of the CBF. The long-term reproducibility of CBF measurements has been reported (25), and the mean difference of the measured CBF was only 7%. The scan range was also restricted although we used multi-detector row CT. Because it was impossible to cover the whole brain at once, we evaluated the CBF value at the level of the basal ganglia, and this study was principally focused on supratentorial blood flow.
Conclusion
Vascular pixels can be excluded successfully by using CBV values. The VPE method in CT perfusion imaging prevents overestimation of CBF measurements and yields considerably accurate CBF values. Thus, the technique would provide valuable information on CBF in patients with cerebrovascular diseases.
Footnotes
Supported by the Grant-in-Aid for Scientific Research, Ministry of Education, Culture, Sports, Science and Technology, Japan.
Presented at the 40th annual meeting of the American Society of Neuroradiology, Vancouver, BC, Canada, May 11–17, 2002.
References
- Received July 3, 2002.
- Accepted after revision August 27, 2002.
- Copyright © American Society of Neuroradiology
In this issue


Jump to section
Related Articles
Cited By...
- Prospective Multicenter Study of Changes in MTT after Aneurysmal SAH and Relationship to Delayed Cerebral Ischemia in Patients with Good- and Poor-Grade Admission Status
- Regional Comparison of Multiphase Computed Tomographic Angiography and Computed Tomographic Perfusion for Prediction of Tissue Fate in Ischemic Stroke
- Comparison of Perfusion CT Software to Predict the Final Infarct Volume After Thrombectomy
- Cerebral Perfusion Pressure is Maintained in Acute Intracerebral Hemorrhage: A CT Perfusion Study
- Imaging Evidence and Recommendations for Traumatic Brain Injury: Advanced Neuro- and Neurovascular Imaging Techniques
- Early Rate of Contrast Extravasation in Patients with Intracerebral Hemorrhage
- Recommendations for Imaging of Acute Ischemic Stroke: A Scientific Statement From the American Heart Association
- Avoiding "Pseudo-Reversibility" of CT-CBV Infarct Core Lesions in Acute Stroke Patients After Thrombolytic Therapy: The Need for Algorithmically "Delay-Corrected" CT Perfusion Map Postprocessing Software
- The Acetazolamide Challenge: Techniques and Applications in the Evaluation of Chronic Cerebral Ischemia
- Theoretic Basis and Technical Implementations of CT Perfusion in Acute Ischemic Stroke, Part 2: Technical Implementations
- Theoretic Basis and Technical Implementations of CT Perfusion in Acute Ischemic Stroke, Part 1: Theoretic Basis
- Tracer Delay-Insensitive Algorithm Can Improve Reliability of CT Perfusion Imaging for Cerebrovascular Steno-Occlusive Disease: Comparison with Quantitative Single-Photon Emission CT
- Identification of the penumbra and infarct core on hyperacute noncontrast and perfusion CT
- Identification of Penumbra and Infarct in Acute Ischemic Stroke Using Computed Tomography Perfusion-Derived Blood Flow and Blood Volume Measurements
- Visual evaluation of perfusion computed tomography in acute stroke accurately estimates infarct volume and tissue viability
- Comparative Overview of Brain Perfusion Imaging Techniques