
Abstract
BACKGROUND AND PURPOSE: The pathogenesis of cerebral venous infarction (CVI) remains controversial, with uncertainty over whether cytotoxic edema plays a role. Recent animal studies have shown that cytotoxic edema reliably occurs in acute CVI and precedes the onset of vasogenic edema. Our hypothesis was that cytotoxic edema would also occur in acute human CVI and would be detectable as an area of restricted diffusion on diffusion-weighted images.
METHODS: Twelve subjects with acute cerebral venous thrombosis confirmed by MR venography underwent both conventional MR and echo-planar diffusion-weighted imaging (maximum diffusion sensitivity [b=1000 s/mm2]). Images were examined for areas of CVI that were identified as T2 hyperintensity, diffusion hyperintensity, or hemorrhage. The percent change in apparent diffusion coefficient (ADC) and T2 signal as well as the T2/diffusion volume were calculated within areas of edematous CVI. Regression techniques were used to examine the relationship of these variables to symptom duration.
RESULTS: Ten regions of CVI were detected in seven subjects, all showing T2 hyperintensity. Two of these regions were predominately hemorrhagic and did not display diffusion hyperintensity. The remaining eight regions displayed diffusion hyperintensity that was associated with a decreased ADC. ADC values increased with symptom duration (r2 = 0.96; P < .006). Both T2 hyperintensity and T2/diffusion volume peaked approximately 2 days after symptom onset.
CONCLUSION: Restricted water diffusion suggesting cytotoxic edema is commonly found in subjects with acute CVI and decreases over time. This supports an important etiologic role for cytotoxic edema in the pathogenesis of CVI.
In approximately 50% of cases, cerebral venous thrombosis progresses to cerebral venous infarction (CVI) (1). This is initiated by thrombus propagation into draining cortical veins, causing obstruction of venous drainage and elevation of venous pressure (2, 3). The subsequent pathophysiological mechanisms that lead to CVI remain controversial (4). Traditional models hold that retrograde venous pressure causes breakdown of the blood-brain barrier, with leakage of fluid (vasogenic edema) and hemorrhage into the extracellular space (5).
Alternatively, a different pathway from venous obstruction to infarction has been proposed wherein retrograde venous pressure decreases cerebral blood flow, causing tissue damage, in a manner more akin to arterial infarction (6–8). Several studies have confirmed that venous thrombosis causes a reduction in cerebral blood flow, and this reduction may be severe enough to cause tissue infarction (cytotoxic edema) (2, 7, 9). Furthermore, early decreases in apparent diffusion coefficient (ADC) have been shown in animal models of CVI, implying the presence of cytotoxic edema (8). Finally, whereas vasogenic edema also occurs in CVI, animal evidence indicates it is a secondary phenomenon occurring after cytotoxic edema (7, 8).
This issue might be most clearly addressed by examination of early diffusion changes in developing areas of CVI in human studies. Such data, however, are sparse, comprising conflicting single case reports (10–12). Our hypothesis was that restricted diffusion, indicating cytotoxic edema, would be found in acute CVI in humans.
Methods
Clinical Features
We studied 12 subjects with acute cerebral venous thrombosis. All suffered prodromal symptoms of headache, nausea, or vomiting prior to developing the neurologic changes shown in the Table. Predisposing factors for venous thrombosis (13) included single cases of protein C deficiency, previous pulmonary embolism, pregnancy, carcinomatosis, oral contraceptive use, and two cases of mastoiditis. We excluded subjects with thrombosis secondary to trauma, tumor, or surgery, who were likely to have abnormal brain parenchyma.
Imaging Parameters
Cerebral venous thrombosis was confirmed by 2D time-of-flight MR venography. Subjects were assessed by both conventional MR and diffusion-weighted imaging before initiation of treatment. Conventional sequences comprised T1-weighted axial and sagittal spin-echo (450/14/1 [TR/TE/excitations]), T2-weighted axial fast spin-echo (2050/26–91/1), and coronal gradient-echo (883/15/1) sequences. Axial diffusion-weighted imaging was performed using a single-shot echo-planar spin-echo technique at 1.5 T (6500/101/1; slice thickness, 5 mm; interslice gap, 2.5 mm; field of view, 20 cm; matrix size, 128 × 128). A gradient of maximum diffusion sensitivity (b = 1000 s/mm2) was applied in three orthogonal planes. Data were used to derive ADC maps in the usual way by use of the Stejskal and Tanner equation (14), S=S0e−bADC, where S is signal intensity at b = 1000 s/mm2 and S0 is signal intensity at b=0 s/mm2.
Image Analysis
Both conventional MR and diffusion-weighted images were examined for signal change suggesting CVI edema or hemorrhage. Regions of interest (ROI) were manually drawn around areas of nonhemorrhagic diffusion hyperintensity and the mean ADC (± SD) within was calculated. This value was compared with normal brain of equivalent composition and the percent ADC change calculated. Similarly, an ROI was drawn around each area of T2 hyperintensity and the percent change in signal intensity (± SD) was calculated by comparison to equivalent normal brain. The volumes of diffusion and T2 hyperintensity were determined using a previously described method (15), and their ratio calculated (T2/diffusion volume). Where subjects had more than one area of CVI, averages were used to allow for statistical analysis. Follow-up studies, where available, were examined for temporal changes.
All variables (ADC change, T2 signal change, and T2/diffusion volume) were compared with symptom duration. Regression techniques were used to determine whether any variable showed a linear or log linear exponential relationship with time (16).
Results
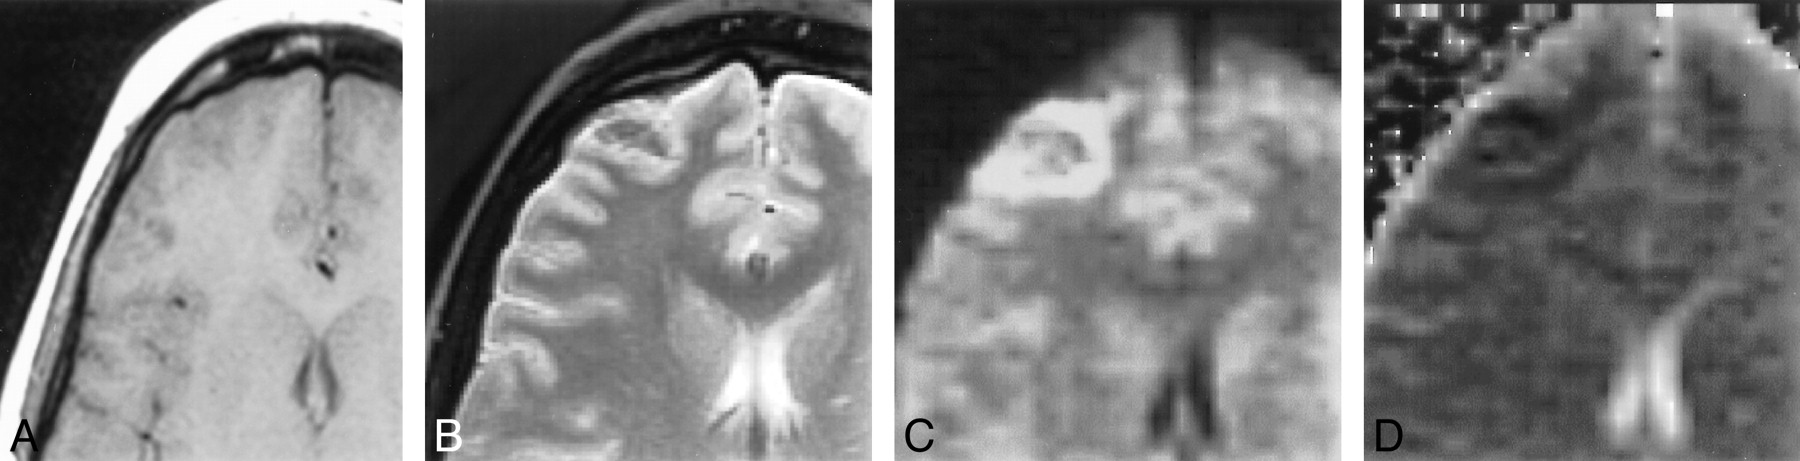
Individual clinical and imaging data are shown in the Table. Seven subjects showed parenchymal signal change suggesting CVI. In all cases, CVI was identified on conventional MR images, with no subject showing restricted diffusion in the absence of conventional MR changes. Ten discrete areas of CVI were identified, with three subjects each showing two discrete areas of CVI. Two cases of CVI (subjects 10 and 12) comprised a large parenchymal hematoma surrounded by a thin rim of T2 hyperintensity and showing increased water diffusion (vasogenic edema). Eight areas of CVI (five subjects) showed both T2 and diffusion hyperintensity as well as reduced ADC, in keeping with diffusion restriction (Fig 1). Six of these areas showed either petechial hemorrhage or discrete hemorrhage distant from diffusion hyperintensity.

Subject 6. A, T1-weighted image (450/14/1) showing slightly swollen right frontal cortex and no signal change.
B, T2-weighted image (2050/91/1) depicting a ring of signal hyperintensity in right frontal cortex.
C, Isotropic diffusion-weighted image revealing a more hyperintense right frontal cortex than B.
D, ADC showing corresponding decrease suggesting cytotoxic edema.
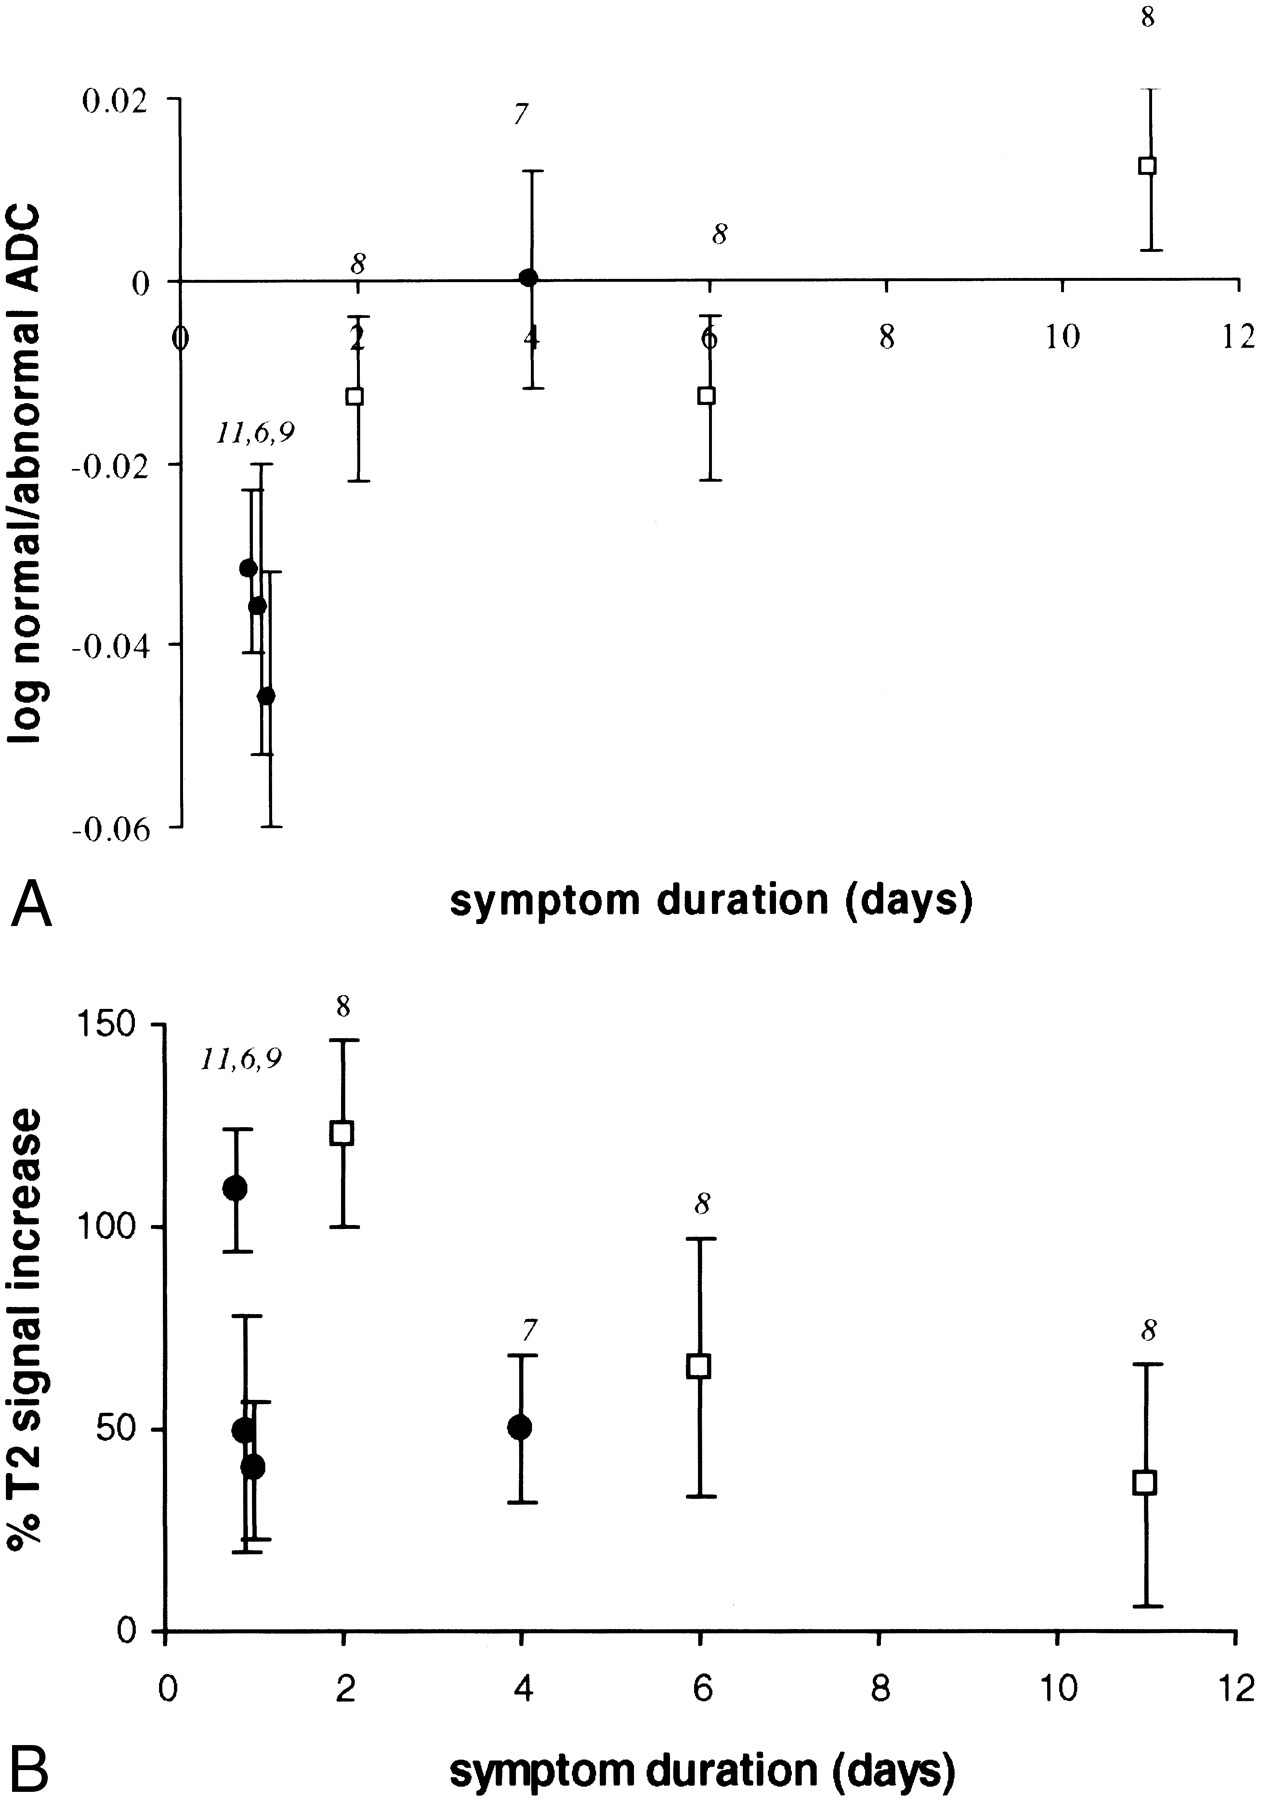
We compared the ADC values of diffusion-hyperintense CVI with symptom duration and observed an exponential increase over time (Fig 2) (r2 = 0.96; P < .006 [without follow-up data on subject 7]; r2 = 0.79; P < .008 [with follow-up data]). By contrast, T2 hyperintensity reached a maximum around 2 days after symptom onset and then decreased (Fig 3). T2/diffusion volume followed an almost identical pattern to that of T2 hyperintensity, reaching a maximum at day 2 and then decreasing.

This graph shows the relationship between log of the ratio of the ADC value in CVI compared with normal brain and symptom duration. A log plot was performed as data appeared to show an exponential relationship with time. Subjects scanned within 2 days of symptom onset show a reduction in ADC within CVI, suggesting cytotoxic edema. By 4 to 6 days, CVI shows a similar ADC to that of normal brain. By 11 days, ADC is higher in CVI than in normal brain, suggesting vasogenic edema. The numbers adjacent to each point indicate the subject identification (see Table). Follow-up results are available for subject 8 (open square symbol). Subjects who underwent a single study are identified by a closed black circle. Error bars indicate the SD of signal intensity.fig 3. This graph shows the relationship between percent T2 signal change and symptom duration. For each subject, the T2 signal within CVI has been compared with normal brain and the percent change in T2 signal calculated. Signal intensity of CVI appears to peak around day 2. The numbers adjacent to each point indicate the subject identification (Table). Follow-up results are available for subject 8 (open square symbol). Subjects who underwent a single study are indicated by a closed black circle. Error bars indicate the SD of signal intensity
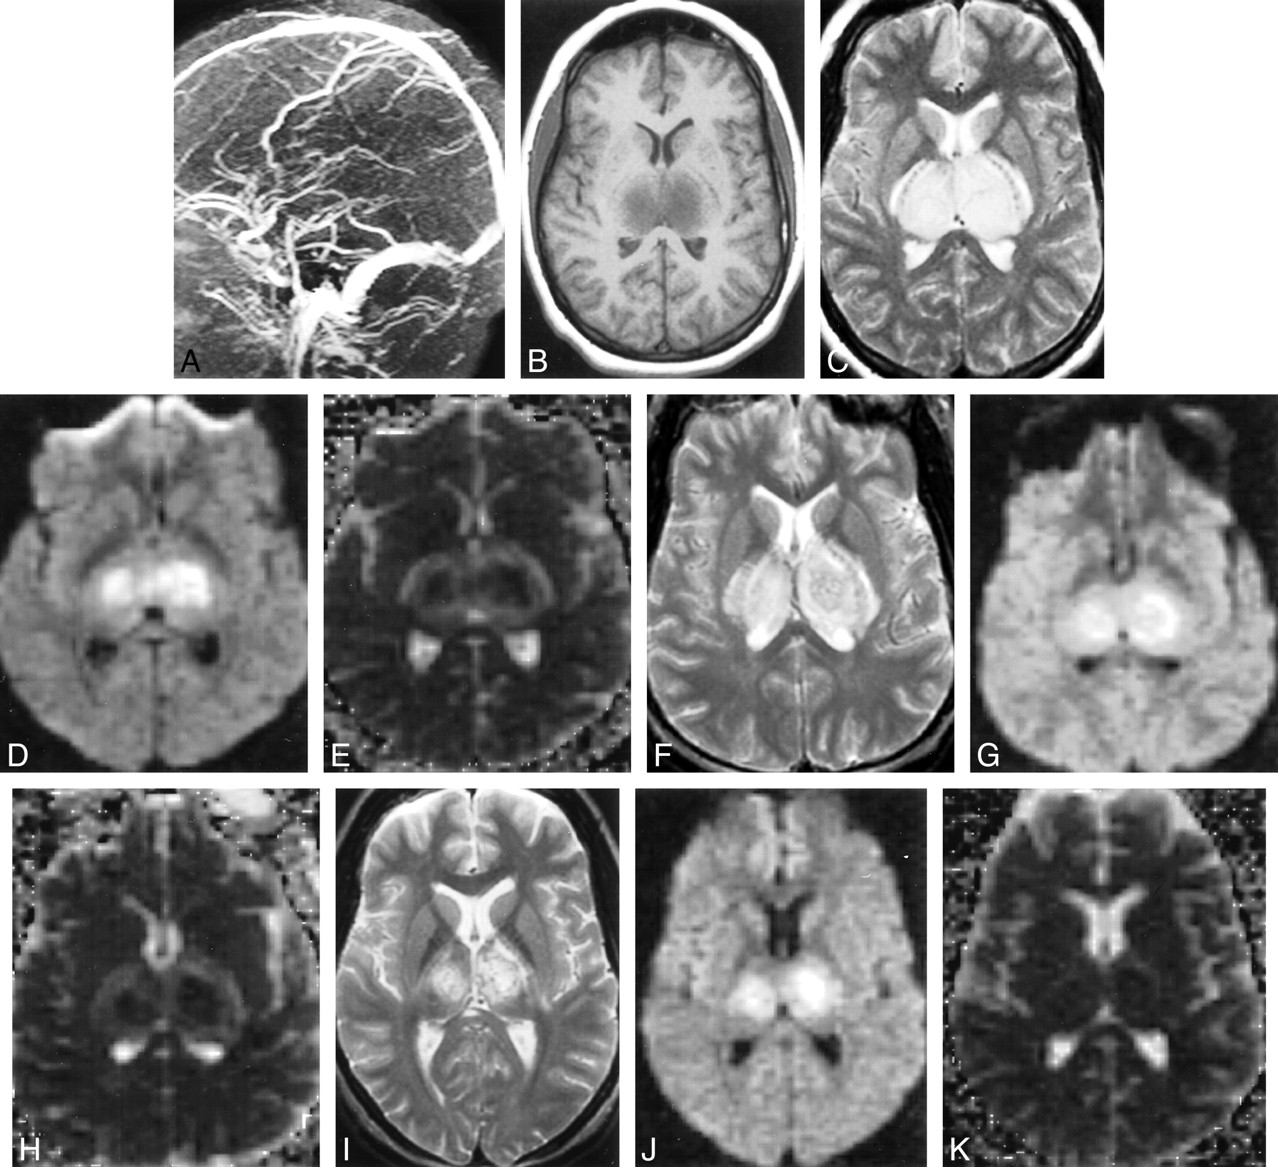
Two subjects (subjects 8 and 10) underwent repeat diffusion-weighted imaging after treatment of thrombosis by anticoagulation or thrombolysis (Table). Subject 8 showed continued diffusion hyperintensity at days 6 and 11 (Fig 4), with temporal changes in ADC and T2 signal changes shown in Figures 2 and 3. Subject 10 (large hematoma) underwent follow-up diffusion-weighted imaging at day 5. As with the initial examination, no diffusion hyperintensity was seen.

Subject 8. A, MR venography (day 2) showing no flow in the internal cerebral veins, straight sinus, or vein of Galen.
B, T1-weighted image (450/14/1) (day 2) revealing swollen hypointense thalami.
C, T2-weighted image (2050/91/1) (day 2) depicting swollen hyperintense thalami.
D, Isotropic diffusion-weighted image (6500/101/1) (day 2) showing mixed hyperintense and isointense thalami.
E, Isotropic ADC map (day 2) depicting hypointense thalamic core (suggesting cytotoxic edema) with hyperintense rim (suggesting vasogenic edema).
F, T2-weighted image (2050/91/1) (day 6) revealing less swollen but still hyperintense thalami.
G, Diffusion-weighted image (6500/101/1) (day 6) is unchanged from that of day 2.
H, ADC (day 6) showing decreased signal intensity of rim, suggesting resolving vasogenic edema.
I, T2-weighted image (2050/91/1) (day 11) depicting decrease in thalamic swelling and hyperintensity.
J, Diffusion-weighted image (6500/101/1) (day 11) showing decreased volume of signal change.
K, ADC (day 11) is normal.
Four subjects (subjects 7–10) underwent conventional MR imaging between 1 and 3 months after disease onset (Table).
Discussion
Knowledge of the pathogenesis of CVI is important both for accurate radiologic diagnosis and clinical management. Current diagnosis relies on the detection of parenchymal edema or hemorrhage in the presence of acute cerebral venous thrombosis. Should cytotoxic edema prove to be an early finding in CVI, then diffusion-weighted imaging could be used to provide an earlier diagnosis. This would likely affect clinical management, allowing earlier treatment. Furthermore, correct knowledge of disease pathogenesis may help in development of new therapies or prediction of prognosis.
We have used diffusion-weighted imaging to examine the hypothesis that cytotoxic edema is found in acute CVI in humans. In our small series, the majority of CVI showed a reduction in ADC in keeping with cytotoxic edema induced by tissue hypoperfusion. Only two areas failed to show this finding, both of which were hematomas, which may have obscured underlying cytotoxic edema. Further, we observed an increase in ADC over time, both for individual subjects and between subjects, following the pattern seen in both arterial infarction and animal models of CVI.
Diffusion-weighted imaging provides an early indicator of cerebral ischemic damage (17). Although the exact mechanism of diffusion restriction remains controversial, it is thought to indicate the presence of cytotoxic edema (17). In both arterial infarction and animal models of CVI, signal hyperintensity on diffusion-weighted images, reflecting restricted diffusion, reliably occurs before T2 changes (8, 18). In our study, all cases of CVI manifesting hyperintensity on diffusion-weighted images also showed T2 signal changes. This is probably explained by image timing, because we did not image any subjects hyperacutely, when diffusion restriction might have been present in the absence of T2 hyperintensity (8, 18).
We observed a trend for ADC to increase over time, again in keeping with patterns observed in both arterial infarction and animal models of CVI (8, 19, 20). Given the limited number of subjects and follow-up data in this study, a larger series would be required to confirm this finding. Although this temporal ADC change may in part reflect resolving cytotoxic edema, it also likely reflects increasing vasogenic edema. This is reflected by both an increase in T2 hyperintensity and ADC. Animal data suggest that vasogenic edema may occur earlier in CVI (1 hr) than in arterial infarction (4–6 hr) (8, 21). High venous pressures may play a role in this (7). The presence of early vasogenic edema would result in a different time course for both ADC and T2 hyperintensity. Our data support this: ADC rose to normal values by approximately day 4 compared with day 7 in cases of arterial infarction (22).
Our findings support animal models, which suggest that cytotoxic edema occurs early in developing CVI. When venous thrombosis is induced in the rat by direct injection of thrombogenic material into the superior sagittal sinus, parenchymal ADC decreases to −43% at 30 minutes (8). A steady increase in ADC occurs during the subsequent 2 days to ADC values of −16% by 2 days. Although our data show a similar temporal pattern, we did not observe such marked decreases in ADC. This may reflect the more gradual stepwise progression of venous thrombosis that occurs naturally in humans compared with the complete and rapid thrombosis induced in animal models.
Diffusion findings in human CVI are limited to three conflicting case reports. Two subjects showed a decrease in ADC, and one an increase. One of the ADC decreases was quantitatively similar to ours (−13% after 3 hours of symptom onset). The other showed a decrease even more marked than that found in the animal data (average = −63% at day 3). Subject 3 showed an ADC increase of 60% at day 1. By comparison, in human arterial infarction, ADC decreases by 20% to 40% during the first symptomatic day (23).
The small size of our series does not allow us to examine whether the extent of diffusion changes predicts prognosis. This would be an important hypothesis to explore, as clinical outcome from CVI is quite variable. In the case of arterial infarction, whereas the presence of diffusion hyperintensity in the main indicates prognosis to cell death and persistent neurologic deficit (24, 25), this is not always the case. In some instances, diffusion changes are associated with transient neurologic deficit and no evidence of permanent neurologic damage on subsequent MR images (26). In animal models of arterial infarction, the extent of ADC reduction is predictive of subsequent tissue damage (27, 28). We have shown that cytotoxic edema can be demonstrated early in the clinical course of CVI. Further studies may explore whether this finding can be translated into a measure indicative of clinical outcomes.
Conclusion
Cytotoxic edema, detected as an area of restricted diffusion on diffusion-weighted images, is a common finding in acute CVI in humans. This observation may help further elucidate the pathogenesis of CVI.
Footnotes
1 Presented at the 38th annual meeting of the American Society of Neuroradiology, Atlanta, GA; April 2000.
2 Supported in part by the Kodak Radiology Fund Bursary, Royal College of Radiologists, United Kingdom.
↵3 Address reprint requests to Joseph E. Heiserman, M.D., Division of Neuroradiology, Barrow Neurological Institute, St. Joseph's Hospital and Medical Center, 350 West Thomas Road, Phoenix, AZ 85013.
References
- Received May 15, 2000.
Clinical and imaging findings in individual subjects
- Copyright © American Society of Neuroradiology
In this issue


Jump to section
Related Articles
Cited By...
- Endovascular treatment for cerebral venous thrombosis: current status, challenges, and opportunities
- Absent Filling of Ipsilateral Superficial Middle Cerebral Vein Is Associated With Poor Outcome After Reperfusion Therapy
- Diagnosis and Management of Cerebral Venous Thrombosis: A Statement for Healthcare Professionals From the American Heart Association/American Stroke Association
- Compromise of Brain Tissue Caused by Cortical Venous Reflux of Intracranial Dural Arteriovenous Fistulas: Assessment With Diffusion-Weighted Magnetic Resonance Imaging
- Pathomechanisms of Symptomatic Developmental Venous Anomalies
- Management of Stroke in Infants and Children: A Scientific Statement From a Special Writing Group of the American Heart Association Stroke Council and the Council on Cardiovascular Disease in the Young
- Are Steroids Useful to Treat Cerebral Venous Thrombosis?
- Diffusion-Weighted Imaging of Cerebritis
- Reversible parkinsonism and MRI diffusion abnormalities in cortical venous thrombosis