
Abstract
BACKGROUND AND PURPOSE: The extent of abnormalities on T2-weighted MR images of the brain of patients with clinically isolated syndromes (CIS) suggestive of multiple sclerosis (MS) at presentation is associated with an increased risk of developing clinically definite MS (CDMS). We evaluated whether subtle changes outside T2-visible lesions are present in the brain of these patients and whether their extent increases the risk of subsequent development of CDMS.
METHODS: Dual-echo, T1-weighted, and magnetization transfer (MT) images of the brain were obtained from 24 patients with CIS at presentation. These patients were followed up for a mean period of 33 months (range, 25–42 months). Twenty age- and sex-matched healthy volunteers served as control subjects. To create MT histograms of the normal-appearing brain tissue (NABT), macroscopic lesions were segmented from dual-echo images, were superimposed automatically, and were nulled out from the coregistered and scalp-stripped MT ratio (MTR) maps. The following MTR histogram-derived measures were considered: average MTR, MTR25, MTR50, MTR75, peak height, and peak position. T2 and T1 lesion loads, average lesion MTR, and brain volume were also measured.
RESULTS: Patients with CIS had lower average NABT-MTR (P < .0001) and peak position (P = .002) than did control volunteers, but patient brain size was similar to that of volunteers. At follow-up, 10 (41%) patients developed CDMS. Patients who developed CDMS during the follow-up period had higher T2 lesion volume (P = .003) and lower average NABT-MTR (P = .005) and peak position (P = .006) than did those who did not develop CDMS. T2 lesion volume (odd ratio, 3.54; P = .0005) and average NABT-MTR (odd ratio, 0.81; P = .01) were independent predictors of the subsequent development of CDMS.
CONCLUSION: Subtle changes occur outside lesions visible on conventional MR images among patients with CIS suggestive of MS at presentation. The greater the extent of such abnormalities is, the higher is the risk of subsequent development of CDMS.
T2-weighted MR imaging of the brain reveals multifocal asymptomatic white matter abnormalities in 50% to 70% of patients with clinically isolated syndromes (CIS) suggestive of multiple sclerosis (MS) (1–17). These abnormalities are indistinguishable from those seen in cases of clinically definite MS (CDMS), and their presence and extent markedly increase the risk of developing CDMS (5–17).
In patients with CDMS, microscopic changes in the white matter outside T2-visible lesions are frequently detected using several MR techniques, including magnetization transfer (MT) imaging (18–24). In this study, we obtained MT ratio (MTR) histograms of the normal-appearing brain tissue (NABT) to evaluate whether changes outside T2-visible lesions are seen in the brain of patients with CIS at presentation and to assess whether their extent increases the likelihood of subsequent development of CDMS.
Methods
Patients
We performed MR imaging of the brain in all patients presenting with CIS suggestive of MS between August 1995 and February 1997. In addition to the criteria previously used to select patients with CIS at presentation for prognostic studies (12, 14, 15, 17), we required that the patients had to have at least four T2 lesions of the type seen in cases of CDMS or only three of such lesions if one of them was either subcortical or infratentorial. This was to minimize the chance of recruiting patients with neurologic conditions other than MS, as shown by a recent prospective study (25). When MR images were obtained, a full neurologic assessment was conducted by a single observer who was unaware of the MR findings, and the disability was rated using the Expanded Disability Status Scale score (26). Patients were then prospectively followed up by the same neurologists, with visits scheduled every 6 months, or when the patients experienced new symptoms. The follow-up duration was a mean of 33 months (range, 25–42 months). During the follow-up period, MS was diagnosed solely on clinical grounds by using the Poser criteria (27); paraclinical data were not used. Twenty sex- and age-matched control volunteers (eight men and 12 women; mean age, 33.8 years; SD, 5.0 years) with no history of neurologic diseases and with normal results of their neurologic examinations were also studied. Local Ethical Committee approval and written informed consent from all the patients and control volunteers were obtained before study initiation.
Image Acquisition
MR images of the brain were obtained using an imager operating at 1.5 T. During a single session, the following images were obtained: dual-echo spin-echo (2400/30, 80/1 [TR/TE/excitations]); T1-weighted spin-echo (768/15/2); and 2D gradient-echo (600/12, α = 20°), with and without an MT saturation pulse. The RF saturation pulse was 1.5 kHz below the water frequency, with a gaussian envelope of duration of 16.4 ms, a bandwidth of 250 Hz, and an amplitude of 3.4 × 10⁻⁶ T. For the dual-echo and T1-weighted images, 24 contiguous, interleaved, axial sections were acquired with 5-mm section thickness, a 256 × 256 matrix, and a 250 × 250-mm field of view. MT images were obtained using the same acquisition parameters, except for the number of sections, which was 20. The set of sections for the MT images was positioned to obtain the same central 20 sections as for the dual-echo and T1-weighted images. The sections were positioned to run parallel to a line that joins the most inferoanterior and inferoposterior parts of the corpus callosum, according to published guidelines (28).
Image Analysis
Lesions were first identified by agreement between two experienced observers who did not know to whom the images belonged, on the dual-echo and T1-weighted hard copies, following a procedure described elsewhere (29). Using four contiguous T1-weighted sections, with the most caudal section at the level of the velum interpositum cerebri (30), we calculated an MR measure of cerebral volume. Brain and lesion volume measurements were obtained by a single observer, who did not know to whom the images belonged, using a semiautomated segmentation technique based on local thresholding (29).
From the two gradient-echo images, with and without the saturation pulse, and after their coregistration, MTR maps were derived pixel-by-pixel, as previously described (29). Lesion outlines on proton density–weighted images were superimposed onto the coregistered MTR maps and average lesion MTR was calculated. We also derived MTR histograms (with bins 1% in width) for the NABT (ie, the overall brain tissue not involved by lesions visible on the dual-echo images). First, we removed the skull and other extracranial tissues from the proton density–and gradient-echo images without and with the MT pulse, using the same local thresholding technique as that used for lesion segmentation (29). Second, the scalp-stripped gradient-echo images were coregistered and MTR maps obtained. The MTR maps were then coregistered with the corresponding scalp-stripped proton density–weighted images. Coregistration of images was performed using a surface-matching technique that fits the contours corresponding to the CSF-dura interface of the two MR images (31, 32). Finally, the macroscopic lesions segmented on proton density–weighted images were superimposed automatically onto the coregistered MTR map, and the areas corresponding to the segmented lesions were nulled. For comparability of results, the entire procedure, except the removal from the MTR maps of the tissue belonging to macroscopically visible T2 lesions, was performed also for the images of the control volunteers. To minimize the inclusion of pixels with partial volume averaging from the CSF, we excluded from the analysis all the pixels with MTR values lower than 10%. To correct for the between-patient differences in brain volume, each histogram was normalized by dividing it by the total number of pixels included. For each histogram, several parameters were analyzed: the height and the position of the histogram peak, with respect to the x axis, the average MTR value, and the MTR values corresponding to the 25th, 50th, and 75th percentiles of the histogram (ie, MTR25, MTR50, and MTR75) that indicate the MTR value at which the integral of the histogram is 25%, 50%, and 75% of the total, respectively.
Statistical Analysis
Differences in MR and MT imaging metrics between patients and control volunteers and between patients who developed CDMS and those who did not were evaluated using a two-tailed Student's t test for nonpaired data. A multivariate analysis with a logistic model was conducted to evaluate the MR and MT imaging variables that independently influenced the probability of patients developing CDMS. The independent variables included in the model were the hyperintense T2 lesion load, the hypointense T1 lesion load, the average lesion MTR, and the average MTR of the NABT.
Results
Twenty-four patients (11 men and 13 women) were included in the study. The mean patient age was 27.2 years (SD, 5.6 years), the mean duration between clinical onset and MR acquisition was 16 days (range, 3–38 days), and the median Expanded Disability Status Scale score was 1.0 (range, score of 0.0–1.5). Ten patients had isolated syndrome of the brain, nine had unilateral acute optic neuritis, and five had isolated spinal cord syndrome. In all patients, CSF analysis was also conducted. CSF oligoclonal bands were found in 20 (83%) patients. At follow-up, 10 (41%) patients (four men and six women) developed CDMS. There were no significant differences in any of the baseline clinical characteristics among patients with different clinical presentations or between those who did and did not develop CDMS during the follow-up period. At follow-up, the median Expanded Disability Status Scale score was 0.5 for patients who did not develop CDMS and 1.5 for patients who did (P = not significant).
No abnormalities were found on the images of the control volunteers. In the entire cohort of patients with CIS, the mean hyperintense T2 lesion volume was 6.3 mL (range, 0.6–25.4 mL), the mean hypointense T1 lesion volume was 0.2 mL (range, 0.0–1.0 mL), and the average lesion MTR was 40.5% (SD, 2.0%). No significant differences in any of the MR or MT imaging–derived metrics studied were found among patients with different clinical presentations. In Table 1, the hyperintense T2 and hypointense T1 lesion volumes together with average lesion MTR for the patients who developed CDMS during the follow-up period and those who did not are reported. Patients who developed CDMS during the follow-up period had significantly higher T2 and T1 lesion volumes and significantly lower average lesion MTR than did those who did not develop CDMS. The mean brain volume was 386 mL (SD, 20 mL) for control volunteers, 384 mL (SD, 36 mL) for patients with CIS and no further clinical evolution, and 356 mL (SD, 20 mL) for patients with CIS who subsequently developed CDMS (these differences were not statistically significant).
Lesion loads on T2- and T1-weighted scans and average lesion MTR at presentation in patients not developing and developing CDMS
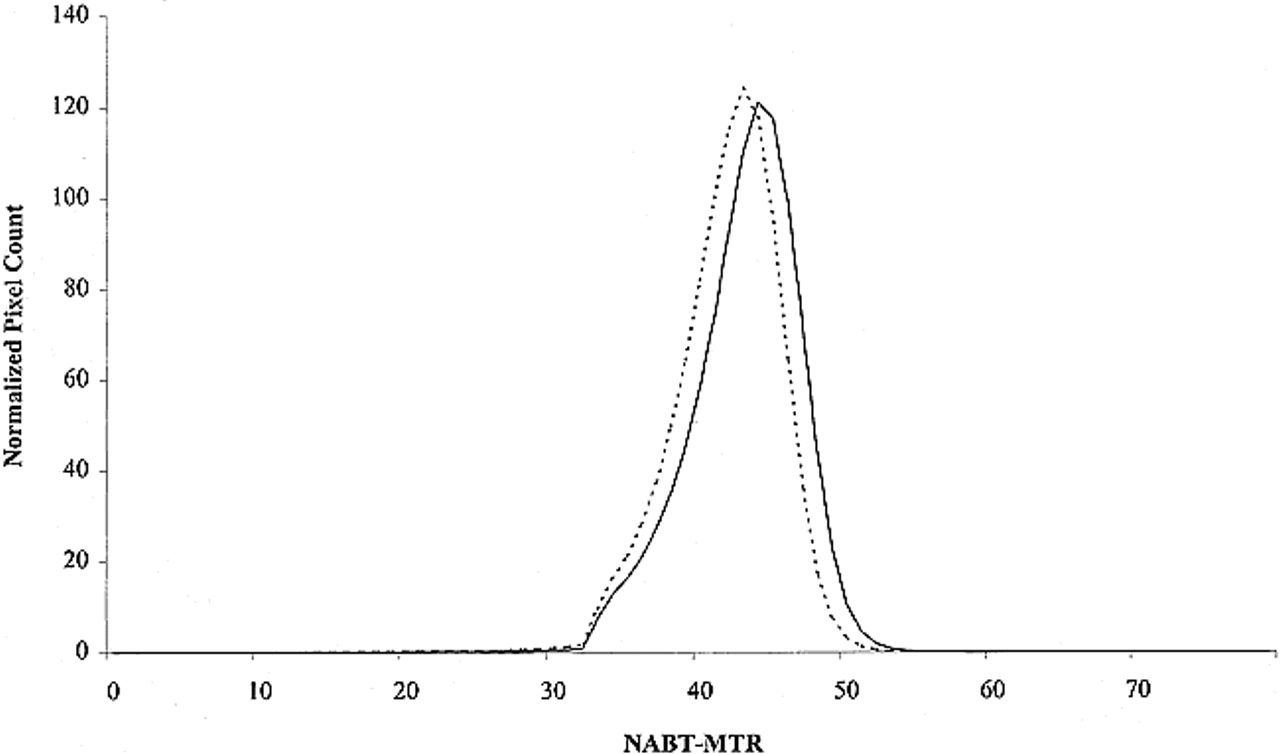
In Table 2, NABT-MT metrics from control volunteers and the entire cohort of patients with CIS are reported. Patients with CIS had significantly lower average NABT-MTR, MTR25, MTR50, MTR75, and peak position than did control volunteers. In Table 3, NABT-MT metrics from patients who developed CDMS during the follow-up period and from those who did not are reported. In Figure 1, the mean NABT-MTR histograms for the two groups of patients are presented. Patients developing CDMS had significantly lower average NABT-MTR, MTR25, MTR50, MTR75, and peak position than did those who did not develop CDMS. The multivariate analysis showed that the T2 lesion volume (odd ratio, 3.54; P = .0005) and the average NABT-MTR (odd ratio, 0.81; P = .01) were independent predictors of the subsequent development of CDMS. All the other factors were excluded from the multiple regression model.
MTR histogram metrics in the NABT from control subjects and patients with CIS at presentation
NABT-MTR histogram metrics at presentation in patients not developing and developing CDMS

MTR histograms of the NABT of patients with CIS at presentation who developed CDMS during the follow-up period (continuous line) and of patients with CIS at presentation who did not develop CDMS during the follow-up period (dotted line)
Discussion
This study shows that microscopic changes outside T2-visible lesions do occur in patients with CIS suggestive of MS at presentation and that the greater their extent is, the higher is the risk of subsequent development of new neurologic symptoms leading to a diagnosis of CDMS.
Previous pathologic studies (33–35) indicated that astrocytic hyperplasia, patchy edema, perivascular infiltration, abnormally thin myelin, and axonal loss can occur in the brain white matter outside macroscopic lesions of patients with MS. All these abnormalities can modify the relative proportions of mobile and immobile protons of the diseased tissue and, as a consequence, determine a decrease of its MTR. Previous studies have found decreased MTR values in small regions of the brain spared by T2-visible lesions from patients with CDMS (18–22). In the present study, we obtained MTR histograms of the overall NABT from patients with CIS at presentation, by accurately removing from the coregistered MTR maps all the pixels known to belong to T2-visible lesions. Because normal-appearing white matter represents the largest part of NABT included in our MTR histograms, we think that microscopic white matter abnormalities rather than abnormalities in the gray matter (ie, cerebral and cerebellar cortex and basal ganglia) may be responsible for the differences in MTR histogram–derived metrics between patients with CIS at presentation and control volunteers. Nevertheless, it is clear that lesions in or adjacent to the cerebral cortex, which can be imaged using fast fluid-attenuated inversion-recovery sequences (36–38), may have been missed in the present study and may also have contributed to the MTR histogram findings. On the contrary, the role of pathologic changes in the basal ganglia is likely to be minor, if present at all, because of the low frequency of clinical (39) or MR (40) involvement of these structures, even in patients with CDMS.
Previous studies showed that the presence and extent of T2 lesions are associated with an increased risk of developing CDMS in subsequent years (5–17). This study confirms these observations and shows that, in patients with CIS at presentation and on MR images suggestive of MS (25), microscopic changes occurring outside T2-visible lesions also influence the subsequent evolution of the disease. Although not confirmed by all (41), previous studies showed that MTR (21, 42) or MR spectroscopy (43) changes can be detected in the normal-appearing white matter subsequently involved by new MS lesions. Although MTR histogram analysis is inevitably not sensitive to a small amount of disease in the NABT, our results suggest that the larger the extent of microscopic abnormalities that can act as foci for the development of new macroscopic lesions is, the greater is the risk that one of these is located in a clinically eloquent area and, as a consequence, is liable to determine new neurologic symptoms. Admittedly, the presence of enhancing lesions on MR images of patients with CIS at presentation is also an important predicting factor of subsequent conversion to CDMS (25). In the present study, however, we did not obtain contrast-enhanced MR images, because some, but not all, patients received different regimens of steroid treatment during the time elapsing between clinical presentation and MR acquisition. This would have inevitably confounded the results when evaluating the presence and extent of contrast enhancement.
We also assessed the degree and amount of tissue damage within macroscopic lesions from patients with CIS by measuring the average lesion MTR and the hypointense T1 lesion load. In patients with relapsing-remitting or secondary-progressive MS, the average lesion MTR tends to be lower than that which we found in our patients with CIS (29) and the proportion of hypointense T1 lesions is higher (44, 45) (ie, approximately 15–30% versus approximately 2% in the present study). The paucity and mildness of intrinsic lesion damage may be why it does not seem to have a relevant influence on the subsequent disease course. The paucity of macroscopic lesions seen in patients with CIS also suggests that the subtle changes potentially responsible for our MTR histogram findings are at least partially independent of larger abnormalities rather than being secondary to the damage of axons traversing macroscopic lesions and resulting in Wallerian degeneration in areas away from them.
Footnotes
↵1 This work was supported in part by a grant from the Neurology School of the University of Chieti (to G.I.).
2 Address reprint requests to Massimo Filippi, MD, Neuroimaging Research Unit, Department of Neuroscience, Scientific Institute Ospedale San Raffaele, Via Olgettina, 60, 20132 Milan, Italy.
References
- Received October 5, 1999.
- Copyright © American Society of Neuroradiology
In this issue


Jump to section
Related Articles
Cited By...
- The Prognostic Utility of MRI in Clinically Isolated Syndrome: A Literature Review
- Evidence for neuroprotection and remyelination using imaging techniques
- Axonal injury in early multiple sclerosis is irreversible and independent of the short-term disease evolution
- Progressive ventricular enlargement in patients with clinically isolated syndromes is associated with the early development of multiple sclerosis
- Normal-appearing brain tissue MTR histograms in clinically isolated syndromes suggestive of MS
- Correlation of Multiple Sclerosis Measures Derived from T2-Weighted, T1-Weighted, Magnetization Transfer, and Diffusion Tensor MR Imaging
- Magnetization Transfer Imaging in Patients with Clinically Isolated Syndromes Suggestive of Multiple Sclerosis
- Measurement of spinal cord area in clinically isolated syndromes suggestive of multiple sclerosis