
Article Figures & Data
Figures
FIG 1. 63-year-old woman with a recurrent anaplastic astrocytoma verified by surgical resection.
A, Contrast-enhanced T1-weighted MR image (690/14/1; section thickness, 5 mm) shows a focally enhancing area (arrow) with a surrounding nonenhancing zone of low intensity and mass effect in the right frontal lobe.
B, Anaplastic astrocytoma appears as an area of hyervascularity (arrow) on rCBV map (normalized rCBV ratio, 4.45).
C, Histologic specimen shows densely accumulated tumor cells (hematoxylin-eosin, original magnification × 200).
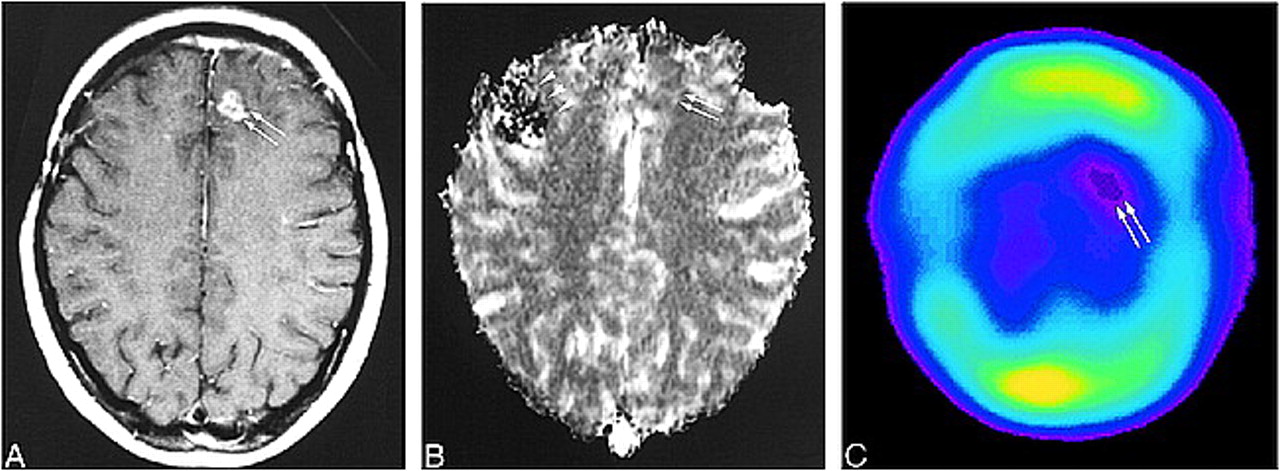
FIG 2. 78-year-old man with a recurrent glioblastoma. The diagnosis was determined by the progressively enlarging area of enhancement on serial MR images and by the patient's clinical deterioration.
A, Contrast-enhanced T1-weighted MR image (690/14/1; section thickness, 5 mm) shows inhomogeneous enhancement (arrows) with surrounding nonenhancing zone of low intensity and mass effect in the right temporoparietal lobe.
B, The recurrent tumor is seen as an area of hypovascularity (arrows) on the rCBV map (normalized rCBV ratio, 0.83).
C, 201Tl-SPECT scans show abnormal uptake in the area of recurrent tumor (arrow), consistent with tumor recurrence.
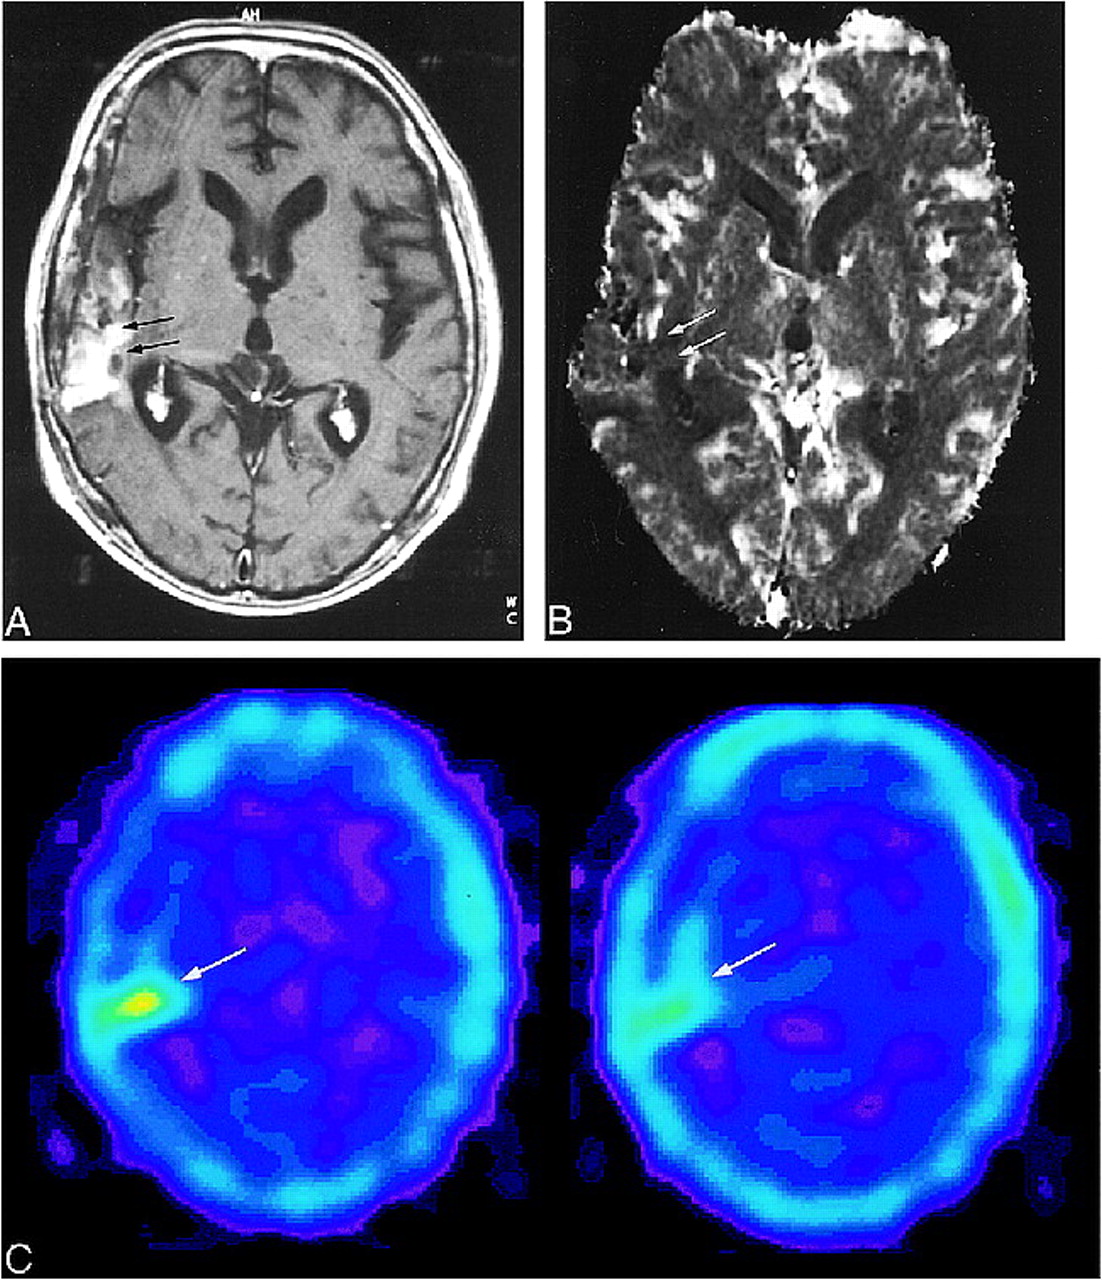
FIG 3. 29-year-old man with radiation necrosis (verified by stereotactic biopsy) who had undergone subtotal tumor resection followed by conventional radiation therapy (60 Gy) and systemic chemotherapy 26 months earlier. Ten months later, tumor recurrence was found, and was treated by subtotal resection and chemotherapy.
A, Contrast-enhanced T1-weighted MR image (690/14/1; section thickness, 5 mm) shows enhanced area (arrow) within surrounding nonenhancing zone of low intensity and mass effect in the left temporal lobe.
B, Radiation necrosis appears as an area of hyovascularity (arrow) on the rCBV map (normalized rCBV ratio, 0.56).
C, Histologic specimen shows avascular areas, consistent with radiation necrosis (hematoxylin-eosin; original magnification × 200).
FIG 4. 49-year-old man without tumor recurrence. The diagnosis was based on the decreasing size of the enhanced area on serial MR images.
A, Contrast-enhanced T1-weighted MR image (690/14/1; section thickness, 5 mm) shows a small focus of enhancement (arrow) within surrounding nonenhancing zone of low intensity and mass effect in the left frontal lobe.
B, Enhanced area appears as a region of hypervascularity (arrows) on the rCBV map (normalized rCBV ratio, 1.79).
FIG 5. 20-year-old woman without tumor recurrence. The diagnosis was based on the disappearance of the enhancing area on serial MR images.
A, Contrast-enhanced T1-weighted MR image (690/14/1; section thickness, 5 mm) shows a small focus of enhancement (arrows) within surrounding nonenhancing zone of low intensity and mass effect in the left frontal lobe.
B, The enhancing area appears mildly hypervascular (arrows) on the rCBV map (normalized rCBV ratio, 1.17). The effects of previous surgery can be seen as susceptibility artifacts in right frontal region (arrowheads).
C, 201Tl-SPECT scan shows no abnormal uptake in the enhancing lesion (arrows), consistent with lack of tumor recurrence.
FIG 6. Relationship between normalized rCBV ratios in patients with tumor recurrence and those with nonneoplastic contrast-enhancing tissue
FIG 7. Relationship between thallium indexes in patients with tumor recurrence and those with nonneoplastic contrast-enhancing tissue


Tables

Results of a comparison between perfusion-sensitive MR imaging and 201TI-SPECT
In this issue


Jump to section
Related Articles
Cited By...
- Identification of a Single-Dose, Low-Flip-Angle-Based CBV Threshold for Fractional Tumor Burden Mapping in Recurrent Glioblastoma
- Multisite Concordance of DSC-MRI Analysis for Brain Tumors: Results of a National Cancer Institute Quantitative Imaging Network Collaborative Project
- Differentiation between Radiation Necrosis and Tumor Progression Using Chemical Exchange Saturation Transfer
- Multiparametric Evaluation in Differentiating Glioma Recurrence from Treatment-Induced Necrosis Using Simultaneous 18F-FDG-PET/MRI: A Single-Institution Retrospective Study
- ASFNR Recommendations for Clinical Performance of MR Dynamic Susceptibility Contrast Perfusion Imaging of the Brain
- Pixel-by-Pixel Comparison of Volume Transfer Constant and Estimates of Cerebral Blood Volume from Dynamic Contrast-Enhanced and Dynamic Susceptibility Contrast-Enhanced MR Imaging in High-Grade Gliomas
- Utility of Intravoxel Incoherent Motion MR Imaging for Distinguishing Recurrent Metastatic Tumor from Treatment Effect following Gamma Knife Radiosurgery: Initial Experience
- Histogram Analysis of Intravoxel Incoherent Motion for Differentiating Recurrent Tumor from Treatment Effect in Patients with Glioblastoma: Initial Clinical Experience
- Anti-Invasive Adjuvant Therapy with Imipramine Blue Enhances Chemotherapeutic Efficacy Against Glioma
- Does MR Perfusion Imaging Impact Management Decisions for Patients with Brain Tumors? A Prospective Study
- Imaging biomarkers of angiogenesis and the microvascular environment in cerebral tumours
- Conventional MRI evaluation of gliomas
- Imaging hypoxia in gliomas
- Diagnostic Dilemma of Pseudoprogression in the Treatment of Newly Diagnosed Glioblastomas: The Role of Assessing Relative Cerebral Blood Flow Volume and Oxygen-6-Methylguanine-DNA Methyltransferase Promoter Methylation Status
- Optimized Preload Leakage-Correction Methods to Improve the Diagnostic Accuracy of Dynamic Susceptibility-Weighted Contrast-Enhanced Perfusion MR Imaging in Posttreatment Gliomas
- MR Spectroscopy in Radiation Injury
- Relative Cerebral Blood Volume Values to Differentiate High-Grade Glioma Recurrence from Posttreatment Radiation Effect: Direct Correlation between Image-Guided Tissue Histopathology and Localized Dynamic Susceptibility-Weighted Contrast-Enhanced Perfusion MR Imaging Measurements
- Distinguishing Recurrent Intra-Axial Metastatic Tumor from Radiation Necrosis Following Gamma Knife Radiosurgery Using Dynamic Susceptibility-Weighted Contrast-Enhanced Perfusion MR Imaging
- Dynamic Magnetic Resonance Perfusion Imaging of Brain Tumors
- Diffusion weighted imaging in radiation necrosis
- Blood Volume of Gliomas Determined by Double-Echo Dynamic Perfusion-Weighted MR Imaging: A Preliminary Study