
Article Figures & Data
Figures
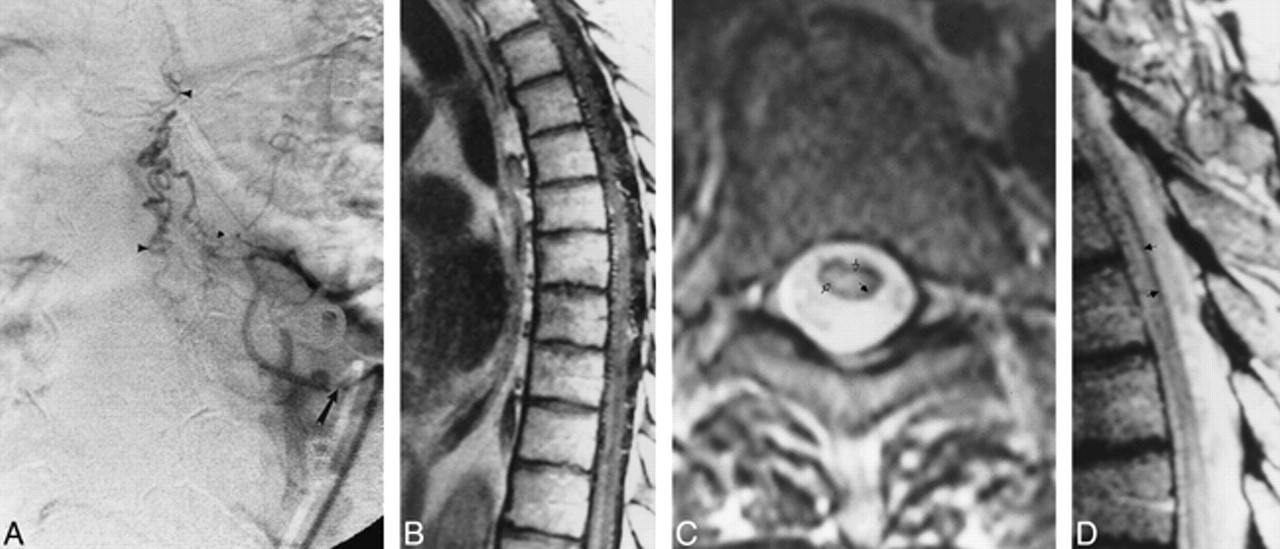
Fig 1. A, Anteroposterior view of spinal angiogram (injection of intercostal artery) shows filling of an SDAVF with pial drainage (arrowheads; arrow indicates catheter tip).
B, Sagittal contrast-enhanced T1-weighted (500/11) MR image shows enhancing enlarged pial vessels as well as intrinsic cord enhancement.
C, Axial FSE T2-weighted (4500/90) image shows peripheral hypointensity (closed arrow) with increased central cord signal (open arrows).
D, Sagittal FSE T2-weighted (2700/85eff) image shows enlarged pial vessels, central increased signal, and peripheral hypointense rim (arrows).
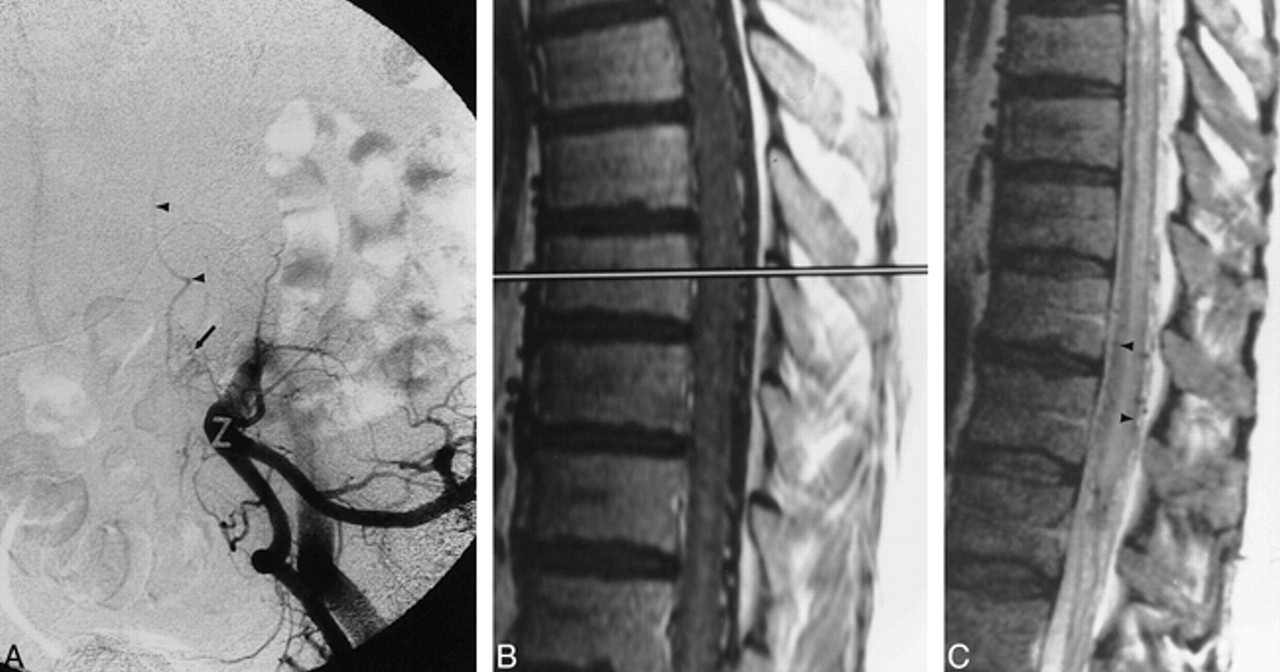
Fig 2. A, Anteroposterior view of spinal angiogram shows early filling of pial venous drainage (arrowheads) from spinal DAVF (arrow indicates catheter tip).
B, Sagittal FSE T2-weighted (5600/100eff) MR image shows enlarged pial vessels, central increased cord signal, and rim of peripheral hypointensity (arrowheads).
Fig 3. A, Anteroposterior subtracted view of early arterial-phase injection of the left hypogastric artery shows dural AVF (arrow) with sacral feeding vessels. Arrowheads signify draining veins.
B, Sagittal contrast-enhanced T1-weighted (400/14) MR image shows intraparenchymal cord enhancement as well as enhancement of enlarged vessels on the cord surface.
C, Sagittal FSE T2-weighted (4400/100eff) image shows multiple flow voids on the cord surface, increased signal intensity within the central cord, as well as a rim of peripheral hypointensity (arrowheads).
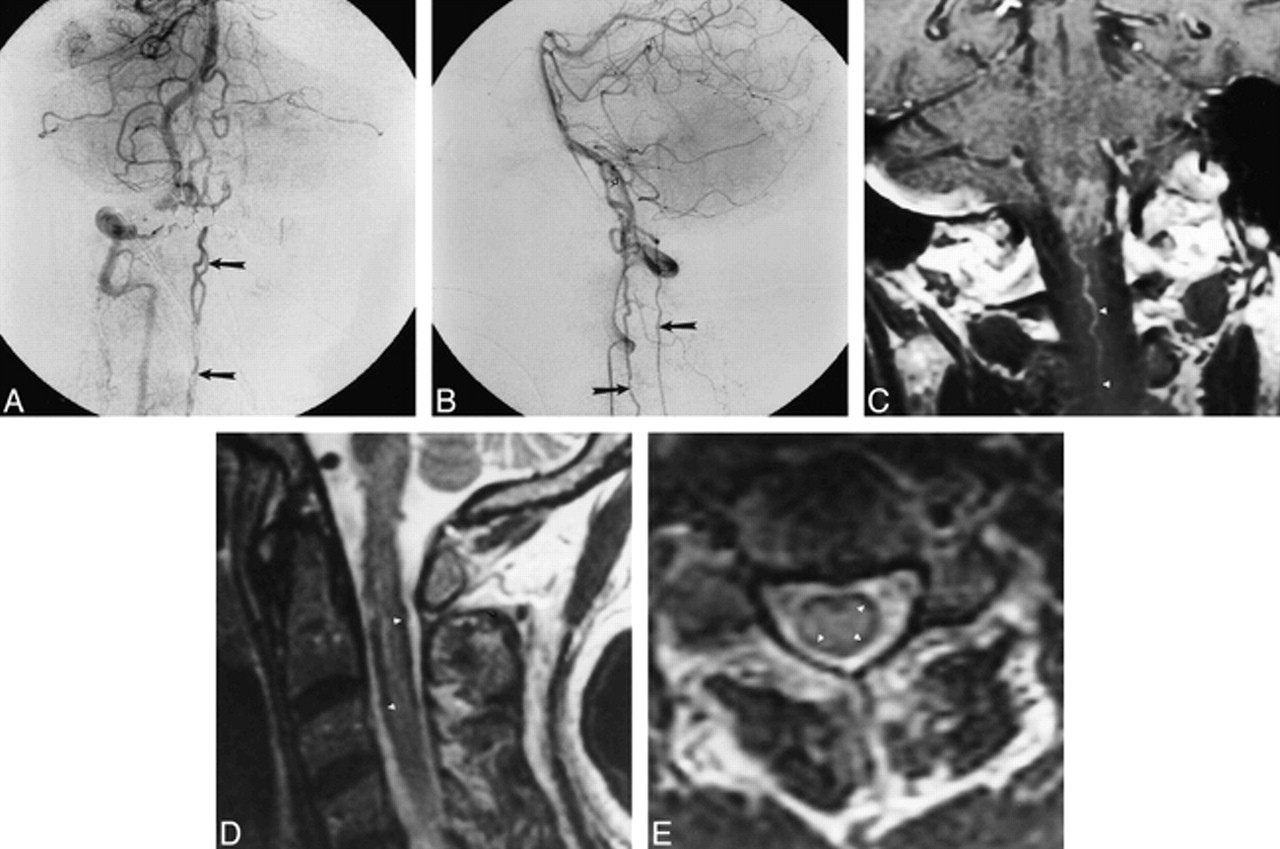
Fig 4. A and B, Late arterial-phase anteroposterior (A) and lateral (B) right vertebral artery injection shows filling of dural arteriovenous fistula (open arrow, B) originating from intradural vertebral artery. Drainage along cervical spinal cord is visible in both views (closed arrows).
C, Coronal contrast-enhanced MR image shows intraaxial cervicomedullary enhancement and enlarged pial cervical vein (arrowheads).
D and E, Sagittal (3733/100eff) (D) and axial (4000/100eff) (E) T2-weighted images of cervical cord show subpial hypointensity (arrowheads).
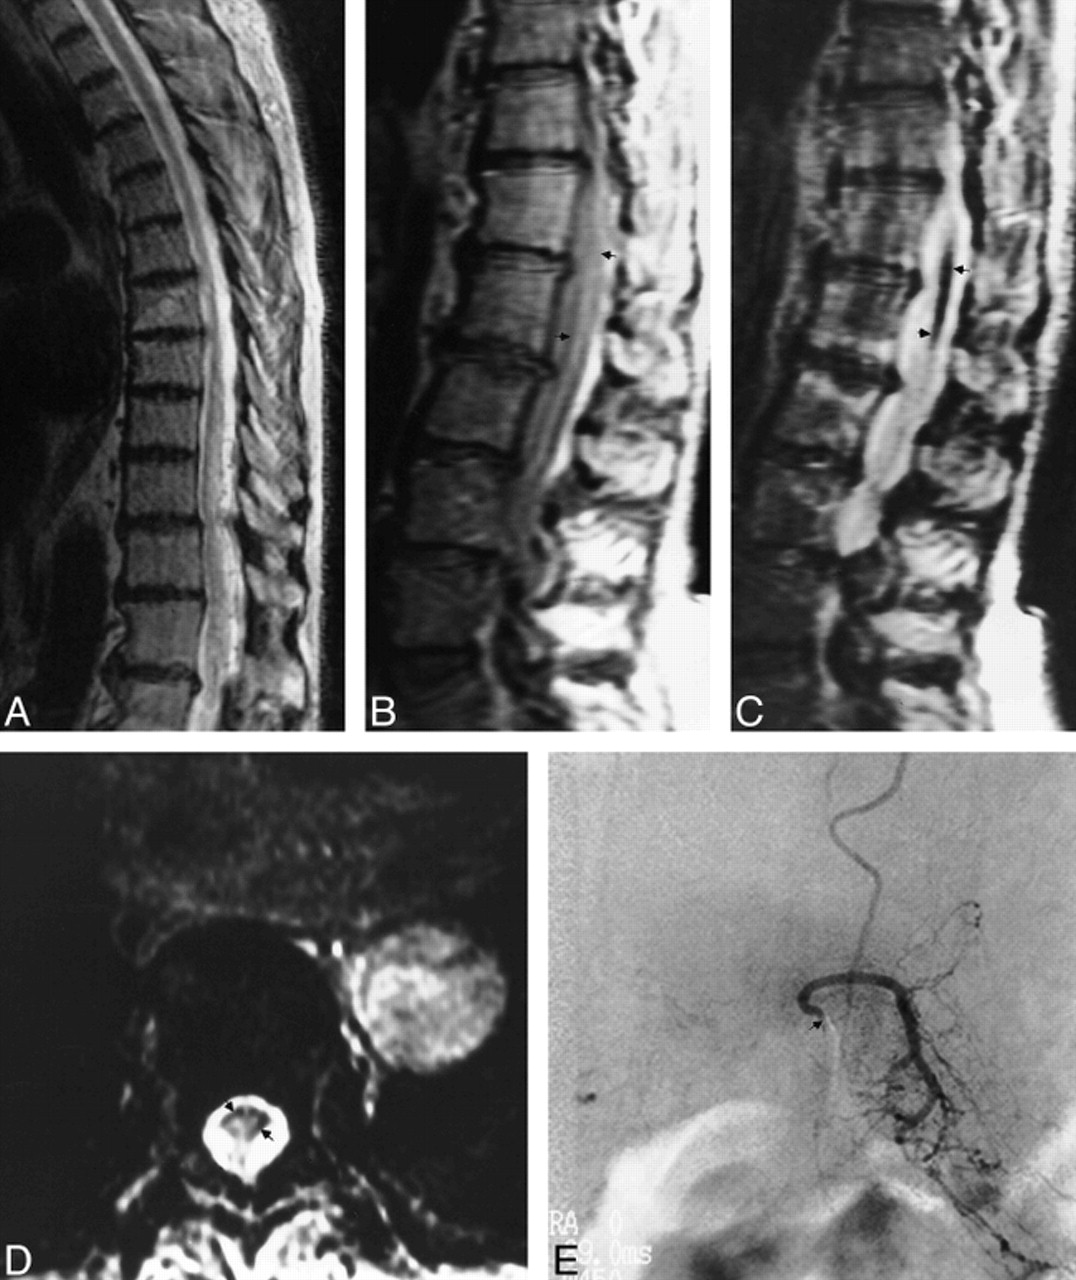
Fig 5. A, Sagittal FSE T2-weighted (5417/98) MR image shows increased central cord signal with subtle peripheral hypointensity.
B and C, Sagittal proton density–weighted (2500/20) (B) and true T2-weighted (2500/80) (C) images show decrease in cord signal intensity (arrows).
D, Axial gradient-echo (117/20) image shows increased conspicuity of peripheral hypointensity (arrows).
E, Anteroposterior view of left L1 injection shows filling of dural arteriovenous fistula (arrow indicates catheter tip).


