
Article Figures & Data
Figures
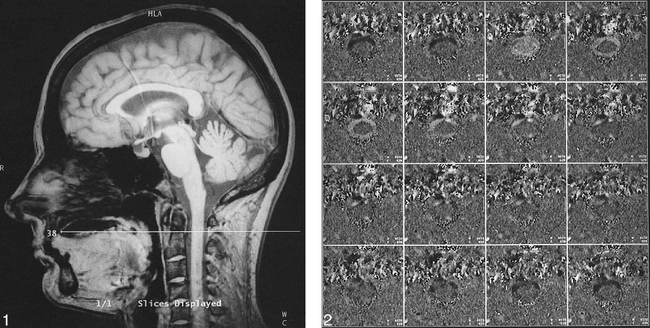
fig. 1. Sagittal reference image with axial section perpendicular to the spinal canal at the level of C2.fig. 2. Phase-contrast images (partitions 1 through 16) corresponding to figure 1
fig. 3. Volumetric motion (mean values) of the upper cervical intradural space as a whole. There are no significant differences between patients and control subjects
fig. 4. Flow rates (mean values) of anterior cervical CSF motion. Significant differences are seen between patients and control subjects at 0%, 44%, and 69% of the cardiac cycle
fig. 5. Flow rates (mean values) of posterior cervical CSF motion. There are significant differences between patients and control subjects at 75% of the cardiac cycle
fig. 6. Volumetric motion (mean values) of the upper cervical cord. Significant differences are seen between patients and control subjects at 69% and 81% of the cardiac cycle


Tables
 TABLE 1:
Comparison of area measurements between control subjects and patients
- TABLE 2:
Comparison of maximum volumetric flow and motion rates between control subjects and patients
- TABLE 3:
Comparison of area measurements between patients with and without syrinx
- TABLE 4:
Comparison of maximum volumetric flow and motion rates between patients with and without syrinx


In this issue


Jump to section
Related Articles
Cited By...
- Quantitative comparison between aMRI and DENSE for the assessment of brain tissue motion
- The Restless Spinal Cord in Degenerative Cervical Myelopathy
- The myodural bridge of the American alligator (Alligator mississippiensis) alters CSF flow
- Relationship between Cough-Associated Changes in CSF Flow and Disease Severity in Chiari I Malformation: An Exploratory Study Using Real-Time MRI
- Spinal Fluid Biomechanics and Imaging: An Update for Neuroradiologists
- Patient-Specific 3D Simulation of Cyclic CSF Flow at the Craniocervical Region
- Tapering of the Cervical Spinal Canal in Patients with Chiari I Malformations
- CSF Flow through the Upper Cervical Spinal Canal in Chiari I Malformation
- Cough-Associated Headache in Patients with Chiari I Malformation: CSF Flow Analysis by Means of Cine Phase-Contrast MR Imaging
- Peak CSF Velocities in Patients with Symptomatic and Asymptomatic Chiari I Malformation
- Characterization of Cyclic CSF Flow in the Foramen Magnum and Upper Cervical Spinal Canal with MR Flow Imaging and Computational Fluid Dynamics
- CSF Flow Dynamics at the Craniovertebral Junction Studied with an Idealized Model of the Subarachnoid Space and Computational Flow Analysis
- Characterization of CSF Hydrodynamics in the Presence and Absence of Tonsillar Ectopia by Means of Computational Flow Analysis
- Effect of Craniocervical Decompression on Peak CSF Velocities in Symptomatic Patients with Chiari I Malformation
- CSF Flow Dynamics in Chiari I Malformation