
Abstract
BACKGROUND AND PURPOSE: Upper motor neuron degeneration varies in different phenotypes of MND. We used single-voxel MR spectroscopy of the primary motor cortex to detect corticomotoneuron degeneration and glial hyperactivity in different phenotypes of MND with a relatively short disease duration, contributing to further delineation of the phenotypes.
MATERIALS AND METHODS: We prospectively included patients with ALS-B, ALS-L, and PMA and compared their data with those of patients with PLS and healthy controls. Each cohort consisted of 12 individuals. Disease duration was <1 year in ALS and PMA, but longer in PLS by definition. Follow-up examination was at 6 months. We measured ALSFRS-R, finger- and foot-tapping speed, and levels of the following: 1) NAAx, 2) mIns, and 3) Glx in the primary motor cortex.
RESULTS: At baseline, we found significantly decreased NAAx levels and increased mIns levels in PLS. Levels of NAAx and mIns in patients with ALS-L and ALS-B were not significantly different from those in controls, but NAAx levels were significantly lower compared with those in PMA. At follow-up, only in PMA was a decrease of NAAx demonstrated. Glx levels varied widely in all groups. Levels of NAAx and mIns correlated well with clinical variables.
CONCLUSIONS: Metabolite changes suggest neuronal dysfunction and active glial involvement in PLS. The corticomotoneuron is affected in early ALS-B and ALS-L, but at a later stage also in PMA. MR spectroscopy data are useful to obtain insight into the disease process at the level of the upper motor neuron in various phenotypes of MND.
Abbreviations
- ALS
- amyotrophic lateral sclerosis
- ALS-B
- bulbar onset ALS
- ALSFRS-R
- Revised ALS Functional Rating Scale
- ALS-L
- limb-onset ALS
- CI
- confidence interval
- Glx
- glutamate + glutamine
- L
- left
- mIns
- myo-inositol
- MND
- motor neuron disease
- MRS
- MR spectroscopy
- NA
- not applicable
- NAA
- N-acetylaspartate
- NAAx
- N-acetylaspartate + N-acetyl aspartylglutamate
- NS
- not significant
- PLS
- primary lateral sclerosis
- PMA
- progressive muscular atrophy
- R
- right
- ROC
- receiver operating characteristic analysis
- VC
- vital capacity
ALS is characterized by progressive upper motor neuron and lower motor neuron degeneration and poor prognosis.1,2 Whether the primary target of disease in ALS is the upper motor neuron, the lower motor neuron, or both simultaneously remains controversial.3,–,5
Other diseases within the spectrum of MND include PMA and PLS. PMA is defined by progressive lower motor neuron signs and is diagnosed after exclusion of other lower motor neuron syndromes.6 There is accumulating evidence that the prognosis of PMA resembles that of ALS and that upper motor neuron signs may occur in the course of the disease.7,–,9 PLS is a pure upper motor neuron syndrome of slowly progressive spinobulbar spasticity. Diagnosis requires exclusion of other upper motor neuron syndromes and a duration of 3–4 years to exclude upper motor neuron−dominant ALS. Survival is generally longer in PLS than that in ALS.10,11 The exact relationship between PMA, ALS, and PLS remains unresolved.
Proton MR spectroscopy of the motor cortex can be used to study involvement of the upper motor neurons. Metabolites measured with MR spectroscopy provide information on the composition of brain tissue in the selected region. NAA is primarily present in (motor) neurons, and a decreased level reflects a dysfunction or loss of neurons.12 Several cross-sectional MR spectroscopy studies of the motor cortex showed abnormally low levels of NAA in patients with advanced ALS.13–17 Increased levels of mIns indicate increased membrane turnover and are considered to represent glial (hyper-) activity.18 A cross-sectional study among patients with ALS demonstrated better sensitivity and specificity of NAAx and mIns combined in an NAA/mIns index for detecting disease than of NAAx or mIns separately.19 Glutamate is also of great interest given its role in the pathogenesis of ALS, but its spectroscopic measurement is hampered by technical shortcomings.20,21
This controlled MR spectroscopy study compared corticomotoneuron degeneration and glial hyperactivity in the primary motor cortex in cohorts of patients with recent-onset MND. With this study, we aimed to further delineate the various phenotypes within the MND spectrum with respect to the profile of upper motor neuron involvement.
Materials and Methods
Subjects
We studied cohorts of patients with ALS-B, ALS-L, PMA, and PLS, and healthy controls. Patients with ALS and PMA were recruited from neuromuscular outpatient clinics in the Netherlands (University Medical Centers of Amsterdam, Utrecht, Rotterdam, and the Catharina Hospital in Eindhoven). Each cohort consisted of 12 individuals. All patients with ALS met the revised El Escorial criteria for probable (laboratory-supported) or definite ALS.22 Patients with PLS were recruited from a cohort of those with PLS studied at the University Medical Center in Utrecht. Alternative diagnoses had been ruled out by extensive investigation.23,24 PMA was diagnosed when clinical and electrophysiologic evidence of progressive pure lower motor neuron involvement was present in ≥2 regions, excluding patients with focal or segmental muscular atrophy and after ruling out other lower motor neuron diseases.9,22 All patients had weakness for <1 year, except for the patients with PLS who, by definition, had a longer disease duration. Healthy age-matched controls were recruited from hospital personnel and partners of patients. Patients and controls were included between June 2004 and March 2007. A follow-up visit was scheduled 6 months after the baseline visit, except for patients with PLS, whose data were meant to obtain reference values for longstanding and prominent upper motor neuron involvement. The protocol was approved by the local ethics committee, and all subjects gave written informed consent.
Clinical Parameters
We measured finger- and foot-tapping speed (taps per 10 seconds that were expressed as taps/s after averaging values for the left and right side). Deceleration of tapping speed suggests an upper motor neuron lesion.25 VC was measured with a handheld spirometer (Micro Medical “Micro”, Gold Standard Version; PT Medical, Leek, the Netherlands), with the patient in a sitting position with a disposable mask positioned over the mouth and nose, and was expressed as a percentage of expected normal value. The ALSFRS-R (range, 0–48) was administered to all subjects.26 Furthermore, we calculated the disease progression as follows: disease progression rate = (48 − ALSFRS-R score) / disease duration.27
MR Imaging and Proton MR Spectroscopy Acquisition
To detect structural abnormalities unrelated to MND that may also affect the primary motor cortex, we acquired 3D T1-weighted, T2-weighted, and fluid-attenuated inversion recovery images, angulated along the anterior/posterior commissure line on a 3T MR imaging scanner (Intera; Philips Medical Systems, Best, the Netherlands) at baseline and at follow-up.
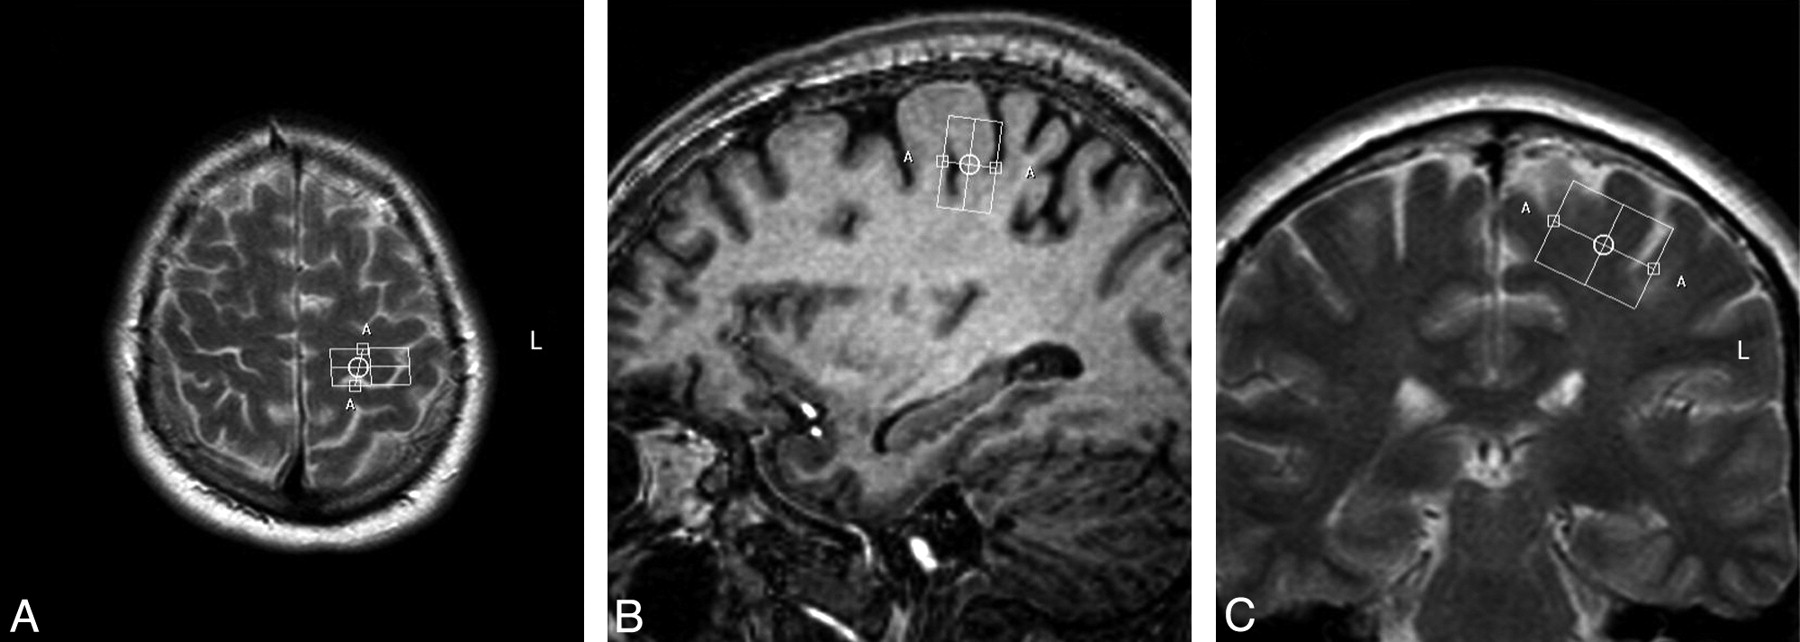
Single-voxel spectroscopy (point-resolved spectroscopic sequence; TE = 35 ms, TR = 2000 ms, voxel size = 13 × 25 × 20 mm, voxel volume = 6.5 mL) was performed in the precentral gyrus, with the 3T Intera scanner.28 In all patients, the same investigator (M.M.v.d.G.) positioned the voxel, first by using the axial sections (Fig 1A), with subsequent adjustments in the sagittal (Fig 1B) and coronal (Fig 1C) planes. We saved the voxel position in all 3 planes and used this file to replace the voxel as precisely as possible after 6 months (Fig 2 A−C). We positioned the voxel of interest contralateral to the site of onset of clinical signs. When signs were symmetric or clinically absent in the limbs (some cases of ALS-B), we studied the motor cortex of the dominant hemisphere, as inferred by handedness. Accurate positioning was time-consuming; therefore, it was not feasible to obtain spectra of both hemispheres, given the condition of the patients.

Voxel position in the precentral gyrus at baseline in the transverse (A), sagittal (B), and coronal (C) planes.

Voxel position in the precentral gyrus in the same patient as in Fig 1, six months later, in the transverse (A), sagittal (B), and coronal (C) planes.
Postprocessing
The LC model (Stephen Provencher, Oakville, Canada) was used to estimate absolute levels of metabolite concentrations.29 In this model, a linear combination of a basis set of metabolite spectra is used to fit the measured spectrum, providing absolute metabolite concentrations (except for a correction factor: Because this factor is unknown, concentrations are given in institutional units). NAAx and Glx were used for analysis, as spectral peaks of N-acetyl aspartic acid and N-acetyl aspartyl glutamic acid, as well as those of Glx, partly overlap.
Statistical Analysis
We compared metabolite levels of the groups with a Mann-Whitney U test for nonparametric data. Statistical significance was set at a 2-tailed P < .05. Spearman rank correlation coefficients (r) were computed to evaluate relationships between NAAx and mIns and clinical variables irrespective of diagnosis. The proportion of the variability of a clinical variable that can be attributed to its relationship with the metabolite is represented by r2. We used the Wilcoxon signed rank test for paired nonparametric data to compare baseline and follow-up data. We calculated ROC curves for clinical measures and for metabolite levels to detect which test or combination of tests had the highest accuracy in predicting disease, by comparing the areas under the curves.
To detect a 20% decrease of NAAx in patients compared with controls with a power of 80% and an α of 5%, 6 patients per cohort were needed.30 On the basis of another study, 11 patients per cohort were needed to detect a 10% decrease of NAAx within a cohort at repeated measurement with the same power and α.17 We decided to include 12 patients per cohort.
Results
Clinical Findings at Baseline and at Follow-Up
Baseline characteristics and significant differences between patient groups and controls are summarized in Table 1. Disease-progression rate at baseline was significantly slower in PLS than in ALS-L (P = .003), ALS-B (P = .013), and PMA (P = .009). VC did not differ significantly between PLS and any of the other patient groups. The ALSFRS-R score was significantly lower in PLS than in ALS-L (P = .010), ALS-B (P = .009), and PMA (P = .001). Finger-tapping speed was significantly lower in PLS than in ALS-B (P = .004) and PMA (P < .001) and significantly lower in ALS-L (3.3 ± 1.3) compared with PMA (4.8 ± 0.7) (P = .006). Foot-tapping speed was significantly lower in PLS than in ALS-L (P = .011) and ALS-B (P = .004). Disease-progression rate, VC, and ALSFRS-R score did not differ significantly between PMA and ALS-L or ALS-B, respectively, nor between ALS-L and ALS-B.
Baseline data of 4 cohorts of MND phenotypes and healthy controlsa
At follow-up, 7 patients with ALS-L, 9 with ALS-B, 10 with PMA, and 12 controls were able to undergo a repeat scanning session. For PLS, no follow-up data were obtained. Follow-up data are listed in Table 2. The ALSFRS-R score decreased in all patient groups compared with healthy controls. VC decreased significantly in ALS-B and in PMA. Finger-tapping speed decreased significantly in ALS-L (P = .046) and ALS-B (P = .038), but not in PMA. Foot-tapping speed did not change significantly in any of the groups. None of the patients with PMA developed clinical upper motor neuron signs during the 6 months of follow-up.
Clinical and MRS data: changes with time (6 months)a
MR Imaging Findings at Baseline
None of the MR images revealed structural abnormalities of the motor cortex unrelated to MND.
MR Spectroscopy Findings at Baseline: Comparison of Patient Groups with Controls
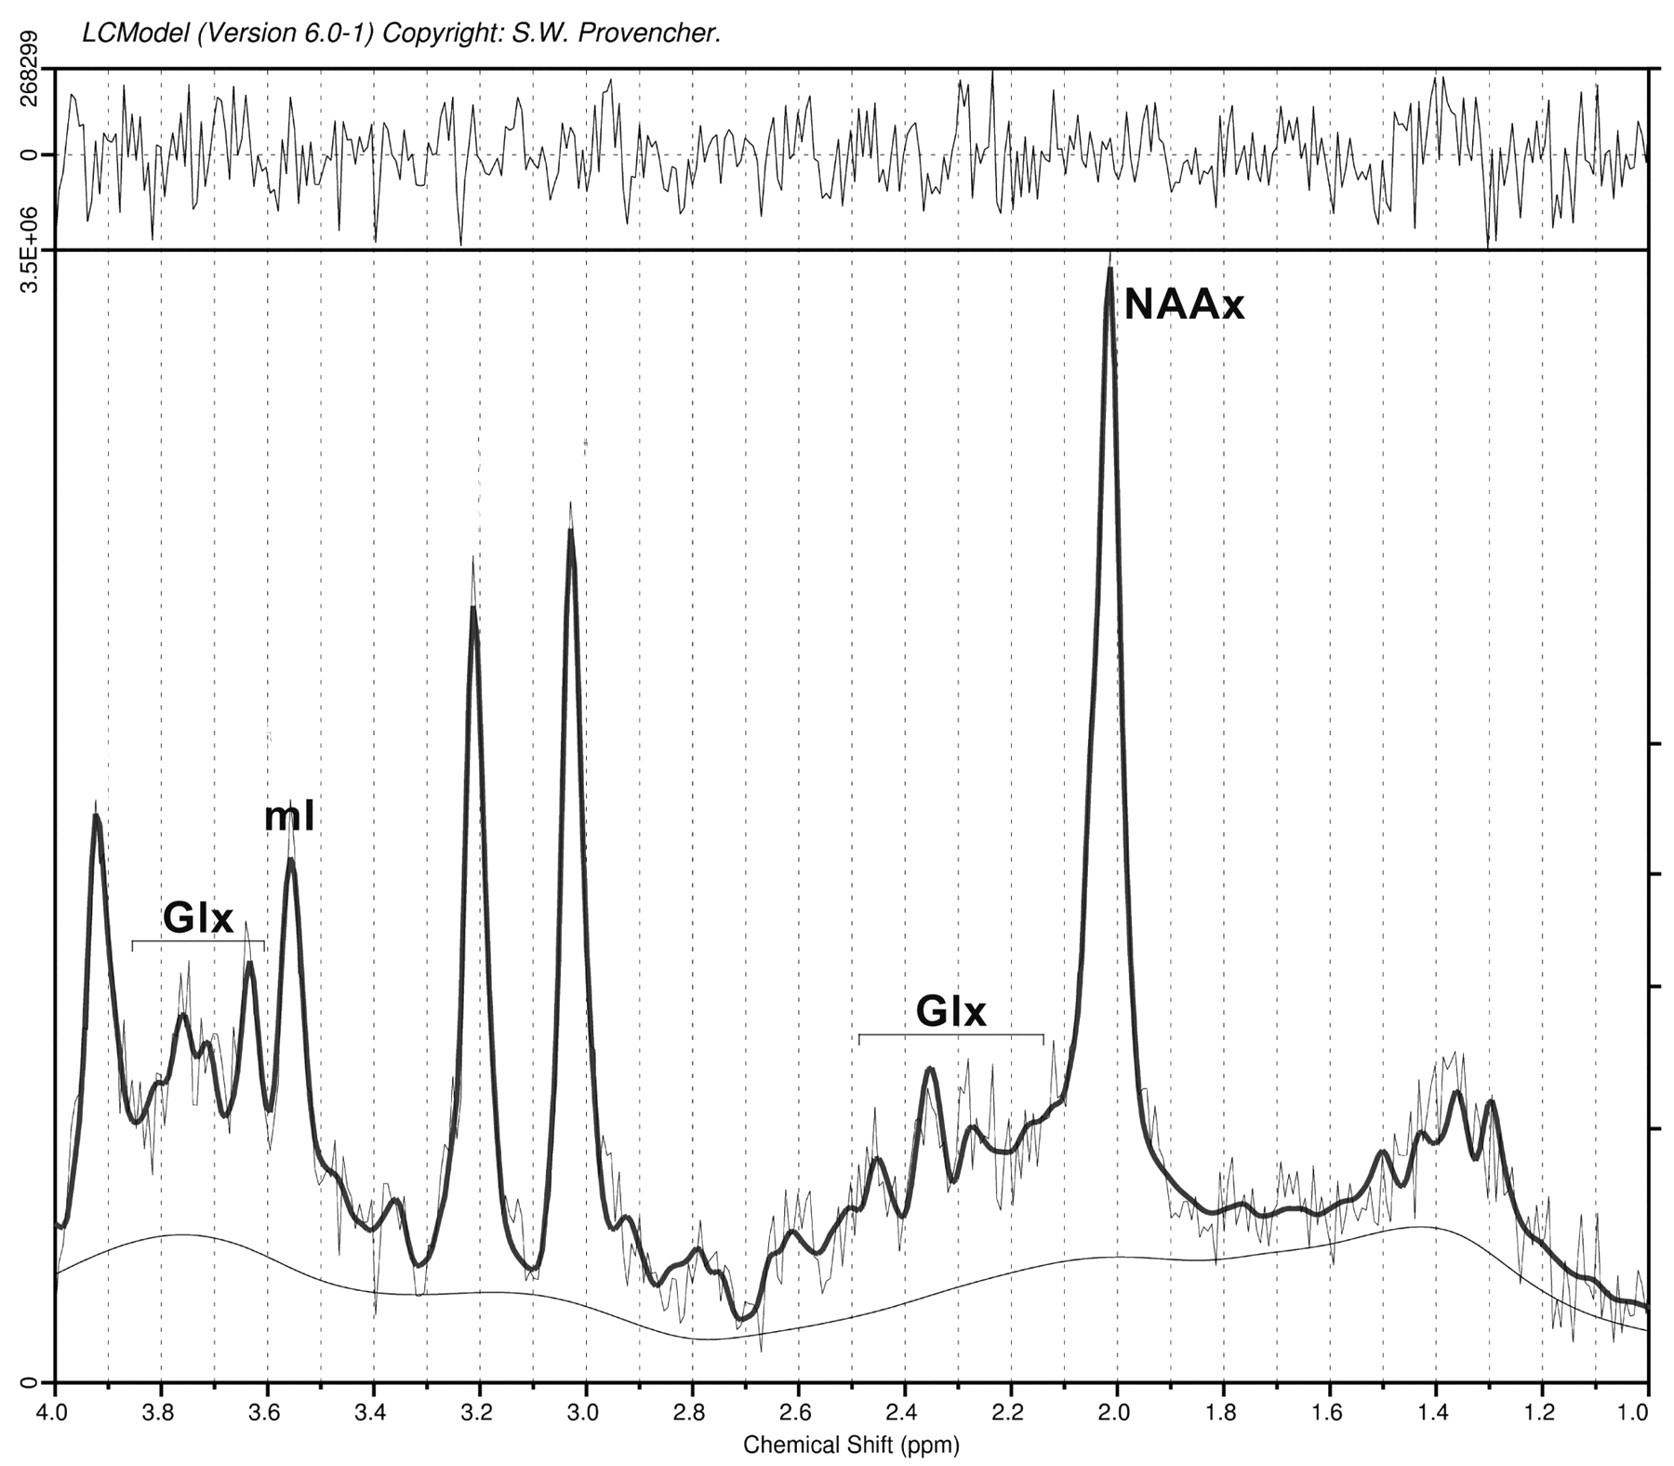
The overall quality of the spectra was good (Fig 3 shows an example). We only included metabolites for which LC model concentrations were associated with an SD of <20%. For the metabolites we selected for analysis, none of the spectra were rejected. Metabolite levels at baseline are shown in Table 1. We found significantly decreased levels of NAAx in PLS (P < .001) but not in ALS-L, ALS-B, or PMA compared with controls. Levels of mIns were significantly increased in the PLS group (P = .024). Glutamate levels varied widely in all groups, with no significant differences between the groups. The index of NAAx/mIns was significantly lower in PLS (P = .001) and in ALS-L (P = .024) compared with controls.

Spectroscopy of the primary motor cortex (example).
MR Spectroscopy Findings at Baseline: Mutual Comparison of Patient Groups
In PLS, the level of NAAx was significantly lower than that in ALS-L, ALS-B, and PMA (Table 3). The level of mIns did not differ significantly between PLS and each of the other patient groups. Mutual comparison of both ALS groups yielded no significant differences. Compared with PMA, the level of NAAx was significantly lower in ALS-L and ALS-B (Table 3). The index of NAAx/mIns was significantly lower in PLS than in ALS-B (P = .015) and in PMA (P = .002). Scatterplots of NAAx and mIns levels per cohort at baseline are shown in Fig 4A, -B.
Mutual comparisons of NAAx levels at baseline (P values)a

Scatterplots of levels of NAAx (A) and mIns (B) per cohort at baseline.
MR Spectroscopy Findings at Follow-Up
In PMA, a significant decrease of NAAx (P = .022) was found (Table 2). All other metabolite levels did not change significantly in any of the groups with time.
Correlation of Clinical Parameters with Metabolite Levels
The Spearman correlation coefficient between NAAx and ALSFRS-R was 0.48 (P < .001, r2 = 23%). The correlation coefficient between NAAx and finger-tapping speed was 0.51 (P < .001, r2 = 26%). The correlation coefficient between NAAx and VC was 0.31 (P = .016, r2 = 10%). Correlation between NAAx and foot-tapping speed was not statistically significant.
The correlation coefficient between mIns and ALSFRS-R was −0.32 (P = .013, r2 = 10%) and between mIns and finger-tapping speed was −0.34 (P = .008, r2 = 12%). The correlation coefficient between mIns and foot-tapping speed was −0.27 (P = .041, r2 = 7%). The correlation coefficient between mIns and VC was not statistically significant.
The change in NAAx levels with time did not correlate significantly with a change in any of the clinical variables. The change in mIns levels with time correlated significantly with a change in finger-tapping speed (r = −0.53, P = .001, r2 = 28%).
Accuracy of Clinical and MR Spectroscopy Parameters to Differentiate Controls from Patients
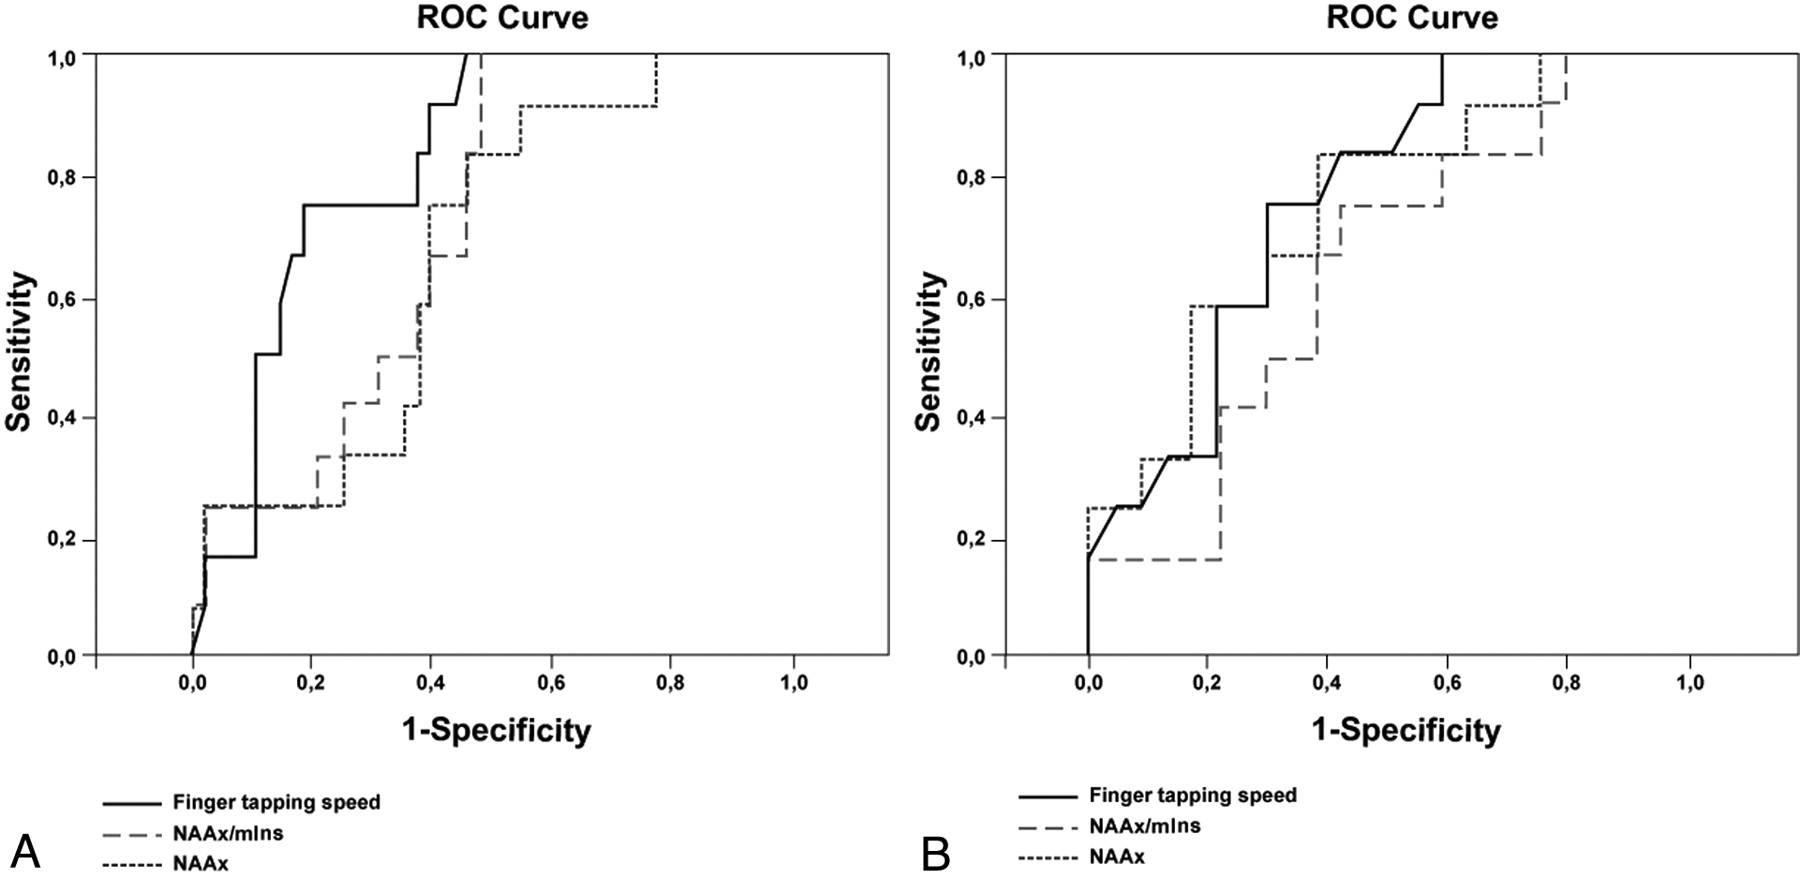
We obtained the largest areas under the ROC curve for finger-tapping speed to differentiate patients from controls (Fig 5A and Table 4). In differentiating patients with ALS from patients with PMA, NAAx level and finger-tapping speed were equally accurate (Fig 5B and Table 4).

ROC curves for NAAx, NAAx/mIns, and finger-tapping speed. A and B, Curves are based on properties of parameters to discriminate patients from controls (A) and ALS from PMA (B).
Areas under the ROC curve for NAAx, NAAx/mIns, and finger-tapping speed at baseline
Discussion
We found changes in metabolite levels in all MND phenotypes. The nature of these changes varied between the phenotypes. In the following paragraphs, we will compare our findings with those in previous studies and will discuss the strengths and limitations of our study.
Strengths and Limitations of the Study
The strength of our study is that we carefully defined phenotypes of MND at an early stage of disease. Therefore, we avoided heterogeneity in groups and acquired data likely to reflect changes in the initial stages of disease, though the actual onset of biologic disease remains unknown. We also performed a systematic follow-up after 6 months. Furthermore, our study provides details on mIns levels as a marker for glial activity in the various phenotypes, whereas previously these data were not reported in PLS and were scarce in PMA. We also compared the accuracy of MR spectroscopy data to predict disease with the accuracy of a clinical sign indicating upper motor neuron involvement (ie, finger-tapping speed).
The small sample size per cohort is a limitation of this study. Unfortunately, we lost almost one-third of our patients to follow-up because of rapid disease progression or death. Our inclusion criteria may have introduced a selection bias toward patients with a rapidly progressive disease course because a shorter delay until diagnosis is associated with a more aggressive disease course.31 Mean delay until diagnosis for patients with ALS-L, ALS-B, and PMA in our study was 6.6 months, while delay in previous epidemiologic surveys was 12–15 months.32,33
PLS
The prominent changes in NAAx imply that MR spectroscopy of the motor cortex is useful to detect upper motor neuron involvement. The significant decrease of NAAx levels in PLS is consistent with previous studies, though these studies used ratios of NAAx/creatine and spectroscopic values were obtained at a much longer TE.15,34 Zhai et al34 demonstrated significantly decreased NAAx/creatine levels in the arm region of the motor cortex compared with controls. A decrease in NAAx/creatine levels also correlated significantly with a decrease in finger-tapping speed in their study. The significantly higher levels of mIns in our patients with PLS compared with controls are consistent with the hypothesis that glial hyperactivity modifies disease progression at later stages.35 To the best of our knowledge, there are no previous studies addressing mIns levels in PLS.
We found no significant difference of mIns levels in PLS in a direct comparison with ALS-L, ALS-B, and PMA. Therefore, the increase in mIns level is not specific enough to discriminate PLS from other phenotypes of MND.
ALS-L and ALS-B
At baseline, NAAx levels in ALS-B and ALS-L were not significantly decreased compared with controls. There were no significant differences in NAAx levels between ALS-L and ALS-B. In a mutual comparison of ALS-L and ALS-B with PMA, NAAx was significantly decreased in both ALS groups; the decrease suggested that, to some extent, corticomotoneuron degeneration can be demonstrated by MR spectroscopy in ALS. This may be influenced by the fact that NAAx levels were slightly, albeit not significantly, higher in PMA than in controls at baseline.
Two studies found lower NAAx levels in patients with ALS-B compared with those with ALS-L.36,37 The first study positioned the voxel of interest in the brain stem area in patients with advanced disease; in the second study, the patients with ALS-B had a trend toward clinically more prominent upper motor neuron involvement than the patients with ALS-L, which may explain their results.36,37 This was not the case in our study because we found no significant difference in finger- and foot-tapping rates when comparing ALS-L with ALS-B.
The absence of significant changes in mIns in ALS-L and ALS-B at baseline supports the theory that glial hyperactivity is mainly responsible for disease progression at later stages and not for disease onset.35
We could only partly confirm the findings of Kalra et al,19 who demonstrated, in patients with ALS, a better sensitivity and specificity of NAAx and mIns combined in an NAA/mIns index than in NAAx or mIns separately for detecting disease. In our study among patients with MND at an earlier stage of disease, we found a significantly lower index of NAAx/mIns in ALS-L compared with controls, whereas NAAx and mIns levels separately were not significantly lower. However, the ROC curves we obtained (discussion below) did not support the finding that the index of NAAx/mIns is more accurate in detecting disease than NAAx and mIns separately. If indeed glial hyperactivity (ie, increased levels of mIns) occurs at a later stage of disease rather than at disease onset, it may be hypothesized that the ability of the NAA/mIns index to detect disease increases with disease duration because disease duration in their study varied from 10 to 72 months.19
PMA
The absence of a significant NAAx decrease and a significant mIns increase at baseline compared with controls is compatible with the concept of PMA being a pure lower motor neuron disorder, at least at this early stage of disease. In addition, we demonstrated significantly decreased levels of NAAx in both ALS groups when compared directly with those measured in PMA. This could not be explained by a more benign course in PMA. Disease-progression rate at baseline did not differ significantly from that in ALS-L and ALS-B (Table 1), and the decrease in the ALSFRS-R score and VC between baseline visit and follow-up after 6 months (Table 2) was similar to what we found in both ALS groups.
With time, we found a significant decrease of NAAx in PMA and in none of the other groups, though the clinical picture remained purely restricted to the lower motor neuron in the 6 months of follow-up. This may suggest that subclinically, a process of corticomotoneuron degeneration does occur, albeit at a slightly later stage of disease.
Delineation of PMA as a separate entity in the MND spectrum remains debated. Several studies have provided clinical and histologic evidence of upper motor neuron involvement in PMA.7,9 Six other MR spectroscopy studies included patients with PMA among other patients with MND. Results varied from a modest decrease14,38,39 in NAAx to normal findings13,16 in patients with PMA. One study included patients with PMA as part of a larger group of “non-upper motor disease patients,” not allowing specific conclusions with respect to PMA.15 Cohorts of patients with PMA were usually small (n = 2–4).13,15,16 Mean disease duration was either unknown,14,15,38 or at least >2 years.15,39,39 Follow-up was performed in 1 study, in a small (n = 4) subset of included patients with PMA.14 Only 1 study included measurement of mIns in patients with PMA with unspecified disease duration, yielding no significant changes compared with controls.14
In conclusion, results of previous studies are difficult to compare with those obtained in our study in which the PMA cohort was homogeneous with respect to disease duration. We performed a systematic follow-up, and these follow-up data suggest onset of corticomotoneuron degeneration also in PMA, albeit at later stage of disease.
Clinical Findings and Their Relation to Metabolite Levels
Levels of NAAx and mIns correlated well with clinical variables. Finger-tapping speed correlated more strongly with NAAx and mIns than did foot-tapping speed. This correlation may well be related to the fact that the voxel was positioned in a part of the primary motor cortex where the motor function of the arm/hand is represented.
A change in levels of NAAx with time did not correlate significantly with a change in any of the clinical variables. However, we found a strong inverse correlation between an increase of mIns levels and a decrease of finger-tapping speed with time, irrespective of diagnosis. This may imply that once corticomotoneuron degeneration has been initiated, glial hyperactivity becomes the more important factor when disease progresses, though we could not confirm this at the group level, probably due to the small sample size per group.35
Finger-tapping speed was more accurate than the level of NAAx in differentiating patients from controls and equally accurate in differentiating patients with ALS from those with PMA, possibly reducing the clinical impact of MR spectroscopy. Measurement of finger- and foot-tapping speed is very simple and can easily be used in daily practice. A recent study showed a strong correlation between finger-tapping speed and gray matter perfusion in patients with ALS.40 Although reliability and validity of finger- and foot-tapping speed have not been formally studied in adults, decreased foot-tapping speed was found to be a more reliable, sensitive, and specific indicator of upper motor neuron dysfunction than the plantar extensor response.41 It can also be used to monitor progression of upper motor neuron dysfunction with time.25
Conclusions
In this longitudinal single-voxel MR spectroscopy study of the primary motor cortex, we focused on patients with well-defined MND phenotypes with a relatively short disease duration and compared these phenotypes with healthy controls and with patients with PLS. In PLS, metabolite changes were most prominent, suggestive of more severe neuronal loss/dysfunction and active glial involvement. We demonstrated corticomotoneuron dysfunction in patients with recent-onset ALS-L and ALS-B compared with PMA at baseline. However, our follow-up data suggest that corticomotoneuron dysfunction occurs also in PMA at a later stage. We found no evidence for early glial hyperactivity in ALS or in PMA at the group level.
Our study demonstrated that MR spectroscopy data are useful in obtaining insight into the disease process at the level of the upper motor neuron in various phenotypes of MND.
Acknowledgments
We thank Suzan Beyer for her assistance with the figures and Dr M.C. de Rijk and Prof P.A. van Doorn for their help in the recruitment of patients.
Footnotes
-
The first author has full access to all of the data in the study and takes responsibility for the integrity of the data and the accuracy of the data analysis.
-
Maaike van der Graaff was funded by the Prinses Beatrix Fonds (The Hague, the Netherlands), which is a charity organization (MAR02–0108)
References
- Received March 2, 2010.
- Accepted after revision May 5, 2010.
- Copyright © American Society of Neuroradiology
In this issue


Jump to section
Related Articles
Cited By...
- Progressive Neurochemical Abnormalities in Cognitive and Motor Subgroups of Amyotrophic Lateral Sclerosis: A Prospective Multicenter Study
- Cerebral degeneration in amyotrophic lateral sclerosis: A prospective multicenter magnetic resonance spectroscopy study
- Neurochemical correlates of functional decline in amyotrophic lateral sclerosis
- Corticospinal Motor Neurons and Related Subcerebral Projection Neurons Undergo Early and Specific Neurodegeneration in hSOD1G93A Transgenic ALS Mice