
Abstract
BACKGROUND AND PURPOSE: VB artery stenosis is associated with a high risk of recurrent ischemic events, and knowledge about the hemodynamic relevance of VB stenosis is important for clinical decision making. In this study, multiple inflow pulsed ASL MR imaging was assessed for its ability to measure CBF and ATT in patients with VB disease.
MATERIALS AND METHODS: ASL was performed on a 3T MR imaging scanner in 41 participants. Twenty-one patients had a history of ischemic events in the VB circulation (14 men, 7 women, age 66 ± 11 years). Clinical data and CE-MRA were used to classify VB disease severity. Twenty age-matched adults were controls. Group and within-VB analyses were performed. Mean CBF and ATT values in the ROIs were adjusted by excluding voxels that did not produce a reliable ASL estimate.
RESULTS: CBF was reduced (P < .003) in patients compared with controls, which was significant after excluding voxels with a poor fit. Differences in ATT between patients and controls were not significant after voxel correction. There was a strong correlation between CBF and ATT among patients. Finally, ATT was significantly correlated with VB disease severity (P = .026).
CONCLUSIONS: Multiple inflow ASL distinguished patients with VB disease from age matched-controls. VB disease rating was associated with prolonged ATT downstream. ASL may have diagnostic potential among patients in whom risk of intervention is high.
ABBREVIATIONS:
- ASL
- arterial spin-labeling
- ATT
- arterial transit time
- CE-MRA
- contrast-enhanced MRA
- GRASE
- gradient and spin echo
- MNI
- Montreal Neurological Institute
- Q2TIPS
- quantitative imaging of perfusion with a single subtraction with thin-section TI1 periodic saturation
- sig
- significant
- VB
- vertebrobasilar
ASL MR imaging has gained clinical interest because of its ability to quantitatively image perfusion without the use of an injected contrast agent.1,2 In ASL, blood water is labeled magnetically in the proximal arteries to produce perfusion-weighted image contrast when the labeled blood reaches the imaging region.3 ASL data are often acquired by using a single inflow period to quantify perfusion, requiring assumed knowledge of the bolus transit time, defined here as the arterial transit time (ATT; in units of seconds). This approach is justified for healthy patients but might be problematic in cerebrovascular diseases where arterial flow is atypical or delayed, as in the case of ischemic scenarios.2,4 Recent work illustrates the value of multiple inflow ASL to extract both CBF and ATT information5⇓–7
The current study focused on symptomatic VB circulation. In contrast to carotid circulation, the impact of stenotic disease on brain perfusion in VB circulation has not been reported in the literature thus far. ASL studies have shown that it is possible to assess perfusion specifically for the posterior circulation in the occipital region.8,9 Patients with VB stenotic disease have a high risk of recurrent ischemic events.10⇓–12 In addition, intervention in VB stenotic disease is associated with a high procedural risk and its benefit is currently the object of clinical trials (eg, Vertebral Artery Ischemia Stent Placement Trial, Vertebral Artery Stent Placement Trial). Information about the hemodynamic relevance of VB stenotic disease may help target candidates suitable for revascularization by identifying patients with poor cerebral perfusion. In the current study, we hypothesize it is possible to use multiple inflow ASL to distinguish patients with VB circulation ischemic events from age-matched controls. From the multiple inflow ASL, we are able to produce images of CBF and ATT. In addition, we estimate the proportion of ASL voxels that produced significant estimates for the hemodynamic parameters. Finally, we hypothesize that ASL data will be correlated with VB disease severity.
Materials and Methods
Patients and Controls
In this cross-sectional observational study, we enrolled patients who attended the TIA clinic of the John Radcliffe Hospital, Oxford, United Kingdom, with a previous diagnosis of TIA or minor stroke in the VB circulation. Standardized clinical data, including previous medical history and vascular risk factors, were recorded. Patients had brain MR imaging (standard stroke protocol, including T2, T2*, FLAIR, DWI) and vascular imaging of the cervical and proximal intracranial vessels with CE-MRA. All patients had their event at least 2 months before undergoing ASL perfusion imaging.
Three neurologists (L.M., U.S., P.M.R.) independently reviewed the clinical and radiologic data and categorized the patients into 3 groups according to the presence and degree of severity of any VB stenotic disease. In cases of disagreement, a consensus was sought. Group 1 included patients with a VB circulation ischemic event but no evidence of VB stenosis (no VB) on CE-MRA. Group 2 patients had moderate VB stenosis (moderate VB) on CE-MRA. Group 2 included patients with unilateral vertebral artery stenosis and/or good collateral flow from the anterior circulation. Finally, group 3 consisted of patients with severe VB disease (severe VB), described by bilateral vertebral artery stenosis or occlusion and/or significant basilar artery stenosis, with little to no evidence of cross-flow from the anterior to posterior circulation via the circle of Willis. The control cohort consisted of 20 age-matched and sex-matched participants with no known history of cerebrovascular disease or stroke. The local ethics committee approved the study.
MR Imaging
ASL MR imaging was performed on a 3T MR imaging system (Tim Trio; Siemens, Erlangen, Germany) using a 12-channel head receive coil. Pulse sequences with imaging parameters included 1) pulsed ASL perfusion imaging (TR/TE = 3216/40 ms in 8 of 21 patients and TR/TE = 3166/23 ms for remaining patients/participants; 200 × 200 × 130 mm field of view; 26 sections; 3.1 × 3.1 × 5 mm3 voxels; 5/8 partial k-space; 10 inversion times; inflow time, 10 control-tag difference pairs for a 10.5-minute scan duration), 2) diffusion-weighted imaging (TR/TE = 4400/93 ms; 27 sections; 1.6 × 1.6 × 3 mm3 voxels; b-value = 0,1000s/mm2), 3) FLAIR (TR/TI/TE = 13,970/2500/94 ms; 27 sections; 1 × 1 × 2.5 mm3 voxels), and 4) T1-weighted anatomic images (TR/TE = 1250/4.6 ms; 44 slabs; 3D turbo fast low-angle shot; 2x parallel imaging; 1 × 1 × 2.5 mm3 voxels). Flow-sensitive alternating inversion recovery-pulsed ASL was used to create section-selective (control) and nonselective (tag) images and to consequently tag a large volume of arterial blood water. The tagging geometry was designed so that the section-selective tagging volume was 10% larger than the field of view along z (FOVz; ie, 121-mm slab thickness versus 110 mm for FOVz). This leads to a 5.5-mm gap between the tag region and the imaging slab. In addition, 2 background suppression inversion pulses were used to null gray and white matter signal. The method of Q2TIPS was used to constrain the maximum duration of the ASL label. Although a Q2TIPS TI1 value of 1.6 s was used for all experiments, in practice, we find that for this duration of inflow time 1, the extent of the radio-frequency transmit coil profile acts as an effective limit to the bolus duration. The remaining uncertainty in inflow time 1 was therefore included in the fitting of the data to the kinetic model.13 ASL imaging was performed using 3D GRASE.13,14 Data were collected over a range of inflow times to produce an ASL time series. The first and last inflow times were 400 ms and 2200 ms, respectively, for the patients, with 200-ms increments, and 400 ms and 2100 ms, respectively, for the controls, with 170-ms increments. ASL parametric estimates were 1) CBF (mL/100 g/min), and 2) ATT (s). A reference ASL image (18 seconds) was acquired without any arterial labeling preparation to calculate the initial magnetization of arterial blood water.
Data Processing
ASL images were processed by using tools supplied by the FSL. Spatial smoothing involved a full width at half maximum smoothing filter of 6 mm. Perfusion-weighted difference images were calculated by using sinc-interpolated subtraction for control and tag images at each inflow time.15 Difference images were averaged at each inflow time. A single-compartment 2-parameter model16 was implemented in Matlab (MathWorks, Natick, Massachusetts) to calculate CBF and ATT voxelwise. Model parameters included bolus duration = 900 ms, which was verified empirically, as in,13 T1,blood = 1500 ms, T1,tissue = 1300 ms. Goodness-of-fit was assessed on a voxel-by-voxel basis using the confidence intervals that were generated from the model fitting for CBF and ATT, as defined by the following criteria: 1) if the CBF estimate minus the 95% lower-bound confidence interval was greater than zero, the fit to the CBF parameter was considered significant (CBF-sig), and 2) if the ATT estimate plus the 95% upper-bound confidence interval was less than the longest inflow value (TImax), the fit to the ATT fit was considered significant (ATT-sig). TImax was 2200 ms for patients and 2100 ms for controls. The percentage of significant voxels within the ROI was determined for the CBF and ATT data, denoted as percent CBF-sig voxels and percent ATT-sig voxels, respectively.
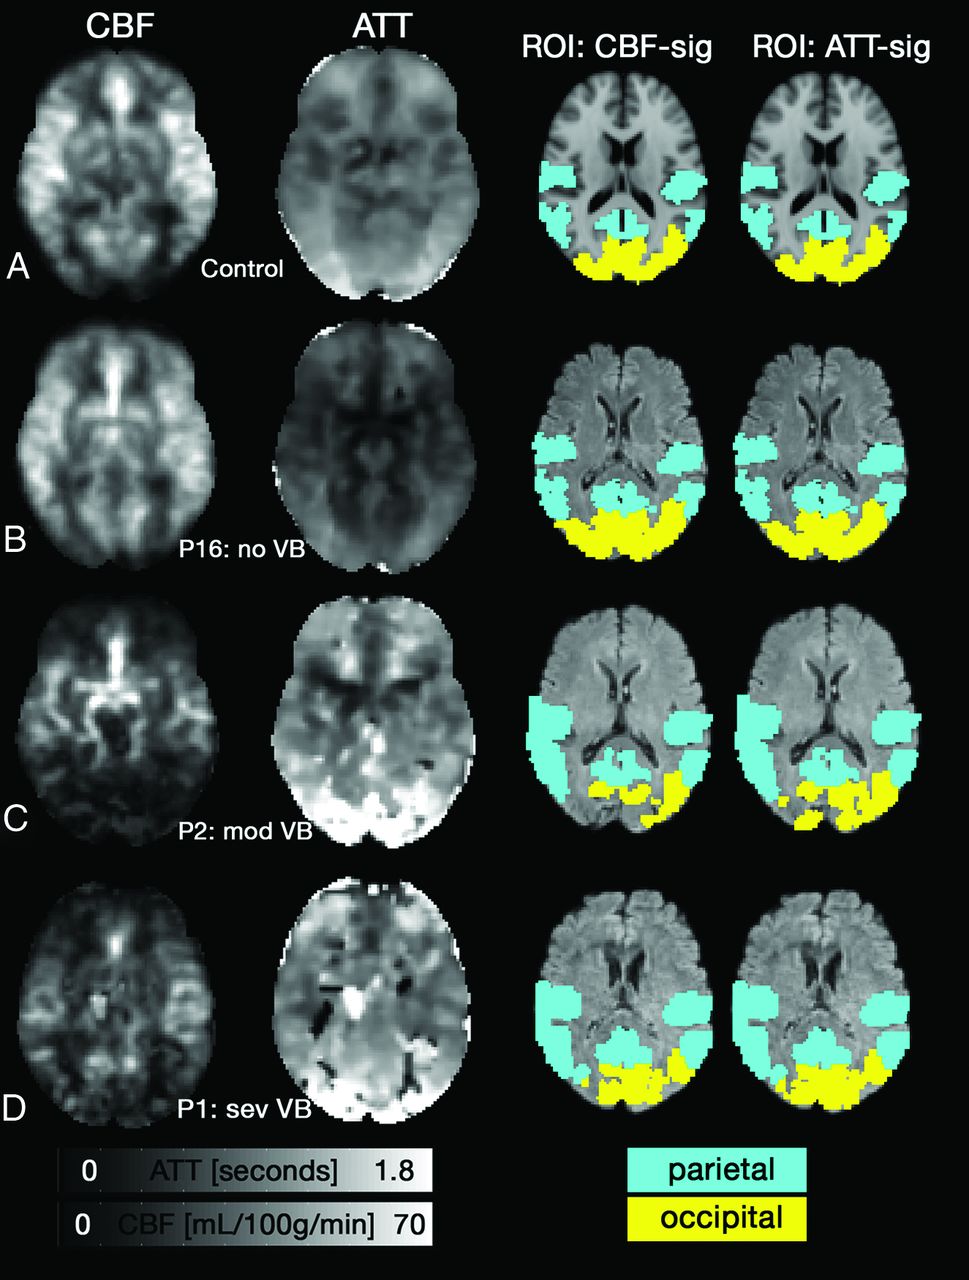
CBF images were converted to absolute units (ie, mL/100 g/min) by conducting the following steps: 1) estimating the initial arterial blood magnetization (M0,blood) from a ROI in the ventricles and using a proton attenuation ratio for tissue and CSF, 2) correcting for the receiver coil sensitivity across the brain, 3) correcting for the T2 difference between CSF and tissue by incorporating the following ratio expression: exp(−TE/T2,blood)/exp(−TE/T2,CSF),17 and 4) assuming a labeling efficiency (ε = 0.81) associated with 2 background suppression pulses in pulsed ASL.18 T1-weighted anatomic images were collected in the same orientation as the ASL data to facilitate registration to MNI standard space. ROIs in occipital and parietal gray matter shown in Fig 1 were selected from the MNI structural atlas that is available in FSLview. The ROIs were warped to the individual patient coordinate space and voxels were included in the ROI if they had a significant fit for CBF or ATT.

Axial CBF (left; mL/100 g/min) and ATT (middle left; seconds) images. A, A representative control shows anterior and posterior regions had a longer ATT compared with middle cerebral territory, while CBF was relatively uniform across the cortex. B, Patient 16 (P16; no VB) had normal CBF and ATT patterns. C, P2 (mod VB) has reduced CBF and prolonged ATT in the posterior portion of the cortex. A patient with severe VB disease (sev VB, P1) also showed reduced CBF and prolonged ATT. Voxels with zero intensity in C-D occurred due to poor fitting. The 2 right columns show the standard space ROIs that were altered to include only voxels that showed a significant fit for CBF or ATT.
Statistics
SPSS was used to perform statistical analyses (SPSS 19, SPSS, Chicago, Illinois). For the group comparisons, an unpaired t test was performed on CBF, ATT, % CBF-sig voxels, % ATT-sig voxels, CBF-sig, and ATT-sig. An empirical relationship between CBF and ATT was sought for controls and patients by regression analysis. Curve fitting was performed in SPSS using both a linear model and an exponential model. Finally, a within-VB patients 1-way analysis of variance was performed on these data by separating patients based of the 3 VB ratings.
Results
We recruited 21 patients (14 men, mean age 66 years, SD 11 years) and 20 healthy controls to the study. There was no significant difference in age or sex between patients and controls (P < .87, P < .79, respectively). DWI scans showed no evidence for acute ischemia at the time of the MR imaging. Table 1 shows the clinical details of the patients, the CE-MRA vascular imaging findings, and the category of severity of VB-disease, as determined by the neurologic review.
Patient demographics, including history of stroke or TIA, infarcts, and arterial disease
Figure 1 shows CBF and ATT images for representative participants. The figure shows a 65-year-old control participant (Fig 1A), followed by patients sorted by their VB disease severity. Fig 1B shows a 73-year-old man with no VB disease (P16). CBF and ATT images in Fig 1A, -B appear normal. Fig 1C shows a 65-year-old male patient with moderate VB disease (P2). Fig 1D shows P1, with a left vertebral occlusion and severe right vertebral stenosis. Fig 1C, -D demonstrate regions with reduced CBF, prolonged ATT, or both.
Comparison between Patients and Controls
The percentage of voxels that showed a significant fit was different between groups for CBF in the parietal region of interest (92 ± 9.5% for controls versus 81 ± 19.3% for patients, P = .021) and occipital region of interest (97 ± 4.3% for controls versus 85 ± 19.9% for patients, P = .024). Similarly, for ATT, the percentage of significant voxel fits was higher in controls in the parietal region of interest (98 ± 4.8% for controls versus 91 ± 12.9% for patients, P = .033) and occipital region of interest (99 ± 1.8% for controls versus 92 ± 13.2% for patients, P = .024). Table 2 shows CBF was reduced in patients compared with controls in the occipital region of interest (P = .10) and parietal ROIs (P = .003). After excluding voxels that showed a poor CBF fit, the occipital region of interest remained significant (P = .003), while the parietal ROI was not (P = .161). Neither region of interest showed a significant ATT difference between groups (P > .09).
CBF and ATT for patients with VB disease and controls separated by group and ROI
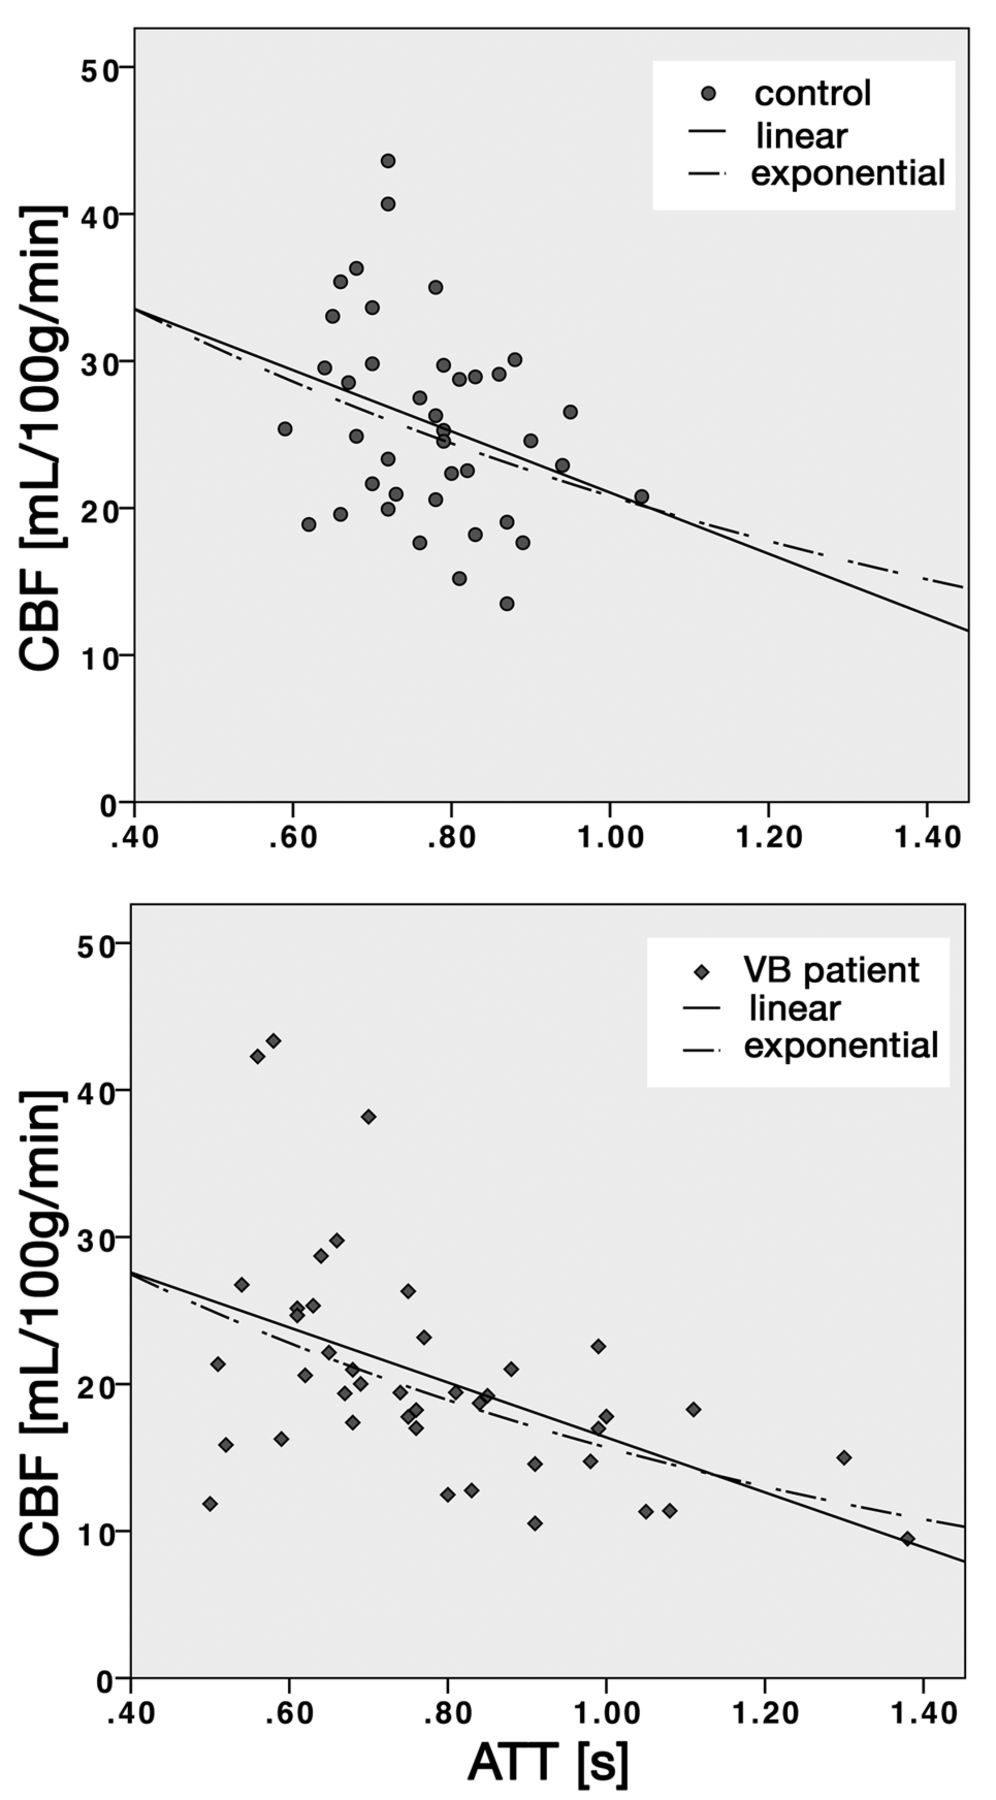
Fig 2 shows CBF versus ATT for controls (Fig 2A) and patients (Fig 2B). The CBF versus ATT curve fitting was not significant for controls (P = .06). For patients, however, both linear and exponential curves were significant (P < .001), with the exponential curves explaining a greater proportion of the variance (r2 = 0.25 and r2 = 0.31, respectively).

Empirical characterization of CBF and ATT for controls (top) and patients with VB disease (bottom). Lower CBF values were associated with longer ATT. The ATT range was greater among patients. Linear and exponential curves are shown. Curve fitting was significant for patients (P < .001) but not controls.
Within-VB Patient Analysis
Table 2 shows the results of the 1-way ANOVA and revealed a significant relationship between occipital ATT and VB disease rating (P = .026), which was significant when considering only ATT-sig voxels (P = .010). To address the small sample size for the severe and moderate VB subgroups, a test of homogeneity of the variance was performed and found not to be significantly different between subgroups (P > .235).
Discussion
This study demonstrates that multiple inflow ASL can be used to characterize hemodynamics among patients with symptomatic VB large artery stenotic disease. These results extend the work of previous clinical ASL studies 2,5⇓–7,19⇓–21 by showing that CBF is reduced in the VB circulation in patients compared with controls. Significance of ASL fitting was assessed voxelwise using the 95% confidence intervals produced from the ASL model fitting. The percentage of the CBF-sig and ATT-sig voxels was lower among patients compared with controls, which suggests that a wider inflow time schedule among patients may have been useful. Further, it was possible to evaluate the impact of including voxels that showed a poor fit, which is a new approach in ASL. Excluding voxels within the region of interest that showed a poor fit did not substantially alter the results. We observed an empirical relationship between CBF and ATT that was significant among VB patients. Finally, occipital ATT was strongly related to VB disease severity rating.
Our focus was on patients with VB large artery stenotic disease, which is an area of research that is underreported in the perfusion literature compared with carotid disease.8,19,22 In addition, to our knowledge, this is the first study that has attempted to assess fitting results from the ASL model in a clinical population. Analyses could be extended to incorporate the number of ASL difference pairs that are required to produce reliable estimates23 or by using a bootstrap approach on the residuals to assess the reliability of the ASL estimates.24
Within-VB analysis showed ATT was significantly correlated with VB disease severity, which suggests ATT may be a good marker of hemodynamic alteration downstream of atherosclerotic stenoses. Future work could compare ATT with more established techniques like digital subtraction angiography. ATT was not significantly different between patients and controls because the patient group showed a large ATT variance. Although ATT is quantitative, it is dependent on the imaging volume and labeling schemes, so it can be difficult to compare between studies. Our ATT values among controls were consistent with our previous work that used pulsed ASL 3D GRASE. Furthermore, the maximum measurable ATT is determined by the longest inflow value. On the basis of the percent ATT-sig voxels, it was possible to estimate ATT voxelwise in greater than 80% of the voxels. A post hoc analysis revealed that the percentage of voxels that met the lower-bound ATT threshold (ie, greater than zero) was correlated with the percentage of voxels from the upper-bound ATT threshold. Ultimately, this illustrates that participants with a poor upper-bound ATT fit also showed a poor lower-bound fit, suggesting our metric for ATT significant voxel fitting was reasonable.
Recent work highlights the value of ATT,21,25 while others have used the arterial transit artifact from single-inflow pseudocontinuous ASL to quantify collateral flow.4 Another ATT acquisition approach is to perform multiple inflow ASL with a lower spatial resolution acquisition that requires fewer averages to estimate ATT.26 We characterized the relationship between CBF and ATT and found a significant trend among patients. The data showed that ATT increased faster than CBF decreased among patients, as suggested by an exponential curve. Future work is warranted to establish how ATT is influenced by intra- and extracranial vascular disease.
The current study is not without limitations. First, analysis was restricted to the cortical regions, despite knowledge that the VB circulation includes the brain stem and cerebellum,27 as the ASL acquisition did not adequately cover lower brain regions. Second, our ASL implementation did not incorporate flow-crushing gradients and we did not model large-artery contributions to the ASL signal.28 Recent work by our group has shown, however, that large vessel signals using pulsed ASL 3D GRASE tend to occur mainly near the middle cerebral arteries.29 Consequently, we do not expect this to be a major issue in the current study. Third, absolute CBF values were comparable with other perfusion studies involving older or patient populations,21,30⇓–32 but were still generally lower than might be expected. We attribute this to through-plane partial volume blurring associated with the current ASL implementation, which accentuates partial volume effects with white-matter voxels. The quantification method was consistent for all participants, thus within- and between-groups results are valid.
Conclusions
We have demonstrated that cortical perfusion and hemodynamics are altered in patients with underlying VB large artery disease. The multiple inflow ASL allowed for estimation of CBF and ATT, as well as the proportion of significant voxels within the ROIs. ASL perfusion imaging is a noninvasive method that can be used to determine the hemodynamic relevance and perfusion patterns in patients with cerebrovascular stenotic disease, which ultimately may be useful when deciding upon treatment options.
Acknowledgments
We thank Dr. Nicola Filippini for contributing to data collection.
Footnotes
-
B.J.M. and L.M. contributed equally to this work.
This work was funded by the UK Medical Research Council, Dunhill Medical Trust (P.J.); the Stroke Association, National Institute for Health Research, NIHR Clinician Scientist Fellowship (U.G.S.); and the NIHR Oxford Partnership Comprehensive Biomedical Research Centre and Heart and Stroke Foundation of Canada (B.J.M.).
Disclosures: Bradley MacIntosh—RELATED: Grant: Heart and Stroke Foundation of Canada, Comments: Postdoctoral fellowship award; UNRELATED: Grants/Grants Pending: NIHR Oxford Partnership Comprehensive Biomedical Research Centre. Ursula Schulz—RELATED: Grant: National Institute for Health Research (NIHR), Comments: Dr. U.G. Schulz is funded by an NIHR-Clinician Scientist Fellowship. Peter Jezzard—RELATED: Grant: MRC,* Dunhill Medical Trust,* Stroke Association,* NIHR,* Stroke Foundation of Canada,* Comments: All gave grant funding; Support for Travel to Meetings for the Study or Other Purposes: MRC,* Dunhill Medical Trust,* Comments: Travel funds for students and postdocs. (* Money paid to institution)
Indicates open access to non-subscribers at www.ajnr.org
References
- Received November 16, 2011.
- Accepted after revision January 30, 2012.
- © 2012 by American Journal of Neuroradiology
In this issue


Jump to section
Related Articles
Cited By...
- Temporal and Spatial Variances in Arterial Spin-Labeling Are Inversely Related to Large-Artery Blood Velocity
- White Matter Hyperintensity Volume and Cerebral Perfusion in Older Individuals with Hypertension Using Arterial Spin-Labeling
- Regional Cerebral Arterial Transit Time Hemodynamics Correlate with Vascular Risk Factors and Cognitive Function in Men with Coronary Artery Disease