Abstract
BACKGROUND AND PURPOSE: MS is a chronic progressive, idiopathic, demyelinating disorder whose diagnosis is contingent on the interpretation of MR imaging. New MR imaging lesions are an early biomarker of disease progression. We aimed to evaluate a machine learning model based on radiomics features in predicting progression on MR imaging of the brain in individuals with MS.
MATERIALS AND METHODS: This retrospective cohort study with external validation on open-access data obtained full ethics approval. Longitudinal MR imaging data for patients with MS were collected and processed for machine learning. Radiomics features were extracted at the future location of a new lesion in the patients’ prior MR imaging (“prelesion”). Additionally, “control” samples were obtained from the normal-appearing white matter for each participant. Machine learning models for binary classification were trained and tested and then evaluated the external data of the model.
RESULTS: The total number of participants was 167. Of the 147 in the training/test set, 102 were women and 45 were men. The average age was 42 (range, 21–74 years). The best-performing radiomics-based model was XGBoost, with accuracy, precision, recall, and F1-score of 0.91, 0.91, 0.91, and 0.91 on the test set, and 0.74, 0.74, 0.74, and 0.70 on the external validation set. The 5 most important radiomics features to the XGBoost model were associated with the overall heterogeneity and low gray-level emphasis of the segmented regions. Probability maps were produced to illustrate potential future clinical applications.
CONCLUSIONS: Our machine learning model based on radiomics features successfully differentiated prelesions from normal-appearing white matter. This outcome suggests that radiomics features from normal-appearing white matter could serve as an imaging biomarker for progression of MS on MR imaging.
ABBREVIATIONS:
- AI
- artificial intelligence
- MSSEG2
- MS SEGmentation Challenge 2
- NAWM
- normal-appearing white matter
MS is a chronic, progressive, idiopathic, demyelinating disorder of the CNS.1 Diagnosis is contingent on timely and precise application of the McDonald criteria, which rely on the interpretation of MR imaging.2 It is unusual among many chronic conditions in that imaging features can often predate clinical manifestations of disease. Imaging remains a prominent tool in the diagnosis, progress-monitoring, and evaluation of treatment efficacy.1,2 New MS lesions are an important imaging biomarker because they can signify both disease progression and the efficacy of disease-modifying drugs.3 Indeed, the absence of new T2-FLAIR lesions in the CNS is used as the solitary metric of disease-modifying drug effectiveness.4 However, the monitoring of lesions can be a tedious or repetitive task for neuroradiologists,5 and that issue, compounded by supply-demand issues in radiology,6 has prompted research into automated lesion identification.7
Computer-assisted segmentation methodologies have been an important topic for scientific exploration for the past 2 decades.8 More recently, a substantial increase in the incorporation of artificial intelligence (AI) into these methodologies has been observed.9 Current research trends are shifting away from the simple identification of MS lesions on T2-FLAIR to comparing images captured at distinct time intervals.7 In response to this escalating interest, the Medical Image Computing and Computer Assisted Interventions society initiated a challenge concentrating on the detection of new lesions (MS SEGmentation Challenge 2 [MSSEG2]), further galvanizing research interest in this domain.3
Predictive models in MS have also been the subject of research; however, their methods and external generalizability vary.10 Many of these models use “systems biology” approaches (Omics data) to predict various disease markers and outcomes.11 Recent imaging research into predictive modeling for MS includes applications in cognitive decline12 and deep learning approaches to disease progression.13 Radiomics is a field of research in which higher-order image features such as texture or intensity distribution are investigated (often using AI and machine learning models to glean deeper information from radiologic images).14,15 The methodology is widely used in medical imaging research, including applications in MS.16⇓⇓-19 By transforming simple images into mineable high-dimensional data, it allows in-depth characterization of MS lesions. Thus, radiomics has this potential to augment diagnostic accuracy and individualize patient management.7
While previously radiology AI research was focused on a narrow range-of-use cases6 aligned to the above advances, there has been a significant increase in interest in the concept of temporality in the field.20 The interpretation of medical images is not a static process, and recent research has shown the importance both of incorporating prior imaging21 into the pipeline and also considering medical images as part of a time-series and in making predictions.22,23
In this study, we aimed to evaluate the potential of radiomics features in predicting progression on MR imaging of the brain in individuals with MS. In our approach, we propose using a machine learning model and radiomics features to differentiate a “prelesion” from a control sample in the normal-appearing white matter (NAWM).
MATERIALS AND METHODS
This retrospective study with external validation was designed according to both the Radiological Society of North America and the European Society of Radiology published principles,24,25 with patient expert involvement.26 We obtained independent statistical advice. The article was prepared using the Checklist for Artificial Intelligence in Medical Imaging27 and conforms to the Assessment of RadiomIcS rEsearch (ARISE) guideline.28 It received full institutional review board approval (St. Vincent’s University Hospital), and the requirement for prospective consent was waived. This research constitutes Level 5A evidence (data quality and AI model development with external testing) because it represents 1 retrospective study with internal and external data used for final performance reporting.29
Participants and Data
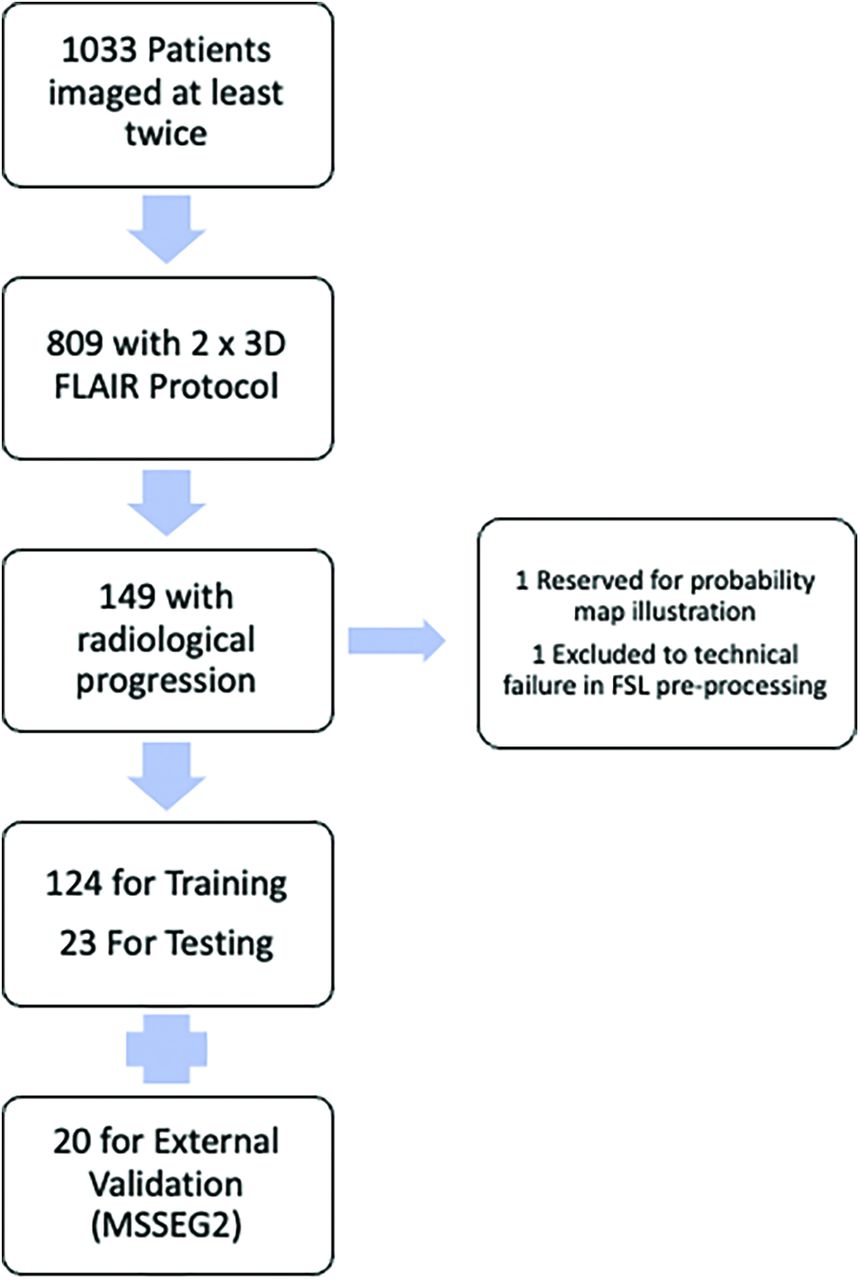
Consecutive patients who had at least 2 MR imaging brain studies for MS at our institution between January 2019 and December 2022 were reviewed (Fig 1). Those with a new lesion on follow-up imaging were included in this study. There is no overlap of the internal cohort with prior studies. The external cohort is publicly available and has been previously described.3

Flow chart of included patients.
Images were acquired on a 1.5T system (Magnetom Avanto syngo MR B19; Siemens). Imaging sequences included a 3D T2-FLAIR sequence using the following parameters: acquired voxel size, 1.1 × 1.1 × 1.1 mm; TR, 6000 ms; TE, 413 ms; TI, 2030 ms; acquisition time, 6 minutes 44 seconds; orientation, sagittal. All scans were defaced using the FSL Brain Extraction Tool 10 (https://fsl.fmrib.ox.ac.uk/fsl/fslwiki/BET/UserGuide) to preserve participant anonymity.30 All images were coregistered to the first time point also using FSL (http://www.fmrib.ox.ac.uk/fsl).
A baseline automated segmentation of MS lesions was generated using DeepMedic (https://github.com/deepmedic/deepmedic).31 These baseline segmentations were then manually corrected by 1 of 2 certified radiologists in their first year post-board examination using ITK-Snap Version 3.8.0 (www.itksnap.org).32 Radiologic progression (new or enlarging lesions) was defined according to the Magnetic Resonance Imaging in MS (MAGNIMS) consensus guidelines (https://www.magnims.eu/).33 Cases with progression were initially identified from the radiologic report and confirmed at a dedicated research re-read. In the case of enlarging lesions, subtractions of coregistered intensity-normalized images were used to confirm that the lesion had unequivocally enlarged. Only the newly segmented area (ie, the area that changed) was included. Cases with progression were first segmented and manually corrected as detailed above and then additionally verified by a third radiologist who is a subspecialist neuroradiologist with >10 years postfellowship experience.
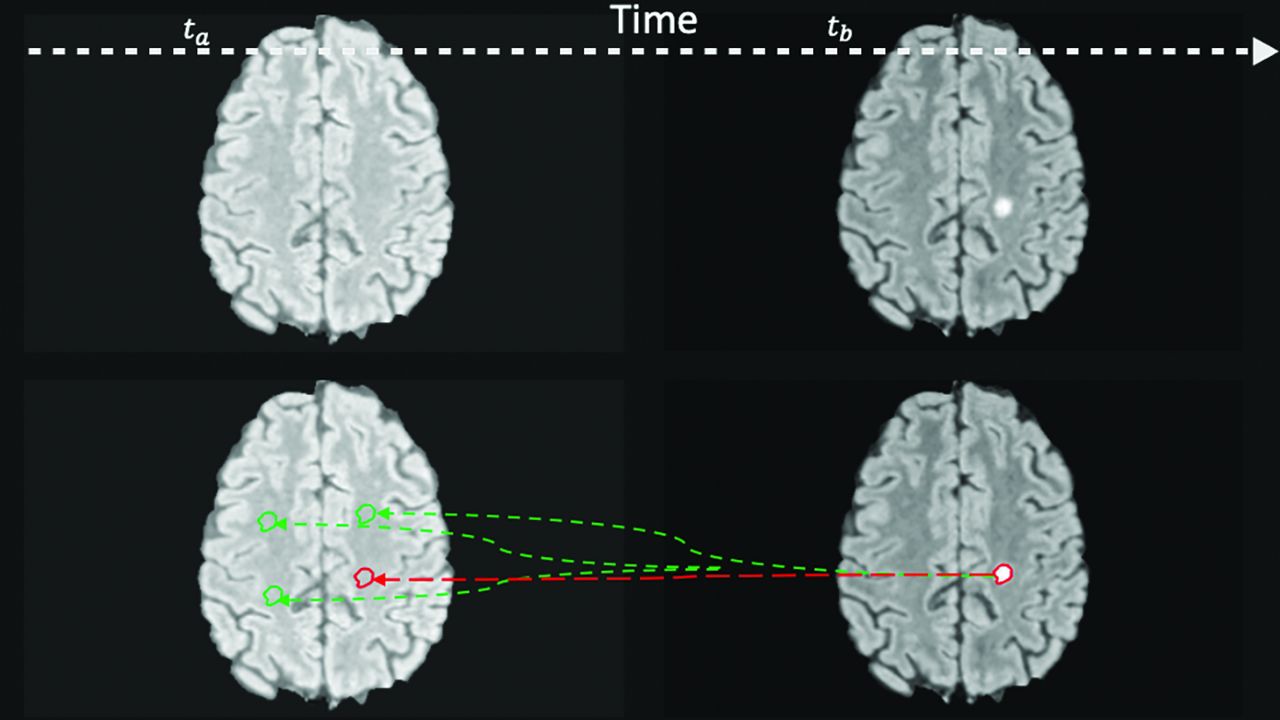
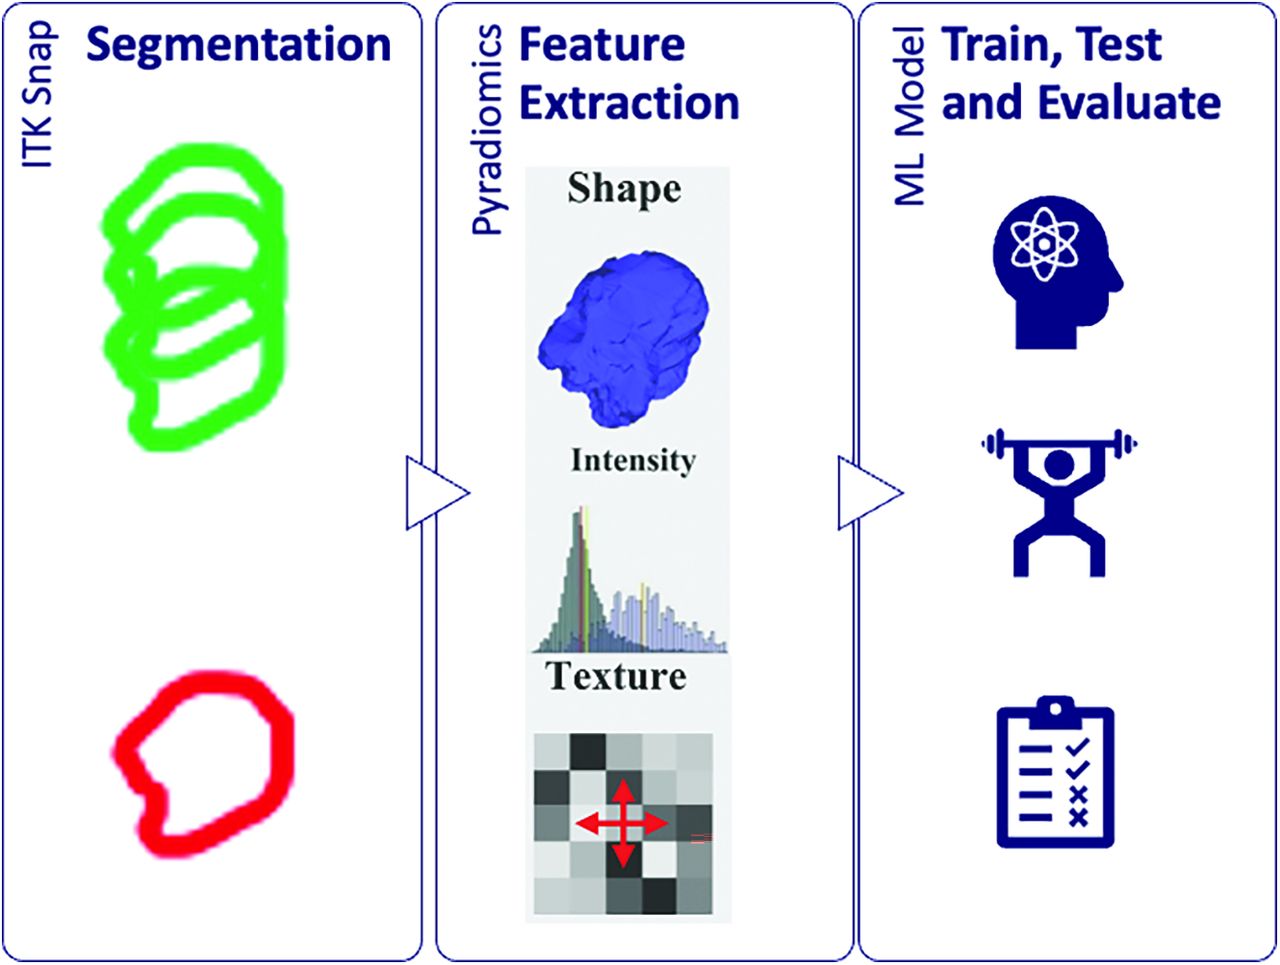
New lesion segmentations were projected backward in time to the same location (dubbed the prelesion) on the prior MR imaging study. This same segmentation was then randomly translated 3 times to other locations within the NAWM to produce 3 control segmentations (Fig 2). The NAWM mask was obtained by subtracting the lesion mask from the white matter mask generated by FSL. By means of PyRadiomics (Version 3.01; https://pypi.org/project/pyradiomics/),34 high-order image features were extracted from the prelesion and control segmentations (Fig 3). The 3 control features were averaged to gain a fairer representation of the NAWM. Because the shapes of the control segmentations were dependent on the original lesion segmentations, shape-related radiomic features were excluded.

Prelesion and control masks. Expert segmentation mask at time b (tb) is projected backward to time a (ta) to the location where a lesion will occur (prelesion, red) and the other random areas in the NAWM (control, green). Note that this 2D representation is for illustrative purposes only, and for the experiments, the random translation was in 3D.

Radiomics workflow in which features are extracted from the segmented regions and passed to the machine learning models.
Model, Training, and Evaluation
A baseline model using just the mean intensity value of the segmented regions was first tested to ensure that there was justification to proceed to use higher-order features;28 control and prelesion regions were compared on both internal and external data.
Several machine learning models were trained and tested (eXtreme Gradient Boosting [XGBoost; https://xgboost.readthedocs.io/en/stable/], Support Vector Classifier, K Nearest Neighbor, and logistic regression). Hyperparameter optimization was performed using a grid search. Because the classes were balanced 50:50 in a binary prediction problem, we chose overall prediction accuracy as our primary evaluation metric.35 Feature importance was extracted from the best-performing model. This was used for feature selection and to give a level of explainability. The optimal number of features is a trade-off between model complexity and performance. The number of features that yields the best performance across the different classification models would be chosen as the optimal number of features. Failure analysis was performed on incorrectly classified cases.27
To demonstrate the potential clinical usefulness of our approach,27,28 we produced a probability map using a previously unseen case. A section with a new lesion was selected, and the image was divided into patches. Radiomics features were extracted from each patch and passed to the best-performing model to predict whether that patch was a prelesion. The absolute and relative probabilities given by the model were calculated and used in a data visualization to illustrate a potential future clinical application. The code necessary to reproduce these experiments is available here (https://github.com/insight-ucd/insightmri/tree/main/MSOmics).
RESULTS
The total number of participants in the training, test, and external validation sets was 167 (124, 23 and 20); 1 additional participant was randomly chosen for production of the probability map only. Failure of FSL registration and brain extraction led to the exclusion of 1 patient (Fig 1). Of the 147 participants in the training/test set, 102 were women and 45 were men. Overall, the average age was 42 years (range, 21–74 years) (Table 1). Two hundred ninety-four volumetric MR imaging FLAIR images were used in the process of training and internal testing, with 40 heterogeneous FLAIR acquisitions for external validation.
Patient demographics
Results of different models for testing and validation are displayed in Tables 2 and 3. The preliminary model based on first-order image metrics (mean pixel intensity) had modest performance on internal data (accuracy, precision, recall, and F1-score of 0.77, 0.76, 0.77, and 0.75). There was a statistically significant difference in the overall mean pixel intensity between the prelesion samples and controls on internal data with a paired t test (P < .05). However, this method did not generalize to external data (accuracy, precision, recall, and F1-score of 0.5, 0.25, 0.5, and 0.33), justifying the use of higher-order features.
| Model | Precision | Recall | F1-Score | Accuracy | Best Parameters |
|---|---|---|---|---|---|
| XGBoost | 0.91 | 0.91 | 0.91 | 0.91 | {'classifier__colsample_bylevel': 0.8, 'classifier__gamma': 0, 'classifier__learning_rate': 0.2, 'classifier__max_depth': 4, 'classifier__min_child_weight': 1, 'classifier__n_estimators': 100, 'classifier__subsample': 0.5} |
| SVC | 0.90 | 0.89 | 0.89 | 0.89 | {'classifier__C': 10, 'classifier__kernel': 'rbf'} |
| Logistic regression | 0.81 | 0.78 | 0.78 | 0.78 | {'classifier__C': 1, 'classifier__penalty': 'l1', 'classifier__solver': 'liblinear'} |
| KNN | 0.83 | 0.78 | 0.78 | 0.78 | {'classifier__n_neighbors': 7} |
| Intensity baseline | 0.76 | 0.77 | 0.75 | 0.77 | NA |
Note:—SVC indicates support vector classifier; KNN, K nearest neighbor; NA, not applicable.
Table 2: Internal test cohort results
External validation cohort results
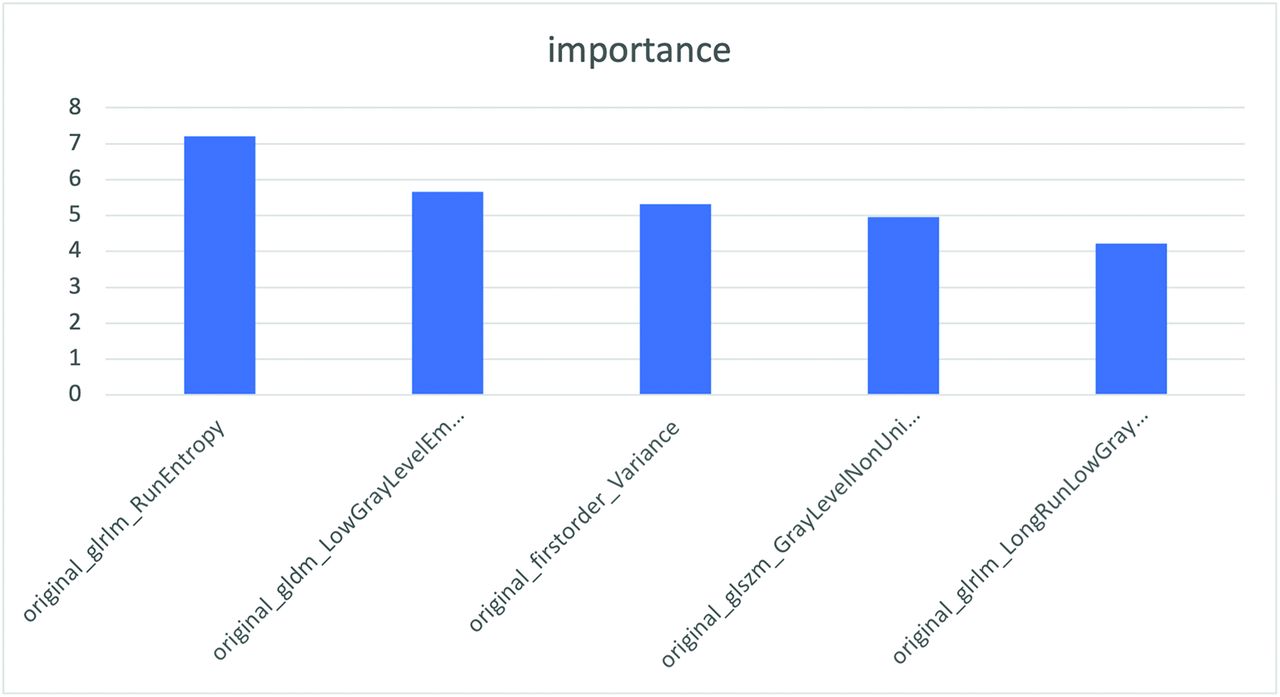
The best-performing radiomics-based model was XGBoost, with accuracy, precision, recall, and F1-score of 0.91, 0.91, 0.91, and 0.91 on the test set, and 0.74, 0.74, 0.74, and 0.70 on the external validation set. The 5 most important radiomics features (Fig 4) to the XGBoost model were associated with the overall heterogeneity (RunEntropy, Variance, and GrayLevelNonUniformityNormalized) and low gray-level emphasis (LowGrayLevelEmphasis and LongRunLowGrayLevelEmphasis) of the segmented regions. Complete feature importance of the best-performing model is given in the Online Supplemental Data. The Online Supplemental Data show the performance for a model trained on only 14 features (including only 1 feature for each 10 participants28), which was inferior to the chosen model.

Top 5 radiomic features identified by the top performing XGBoost model.
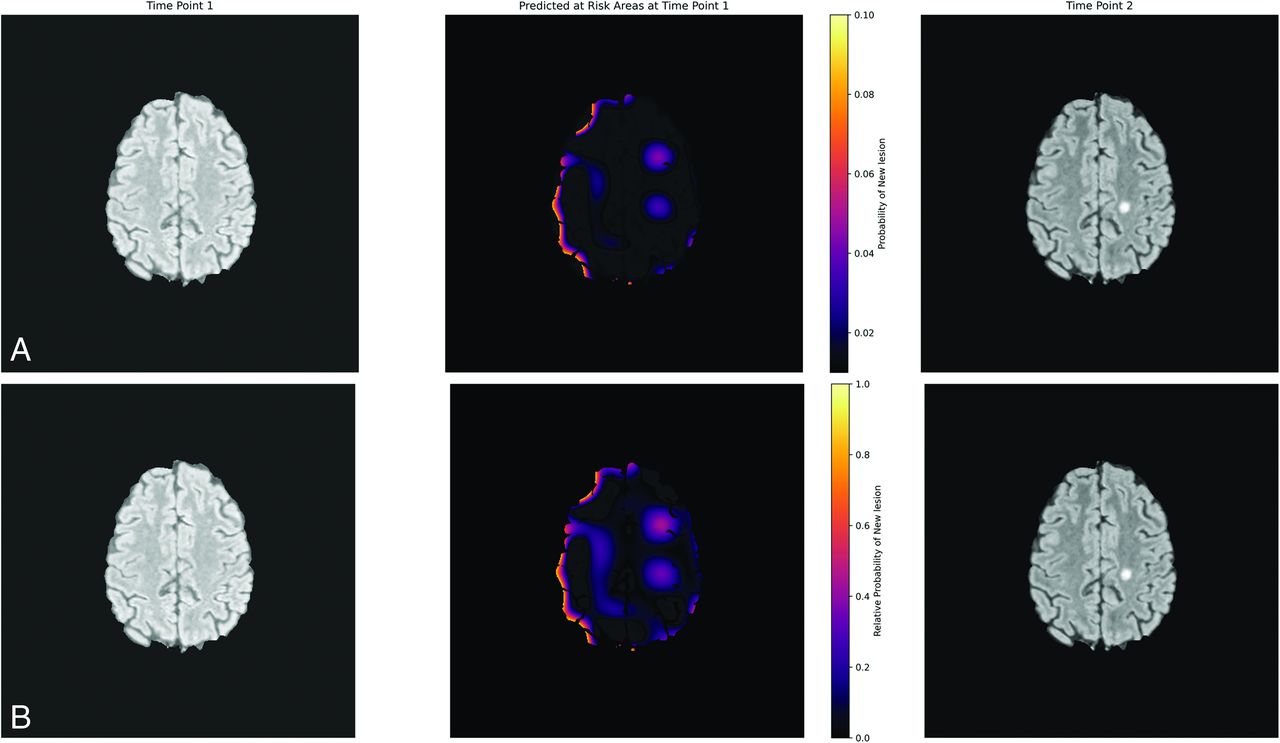
Probability maps were produced for illustrative purposes of potential future clinical application and are shown in Fig 5A, -B. These show the probability of a new lesion in absolute terms (A) and relative to the overall risk (B). The relative probability is defined in Equations 1 and 2.
 1)
1)

Illustrative probability maps showing the absolute (A, Upper row) and relative (B, Lower row) probability of a new lesion occurring in each patch.
P(x, y) represents the general probability of a lesion at location coordinates x, y, where P(N) represents the probability of a new lesion anywhere. NLV represents the average new lesion volume. WMV represents the NAWM volume.
 2)
2)
The relative probability of a new lesion in a specific location ( ,
,  ) is represented by RP (
 ,
,  ), where the predicted probability of a lesion by the model in the specific location
  ,
,  is P’(
 ,
,  ), and P(x, y) represents the baseline probability of a lesion in any location.

Our sample probability map demonstrated 1 true-positive and 1 false-positive using a cutoff of relative increased probability of a new white matter lesion of 4 compared with background (Fig 5).
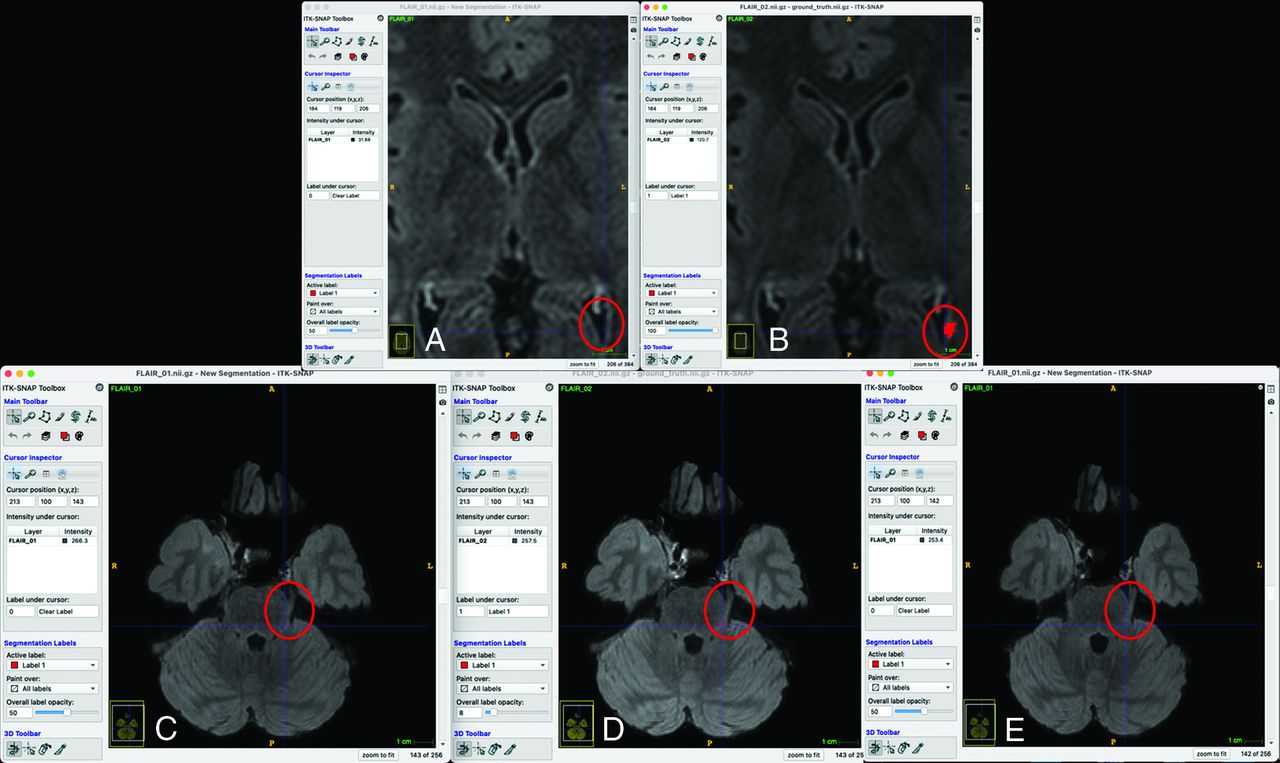
Failure analysis on external validation showed that in many instances, a potential cause for misclassified cases was misregistration of images rather than the machine learning model. For example, of the 3 false-negatives, 2 were likely related to misregistration (Fig 6).

False-negative analysis (A and B, Upper row, C–E, Lower row). Two of the 3 false-negative cases in the external validation set are shown. A and B, The new lesion map falls within the ventricle on the prior image, making a negative prediction more likely because the low gray levels were associated with negative predictions (Fig 4). C, D, and E, The orientation of the proximal left trigeminal nerve is different so that the segmentation is cast onto the normal brainstem instead.
DISCUSSION
In this study, we have demonstrated the potential of radiomics features in predicting progression on MR imaging of the brain in individuals with MS. We used a machine learning model and the extracted features at the location of future progression to predict the occurrence of a new lesion.
AI is revolutionizing the field of MS imaging research, promising to improve diagnostic accuracy, reduce the time taken for image interpretation, and facilitate personalized patient management.7 Radiomics, the extraction of high-order features from radiologic images using data-characterization algorithms, plays an increasingly important role in MS research.16⇓⇓-19 Building on this body of evidence and understanding that the white matter of individuals with MS is quantifiably different from that of healthy controls,9,36 our hypothesis was that radiomics features could potentially reveal subtle alterations before they become visually discernible on MR imaging. As in previous studies,37,38 interpretation of the radiomics features that were most important to our final model showed that more homogeneous and lower gray-level regions were more likely to be classified as “control,” yielding a level of intuition about model behavior and suggesting that the model performed as expected.
Temporality or the consideration of time-based changes is increasingly recognized as a critical component in radiology AI research.21 It allows longitudinal analysis of imaging data, potentially enabling the AI to capture disease progression and treatment responses and even predict future outcomes.22,23,39 Integrating temporality into AI models enhances their capacity to detect subtle, time-dependent changes in patient imaging data, which may remain undetected by conventional image analysis.23 We aimed to build on this research because in conditions such as MS, in which the temporal evolution of lesions is a critical aspect of disease-monitoring and management, they could lead to earlier intervention and better patient outcomes.40,41 The MSSEG2 was a clear recognition of the importance of temporality in research. We demonstrate generalizability through external validation of our results on MSSEG2. While there was a drop in performance at external validation, it was in keeping with what was expected from the literature.42 Furthermore, the MSSEG2 data are known to be very heterogeneous, including several different institutions, 15 scanners, and scanning protocols with a mix of 1.5T and 3T, meaning that MSSEG2 was a robust test of performance.3 Diagnostic accuracy results from MSSEG2 have been modest overall, putting our performance in context. Even the best-performing published models from the challenge demonstrate only modest accuracy for new-lesion detection, indicating both the robust challenge represented by the data set and the potential for improvement in the field.3 Furthermore, false-negative analysis also shows that some of the misclassifications were technical (Fig 6).
A relative probability map was produced on an unseen case to demonstrate a possible future clinical application. There are some artifacts in the cortical gray matter on the right of the image and lower-level increased probability in a band of subcortical white matter on the right. These could be removed with anatomic filtering or further thresholding, but we chose to present the map “as is” rather than overly “tuning it.” One false-positive was seen, even with thresholding, but this was at the site of a lesion that regressed, so there was a change at this location, albeit in the opposite direction. Furthermore, the purpose of the map is to illustrate a potential clinical application for future work rather than it being directly related to the research question of this study. Prospective analysis would be needed before the relative probability map could be implemented clinically.
Limitations
The retrospective study design limits the level of evidence. Furthermore, because our experiments only involved those patients with progression, there was a strong selection bias. While this is a common issue in clinical radiology research,43 it remains a clear limitation. The purpose of the study, to examine the potential for radiomics markers to predict new lesion occurrence, informed our research design; however, this purpose would need to be addressed prospectively before any implementation. Our sample size was modest, but having >120 pairs with change for training compares favorably with MSSEG2,3 which comprised only 100 pairs of patients in total, of whom one-half were stable.
Future Directions and Implications for Practice
Our findings indicate that radiomics features have the potential to serve as an imaging biomarker for predicting radiologic progression of MS. The extracted features could be used to develop a probability map for future lesion occurrence. This map and the relative probabilities of progression have many potential clinical applications. These include making personalized decisions around the timing for follow-up imaging or even interventions. The use of imaging biomarkers in this way is a topic of prospective evaluation in cancer imaging.44 Furthermore, stratification of patients based on imaging biomarkers to identify individuals suited for preventive intervention is highlighted as a key role of medical imaging in personalized medicine by the European Society of Radiology.45 Another possible application would be to highlight ROIs during radiologist interpretation46 or to direct attention47 in a lesion-detection algorithm.
CONCLUSIONS
Our machine learning model based on radiomics features successfully differentiated prelesions from NAWM. This result suggests that radiomics features from NAWM could serve as an imaging biomarker for progression of MS on MR imaging.
Footnotes
This work was performed within the Irish Clinical Academic Training Program, supported by the Wellcome Trust and the Health Research Board (grant No. 203930/B/16/Z); the Health Service Executive National Doctors Training and Planning and the Health and Social Care, Research and Development Division, Northern Ireland; the Faculty of Radiologists, Royal College of Surgeons in Ireland; and the Science Foundation Ireland (SFI) under grant No. SFI/12/RC/2289_P2.
Disclosure forms provided by the authors are available with the full text and PDF of this article at www.ajnr.org.
Indicates open access to non-subscribers at www.ajnr.org
References
- 1.
- 2.
- 3.
- 4.
- 5.
- 6.
- 7.
- 8.
- 9.
- 10.
- 11.
- 12.
- 13.
- 14.
- 15.
- 16.
- 17.
- 18.
- 19.
- 20.
- 21.
- 22.
- 23.
- 24.
- 25.
- 26.
- 27.
- 28.
- 29.
- 30.
- 31.
- 32.
- 33.
- 34.
- 35.
- 36.
- 37.
- 38.
- 39.
- 40.
- 41.
- 42.
- 43.
- 44.
- 45.
- 46.
- 47.
- Received August 2, 2023.
- Accepted after revision November 8, 2023.
- © 2024 by American Journal of Neuroradiology