Abstract
BACKGROUND AND PURPOSE: Myelin maturation occurs in late fetal life to early adulthood, with the most rapid changes observed in the first few years of infancy. To quantify the degree of myelination, a specific MR imaging sequence is required to measure the changes in tissue proton relaxivity (R1). R1 positively correlates with the degree of myelination maturation at a given age. Similar to head circumference charts, these data can be used to develop normal growth charts for specific white matter tracts to detect pathologies involving abnormal myelination.
MATERIALS AND METHODS: This is a cross-sectional study using normal clinical pediatric brain MR images with the MP2RAGE sequence to generate T1 maps. The T1 maps were segmented to 75 brain regions from a brain atlas (white matter and gyri). Statistical modeling for all subjects across regions and the age range was computed, and estimates of population-level percentile ranking were computed to describe the effective myelination rate as a function of age. Test-retest analysis was performed to assess reproducibility. Logistic trendline and regression were performed for selected white matter regions and plotted for growth charts.
RESULTS: After exclusion for abnormal MR imaging or diseases affecting myelination from the electronic medical record, 103 subject MR images were included, ranging from birth to 17 years of age. Test-retest analysis resulted in a high correlation for white matter (r = 0.88) and gyri (r = 0.95). All white matter regions from the atlas had significant P values for logistic regression with R2 values ranging from 0.41 to 0.99.
CONCLUSIONS: These data can serve as a myelination growth chart to permit patient comparisons with normal levels with respect to age and brain regions, thus improving detection of developmental disorders affecting myelin.
ABBREVIATION:
- R1
- tissue proton relaxivity
Rapid growth of the head can be seen in the first 3 years of life with normal data used to generate head circumference growth charts to detect potential pathology from microcephaly or macrocephaly. A major component of this growth is the increase in brain volume accompanied by myelin maturation. The oligodendrocyte is responsible for generating and maintaining the myelin sheath around axons, allowing fast and efficient nerve conduction. In addition to nerve conduction, oligodendrocytes provide crucial support to neurons by providing metabolic support and regulating ion and water homeostasis. These functions are critical for normal brain functioning, because neurologic deficits are seen in demyelinating diseases disrupting myelin.1
Several MR imaging techniques have been used to image and indirectly measure the maturity and integrity of myelin, with relaxometry and DWI used more commonly. DWI measures the changes in water diffusion with myelin maturation and compaction but has limitations with resolution and susceptibility artifacts at the skull base.2 In the first few years of life, clinical MR imaging for myelin maturation demonstrates increasing subjective T1 bright signal and decreasing T2 signal in the first 2 years of life.3 T1 relaxometry or the quantification of T1 has been shown to correlate well with this observation.4 Because T1 relaxometry best correlates clinically with the T1 signal observed in the first year of life, this technique may be the most sensitive to myelin maturation in neonates and infants. Ideally, a clinically feasible T1 relaxometry technique with high resolution may be very useful in assessing quantitative myelination for specific white matter anatomy.
Our aim was to create charts of T1 relaxometry, similar to head circumference growth charts, in specific white matter anatomy using a clinically feasible MR imaging sequence with increasing age in a pediatric cohort with normal findings on MR imaging brain scans. These may serve as useful data for the clinician to increase sensitivity in diagnosing pathologies of myelin maturation.
MATERIALS AND METHODS
Patient Selection
This retrospective study was approved by the Indiana University institutional review board (1905094643) and complies with the Health Insurance Portability and Accountability Act. Inclusion criteria were patients undergoing a brain MR imaging for various indications with normal brain MR imaging findings by report and analyzed retrospectively by a pediatric neuroradiologist (C.Y.H., 17 years of experience) and the use of a spin-lattice T1 quantification series, MP2RAGE. Exclusion criteria were any history in the electronic medical record of pathology known to cause white matter disease. Prematurity was not excluded but was corrected for gestational age.
Imaging Technique
All patients were imaged on a 3T scanner (Magnetom Skyra; Siemens) using the MP2RAGE sequence (TR = 4000 ms, TE = 3.73 ms, matrix = 256 × 256), a variation of the MPRAGE sequence. The MP2RAGE sequence includes an additional gradient-echo readout with different inversion times that allow the generation of a spin-lattice T1 map when combined. This technique cancels out T2* and B1 inhomogeneity effects with superior gray-to-white matter contrast compared with MPRAGE.5 Anatomic scans included axial T2-weighted, axial FLAIR, axial diffusion-weighted, coronal T2, and axial SWIs. T1-weighted reformats were obtained in all 3 planes using MP2RAGE.
Image Data Analysis
All DICOM MP2RAGE images were de-identified using the Clinical Trials Processor developed at Indiana University School of Medicine and imported into Analyze 12.0 (AnalyzeDirect) for subsequent image-processing. MP2RAGE T1 maps were allocated by age to the closest University of North Carolina brain atlas group (infants, 1 year and 2 years). Because the anatomic changes are less pronounced after the first 2 years of life, children older than 2 years of age were registered to the 2-year-old atlas. Images were registered using a normalized entropy optimization algorithm, in which a 9-parameter rigid body transformation6 was applied to either the white matter or gyral mask. Postregistration, a transformed spin-lattice T1 map image was generated and stored for further analysis. Image series were confirmed with a board-certified pediatric neuro-radiologist (C.Y.H., 17 years of experience), and any adjustments noted were performed and reconfirmed before proceeding, to provide quality and consistency. Transformed spin-lattice T1 map images were then segmented into 19 white matter and 56 gyral regions using the ROI tool (Analyze 12.0) for section levels at the forebrain, midbrain, and occipital regions. The mean spin-lattice T1 relaxation (milliseconds) of each of these brain regions across age ranges was extracted and imported into Excel (Microsoft) to permit summary statistics. Relaxivity (R1) was calculated for all available atlas regions as follows:
 where R1, i, j, and T1 are the relaxivity (1/ms), subject, region, and spin-lattice T1 relaxation (millisecond), respectively. Paired anatomic structures were averaged across the left and right cerebral hemispheres. To establish the age-dependent changes in R1, we modeled age ascending data using the following functional form:

where R1, a, j, s, and I are the relaxivity (1/ms), age (months), region, slope, and intercept, respectively. Provided with this information, we determined the estimates of percentile groupings (5%, 10%, 25%, 50%, 75%, 90%, and 95%) as follows:

where, P, j, Zα, k, σp, and n are the percentile grouping, region, α critical value statistic, percentile grouping, population SD, and sample size. The primary image analyst (S.P.) performing the ROI measurements was blinded to patient information and groupings. The image-analysis process is summarized the Online Supplemental Data.
To assess analysis reliability, 2 blinded analysts (S.P., M.S.) conducted interobserver analysis in 25 randomly selected subjects across all age ranges from the 103-patient cohort. In all cases, images were renamed and reanalyzed by both observers as described above.
Statistical Analysis
Secondary analysis, summary statistics, and modeling (Equations 1 – 3) were performed in Excel. Analysis of interobserver comparisons were performed by computing the Pearson product-moment correlations via Excel, aggregating all regions analyzed by each analyst.
Logistic regression (Excel 365) was performed for the white matter anatomy to assess goodness of fit. P values < .05 were considered significant. In addition, an R1 threshold was used to assess the earliest 30-day interval when each white matter anatomy would meet the threshold. Because there is a lack of literature of human perception of T1 brightness at specific R1 values, a value just below that of the corticospinal tract was selected for the first month of life at 6.00E-4, because the corticospinal tract is well-recognized to demonstrate T1 hyperintensity in term neonates. This value was compared with the current clinically accepted subjective T1 hyperintensity recognized in areas with progressive white matter myelin maturation.1
To assess potential significant differences between sex and left-versus right-sided anatomy, we performed multiple t tests of the means for each atlas region between males and females as well as specific atlas regions with paired anatomy. The Holm-Bonferroni method was used to control for the family-wise error rate of multiple comparisons.
Finally, a mean voxel dimensional analysis was performed for subjects grouped by age (0–6 months, 6–12 months, 12–24 months, >24 months) to assess imaging resolution due to growing head size.
RESULTS
A total of 103 subjects (52 females; age range, 2 days to 17 years; median, 2 years) were imaged, registered, and segmented with R1 estimates for all regions included in the atlas. Two subjects had a history of prematurity corrected for gestational age. The MR imaging scans were from May 4, 2016, through November 29, 2017, with the Table showing the indications for MR imaging. The panel in the Online Supplemental Data displays a sample case of gyral and white matter regions registered to anatomic T1 images centered at the corpus callosum. The Online Supplemental Data show representative clinical T1 images at the level of the posterior limb of the internal capsule at 3 different ages. Figures 1 ⇓⇓⇓⇓–6 display the correlation of mean R1 for selected white matter anatomy at the 5th, 10th, 25th, 50th, 75th, 90th, and 95th percentiles with age. Figure 7 shows a cumulative graph for selected white matter regions. The Online Supplemental Data show the results of the logistic regression for white matter anatomy and when each individual white matter anatomy first reached the 6.00E-4 threshold at 30-day intervals.

Scatterplot with trendline and percentile lines of the pons crossing tract. This includes the entire cohort (A) as well as a magnified view for the cohort in the first year of life (B).

Scatterplot with trendline and percentile lines of the middle cerebellar peduncle. This includes the entire cohort (A) as well as a magnified view for the cohort in the first year of life (B).

Scatterplot with trendline and percentile lines of the posterior limb of the internal capsule. This includes the entire cohort (A) as well as a magnified view for the cohort in the first year of life (B).

Scatterplot with trendline and percentile lines of the anterior limb of the internal capsule. This includes the entire cohort (A) as well as a magnified view for the cohort in the first year of life (B).

Scatterplot with trendline and percentile lines of the splenium of the corpus callosum. This includes the entire cohort (A) as well as a magnified view for the cohort in the first year of life (B).

Scatterplot with trendline and percentile lines of the genu of the corpus callosum. This includes the entire cohort (A) as well as a magnified view for the cohort in the first year of life (B).

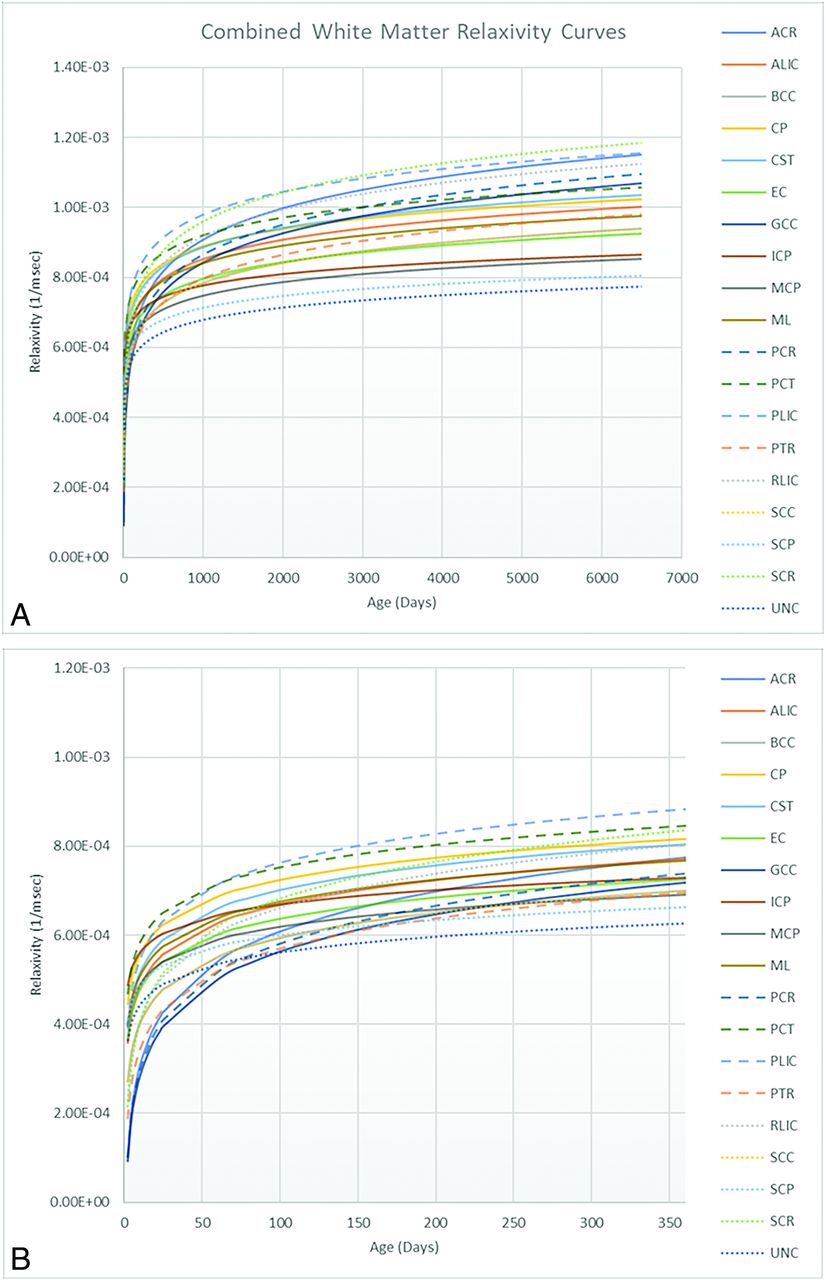
Scatterplot with the trendline of select white matter atlas regions. This includes the entire cohort (A), and the magnified view of the cohort in the first year of life (B). ACR indicates anterior corona radiata; ALIC, anterior limb of internal capsule; BCC, body of corpus callosum; CP, cerebral peduncle; CST, corticospinal tract; EC, external capsule; GCC, genu of corpus callosum; ICP, inferior cerebellar peduncle; MCP, middle cerebellar peduncle; ML, medial lemniscus; PCR, posterior corona radiata; PCT, pontine crossing tract; PLIC, posterior limb of the internal capsule; PTR, posterior thalamic radiation; RLIC, retrolenticular internal capsule; SCC, splenium corpus callosum; SCP, superior cerebellar peduncle; SCR, superior corona radiata; UNC, uncinate fasiculus.
| Indications | |
|---|---|
| Seizures or spasms | 26 |
| Headaches | 22 |
| Developmental delay | 16 |
| Cutaneous or subcutaneous head and neck lesions | 10 |
| Abnormal eye movement | 7 |
| Attention deficit/hyperactivity disorder | 4 |
| Chiari I | 4 |
| Non-CNS malformations | 3 |
| Macrocephaly | 2 |
| Narcolepsy | 2 |
| Autism | 1 |
| Failure to thrive | 1 |
| Hearing loss | 1 |
| Hypertonia | 1 |
| Hypoxic-ischemic encephalopathy | 1 |
| Nonaccidental trauma work-up | 1 |
| Vomiting | 1 |
| Total | 103 |
Indications for MR imaging
Figure 8 displays results of the Pearson product-moment correlation analysis indicating high reproducibility in both white matter (r = 0.887) and gyri (r = 0.945) across 25 randomly selected subjects.

A, Pearson Product Moment Interobserver Comparison for white matter. B, Pearson Product Moment Interobserver Comparison for gyral anatomy.
Of all the atlas regions, only 3 demonstrated significant differences between sexes for the posterior thalamic radiation (females: 8.41 × 10⁻⁴ ± 2.45 × 10⁻⁴; males, 7.11 × 10⁻⁴ ± 1.85 × 10⁻⁴, P = .001), sagittal stratum (females: 8.19 × 10⁻⁴ ± 1.94 × 10⁻⁴; males: 7.33 × 10⁻⁴ ± 1.63 × 10⁻⁴, P = .03), and the mid-temporal pole (females: 6.54 × 10⁻⁴ ± 8.12 × 10⁻⁵; males: 6.14 × 10⁻⁴ ± 8.58 × 10⁻⁵, P = .04). There were no significant differences between the means of the paired left-versus-right anatomy.
The Online Supplemental Data show the mean voxel dimensions for each age group with the smallest age group having the highest imaging resolution.
Full gyral and white matter anatomy from the atlas registered to T1 maps with resulting data and scatterplot has been included in the Online Supplemental Data.
DISCUSSION
MP2RAGE is a clinically feasible scan with accelerated imaging and can be acquired in as little as 6 minutes.7 Using the quantitative T1 mapping function of MP2RAGE and converting to R1 values, we were able to demonstrate the expected and significant increase in R1 values with normal myelin maturation and aging. Summarized white matter and gyral data as well as specific white matter anatomy show high correlation and reproducibility.
When using an R1 threshold, we were able to recreate the well-recognized pattern and timing of increased T1 signal with myelin maturation in the first year of life. Increasing T1 signal generally follows an inferior-to-superior, central-to-peripheral, and posterior-to-anterior pattern.3,7 Furthermore, there is agreement with the histologic study by Yakovlev and Lecours,8 demonstrating earlier myelin maturation of the motor fibers of the cortical spinal tract and the associated anatomy: posterior limb of the internal capsule, cerebral peduncle, and pons, as well as the inferior cerebellar peduncles before the more superior brainstem and corpus callosal components.
In a recently published study, Kühne et al7 also used MP2RAGE to generate R1 values in white and gray matter regions of the brain in infants and young children (3 months to 6 years of age) demonstrating an expected increase in R1 values with myelin maturation. However, our work has important differences in that we included 9 patients younger than 3 months of age, in whom we can assess the earliest changes in myelination, as well as our ROIs were generated through segmentation from an atlas rather than a subjective approach of manually selecting ovoid ROIs in limited anatomy. This advantage allows a larger selection of brain anatomic structures to be assessed in a less subjective fashion. Furthermore, in our chart presentation for selected white matter structures, we followed the conventional head growth charts in graphing cohort percentile lines to compare more easily with peers and increase sensitivity to changes with time.
There are multiple MR imaging parameters that correlate with myelination.9 The lipid and protein macromolecules in the myelin sheath affect T1 and T2 relaxometry10,11 and the magnetization transfer ratio.12 Increasing myelination decreases the diffusion of water as measured by diffusion imaging, with resulting parameters of ADC and with diffusion tractography, fractional anisotropy, mean diffusivity, and radial diffusivity.13,14 Furthermore, myelin also has diamagnetic properties that can be measured by quantitative susceptibility imaging.15 The T1/T2-weighted ratio has also shown correlation with myelin maturation,16 and while less direct than the previously mentioned quantitative parameters, it is more easily obtained from standard clinical MR imaging sequences. However, a recent histologic validation study cautions against using T1/T2-weighted ratios to map myelin in the white matter due to discordance compared with the histologic staining of myelin.17 T1 relaxometry is recognized as having the best subjective visualization for myelin maturation in the first year of life and may be more sensitive in this age range. Compared with diffusion and quantitative susceptibility mapping, MP2RAGE is less susceptible to T2* artifacts and has higher resolution. Previous studies using T1 mapping for myelin quantification do not focus on infants between term and 2 years of age4,18 and, compared with Kühne et al,7 the first 2 months of life.
Indirect measurements of head circumference using cross-sectional imaging have shown high concordance with direct head circumference measurements.19 Similar to the detection of macrocephaly or microcephaly with a direct head circumference growth chart, a quantitiatve myelination growth chart segmented for specific white matter anatomy may be useful to detect disease involving myelination, particularly for nonlesional hereditary disorders of primary myelination such as Pelizaeus-Merzbacher disease. MR imaging findings in this category of disease are typically symmetric and diffuse and may be difficult to visually detect without sufficient experience in pediatric neuroimaging. Further direction for clinical validation would be to test these data against patients with known primary demyelinating disorders for diagnostic accuracy, using the MP2RAGE technique.
Additionally, using the t test with correction for multiple comparisons, we found significant differences only between sexes for the posterior thalamic radiation, sagittal stratum, and middle temporal pole, with girls demonstrating significantly higher mean R1 values than boys. This is a novel finding because there are no other studies comparing R1 values in white matter between sexes, and indicates faster maturity of girls compared with boys. This finding is in agreement with a study by Wang et al,20 who used diffusion tractography to evaluate adolescent white matter and found that boys had greater longitudinal fractional anisotropy changes than girls, indicating that girls had reached maturity earlier than boys.
Limitations include the retrospective and single-center nature of our study with MR images from subjects who may not be completely healthy. Scanning a similar number of healthy asymptomatic subjects in this age range would be challenging from an ethical and resource use perspective. To ameliorate this limitation, we included only MR imaging scans identified as having normal findings by a pediatric neuroradiologist and excluded known white matter pathology from available electronic medical record data. Similarly, longitudinal data with the same subjects would avoid intersubject variability but would also have limited feasibility due to repeat MR imaging scans that may not be clinically necessary in a retrospective study.
Furthermore, MR images with clinically normal findings may include a variable amount of dilated perivascular spaces, which can affect both gray and white matter. The main disease that presents with enlarged and a greater number of dilated perivascular spaces is mucopolysaccharidosis, which we attempted to exclude from available data in the electronic medical record. Without an objective exclusion criterion, we did not attempt to subjectively exclude presumably normal perivascular spaces, and the possible effect on myelin quantification should be noted.
Finally, most of our subjects required the use of anesthesia for MR imaging acquisition, a standard practice in pediatric imaging. Similar to other institutions, MR imaging for neonates at our institution is generally attempted with timing of the patient’s sleep and gentle immobilization techniques. In neonatal rodent models, anesthesia disrupts oligodendrocyte maturation. Limited human imaging studies demonstrate decreases in white matter volume and fractional anisotropy in infants with previous exposure to surgery and anesthesia.21 While there are confounding factors from pre-existing disease, the possibility of white matter alteration from these rodent models may be a limitation in our study. However, the timing of white matter alterations from anesthesia effects may be more delayed than the data obtained during concurrent imaging.
CONCLUSIONS
We generated growth charts of myelin maturation in specific white matter anatomy using R1 values from T1 mapping performed with the MP2RAGE sequence in infants and children from 2 days to 17 years of age. MP2RAGE is clinically feasible and provides high-resolution images. Like head circumference growth charts, these myelination growth charts may serve to track normal myelination and increase sensitivity for myelin pathologies.
Footnotes
Disclosure forms provided by the authors are available with the full text and PDF of this article at www.ajnr.org.
References
- 1.
- 2.
- 3.
- 4.
- 5.
- 6.
- 7.
- 8.
- 9.
- 10.
- 11.
- 12.
- 13.
- 14.
- 15.
- 16.
- 17.
- 18.
- 19.
- 20.
- 21.
- Received November 29, 2023.
- Accepted after revision April 2, 2024.
- © 2024 by American Journal of Neuroradiology