Abstract
BACKGROUND AND PURPOSE: Treatment-induced effects are difficult to differentiate from progressive disease in radiologically progressing diffuse gliomas after treatment. This retrospective, single-center cohort study investigated the diagnostic value of arterial spin-labeling perfusion in differentiating progressive disease from treatment-induced effects in irradiated patients with a high-grade glioma.
MATERIALS AND METHODS: Adults with a high-grade glioma diagnosed between January 1, 2012, and December 31, 2018, with a new or increasing contrast-enhancing lesion after radiotherapy with or without chemotherapy and arterial spin-labeling were consecutively included. Arterial spin-labeling is part of the routine follow-up examinations of patients with a high-grade glioma. The outcomes of progressive disease or treatment-induced effects were defined after histologic or >6 weeks radiologic follow-up. Two neuroradiologists graded the arterial spin-labeling visually as negative (hypointense to gray matter) or positive (iso-/hyperintense). Additionally, the arterial spin-labeling signal intensity in the enhancing lesion was compared quantitatively with that in the contralateral normal brain. Diagnostic test properties and the Cohen κ inter- and intrarater reliability were determined. We present data according to the time after radiation therapy.
RESULTS: We included 141 patients with 173 lesions (median age, 63 years). Ninety-four (54%) lesions showed treatment-induced effects, and 79 (46%), progressive disease. For visual analysis, the ORs of an arterial spin-labeling positive for progressive disease in the group with progression within 3, between 3 and 6, and after 6 months after radiation therapy were 0.65 (95% CI, 0.28–1.51; P = .319), 3.5 (95% CI, 0.69–17.89; P = .132), and 6.8 (95% CI, 1.48–32; P = .014). The areas under the curve were 0.456, 0.652, and 0.719. In quantitative analysis, the areas under the curve were 0.520, 0.588, and 0.587 in these groups. Inter- and intrarater reliability coefficients were 0.67 and 0.62.
CONCLUSIONS: Arterial spin-labeling performed poorly in differentiating progressive disease from treatment-induced effects in high-grade gliomas within 6 months after radiation therapy, with fair performance after this period. Arterial spin-labeling may need to be combined with other imaging features and clinical information for better performance.
ABBREVIATIONS:
- ASL
- arterial spin-labeling
- AUC
- area under the curve
- HGG
- high-grade glioma
- PD
- progressive disease
- PPV
- positive predictive value
- RT
- radiotherapy
- TIE
- treatment-induced effects
- WHO
- World Health Organization
High-grade gliomas (HGG) are the most common type of primary, malignant brain tumors and are subdivided into World Health Organization (WHO) grades 3 and 4.1 Molecularly, this group consists of isocitrate dehydrogenase (IDH)-mutated astrocytomas, 1p/19q-codeleted oligodendrogliomas, and the most lethal, IDH wild-type glioblastomas.
After treatment, almost all patients develop a new or increasing contrast-enhancing lesion during follow-up with MR imaging. Such a lesion originates from either true progressive disease (PD), from treatment-induced effects (TIE), or a mix of both. TIE consist of posttreatment alterations of tumor cells and healthy brain tissue, including pseudoprogression and radionecrosis.
Early TIE within 3 months after completion of radiation therapy with or without chemotherapy are common and notoriously difficult to discern from true PD.2,3 From 3 to 6 months postradiotherapy, early-delayed TIE are still common,4 whereas progression after 6 months may consist of “late radionecrosis,” but it is more likely to be PD.
PD and TIE often have similar appearances on conventional MR imaging. However, the diagnosis of PD or TIE determines the further course of treatment because PD generally implies a decision to discontinue ongoing therapy and/or start the next-line therapy.
Gradually, perfusion MR imaging became part of routine clinical follow-up in patients with a HGG and is used most commonly as a tool to discriminate high-grade from low-grade tumors, or PD from TIE. Arterial spin-labeling (ASL) is a perfusion technique with no need for an IV contrast agent. Magnetized (labeled) water molecules in arterial blood serve as an endogenous tracer and are followed along the capillaries into the tissue. The images are obtained by subtracting the labeled from the nonlabeled control images.5
In previous retrospective and prospective studies that investigated ASL for the differentiation of PD and TIE, areas under the receiver operating curve (AUC) between 0.875 and 0.967, sensitivities of 53.9%–100%, and specificities of 50%–100% have been reported in small series (21–69 patients) with mainly HGG.6⇓⇓⇓⇓⇓⇓⇓-14 Most of these authors manually placed an ROI within the contrast-enhancing lesion on ASL and used a contralateral ROI for normalization to calculate a relative CBF.7,8,10,13,15,16 To reproduce these findings in a larger sample, with specific attention to the diagnostic value at different time points postradiation, we present a retrospective cohort study of patients with a HGG and a new or increasing contrast-enhancing lesion after radiotherapy with or without chemotherapy. Our main hypothesis stated that a positive/high ASL perfusion signal forms a reliable diagnostic marker of PD.
Materials and Methods
Patients had previously given written informed consent for the use of MR images for response evaluation in the context of another study, which was approved by the Medical Ethical/Biobank Committee of the University Medical Center Utrecht (protocol No.16–342/16–229).
For this single-center, retrospective cohort study, all consecutive adults diagnosed with a diffuse glioma by surgery between January 1, 2012, and December 31, 2018, who developed a new or increasing contrast-enhancing lesion on T1 MR imaging with contrast agent (progression MR imaging) after treatment with RT with an available ASL (index test) from the same date or shortly after and a reference test, were eligible for inclusion. Patients who received bevacizumab previous to or during ASL were excluded.
A new or increasing contrast-enhancing lesion was defined as an increase on T1 MR imaging with contrast agent that was described in the radiology reports. Small lesions, defined as smaller than the 7-mm ASL voxel thickness, were excluded.
The reference test consisted of radiologic follow-up of at least 6 weeks or preferably histologic follow-up. Radiologic PD was defined as further progression during a minimum of 6 weeks follow-up after an initial increase and at least 1 follow-up MR imaging described in the radiology reports and confirmed by the multidisciplinary meeting. Radiologic TIE were defined as stable/regressive contrast-enhancing lesions without a change in treatment during a minimum of 6 weeks and at least 1 follow-up MR imaging, according to the modified Response Assessment in Neuro-Oncology (RANO; https://ascopubs.org/doi/abs/10.1200/JCO.23.01059) criteria.17 Histologic PD was defined as any proliferating tumor, and histologic TIE, as pure TIE with no proliferation and ≤1 mitosis per high-power-field. Mixed lesions (with TIE and proliferating tumor) were treated as PD. All lesions up to a maximum of 5 per patient were reviewed individually.
Histopathologic diagnoses were interpreted according to the WHO 2007 or 2016 criteria, depending on the year of the first resection. We updated all the diagnoses to a WHO 2016 interpretation for better comparisons.
A junior researcher (B.I.d.L.), blinded to the ASL results, extracted the clinical data and the reference standard from the electronic patient files. Clinical data included sex, age at the time of ASL, tumor type, and type of surgery and treatment. A subtotal resection was defined as residual enhancement on the postoperative MR imaging.
Time-to-progression was defined as the time from the end of RT to the progression MR imaging and was converted into 3 categories: within 3, between 3 and 6, and after 6 months after RT. All analyses were performed separately for these time-based categories to reflect clinical practice.
Duration of follow-up was defined as the time from the ASL to the reference standard.
Imaging Parameters
Pseudocontinuous ASL perfusion MR imaging was performed on a 3T MR imaging scanner (Ingenia, Ingenia CX, Achieva; Philips Healthcare) with the following sequence parameters: TR/TE, 4000/16 ms; flip angle, 90°; field of view, 240 × 240 × 119 mm (right/left, anterior/posterior, foot/head); section thickness, 7 mm; in-plane voxel, size, 3 × 3 × 7 mm; number of slices in the acquisition, 17;water-fat shift (pixel)/bandwidth (Hz), 8.254/52.6; postlabeling delays, 1525 ms; readout type, 2DEPI; background suppression pulses on; label duration, 1650 ms; and total scan time, around 3 minutes 20 seconds. The parametersfor the 3D T1-weighted imaging included TR/TE, 5.3/2.4 ms; flipangle, 10°; field of view, 230 × 230 × 160 mm (right/left, anterior/posterior, foot/head); andgap, −0.5mm.
Analysis of the Index Test
The qualitative analysis was based on the method of a previous publication:18 Two neuroradiologists (J.W.D. with 11 years of experience, E.A.v.M. with 2 years of experience), blinded to the outcome and clinical data, visually graded the randomly ordered ASL images as the following: 0, hypointensity; 1, isointensity; and 2, hyperintensity, compared with cortical normal-appearing gray matter on the perfusion-weighted maps. Subsequently, the ASL results were dichotomized as positive (grades 1–2) or negative (grade 0). As a sensitivity analysis, we repeated the calculations with grade 2 scans classified as positive, and grade 0, as negative, after omitting the grade 1 scans.
The first observer (J.W.D.) evaluated all ASL images, and we used these results for our main analysis. The second observer (E.A.v.M.) evaluated a subset for an interrater reliability analysis. After 12 weeks to avoid any recall, the first observer re-evaluated a subset for an intrarater reliability analysis. The sample size for the interrater analysis was calculated with the sample size estimator N2.cohen.kappa in R statistical and computing software (http://www.r-project.org/) with the following values: probability of either score = 0.3; 0.3; 0.4, true κ = 0.7 based on previous literature,18⇓-20 null hypothesis = 0.4, two-sided α = .05, and power = 0.8. We approximately doubled the required sample size of 45 to 88 (package irr, R, Version 4.0.3 [October 10, 2020; https://www.npackd.org/p/r/4.0.3]). The 88 patients (108 lesions) were chosen at random.
Another junior researcher (B.J.P.K.), blinded to the clinical data, the outcome, and the qualitative ASL results, performed the quantitative analysis. On the basis of the previous literature, we used a crosshair cursor on the T1 MR imaging with contrast agent and drew an ROI of 29 mm2 in the contrast-enhancing lesion in the region showing the highest perfusion signal on ASL by number (not by CBF). The signal-intensity value of the tumor was then divided by the intensity value of a reference ROI in the contralateral white matter. Forty-four lesions (one-quarter of 173) were reviewed by an experienced neuroradiologist (J.W.D.) for consistency. A clinical researcher (C.M.F.) performed the data entry, cleaning, and analysis. An illustration of PD and TIE in each timeframe (within 3, from 3 to 6, and after 6 months after RT) is shown in Figs 1 and 2.

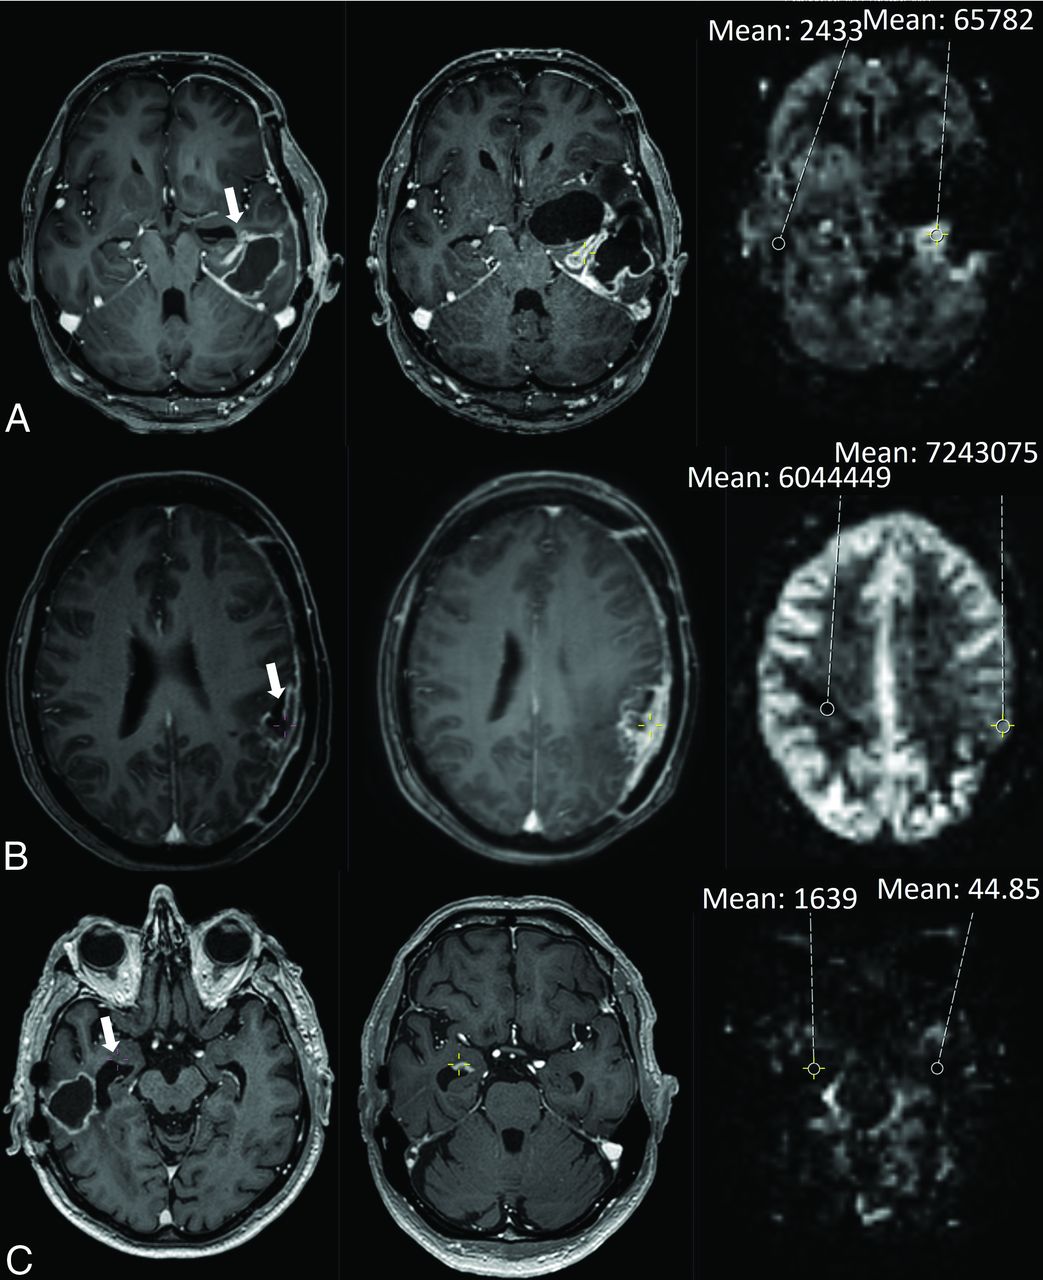
Illustration of an assessment of PD in each timeframe: within 3, 3–6, and after 6 months after RT. The quantitative cutoffs for maximum sensitivity and specificity for PD were respectively 2.2, 1.3, and 1.3. A, A 75-year-old woman with an IDH wild-type glioblastoma was treated with RT. The axial T1 MR imaging with contrast agent on the left shows contrast enhancement (CE) around the surgical cavity (arrow). Two months later (middle), the CE has grown. On the corresponding ASL image on the right, the ASL was visually rated as hyperperfusion, and the mean signal intensity of an ROI in the tumor was compared with the contralateral white matter. B, A 55-year-old man with an IDH wild-type glioblastoma was treated with temozolomide-based chemoradiation. The axial T1 MR imaging with contrast agent on the left shows subependymal CE (arrow). After 3.5 months (middle), the CE has grown. On the corresponding ASL image on the right, the ASL was visually rated as hyperperfusion. C, A 64-year-old man with an IDH wild-type glioblastoma was treated with temozolomide-based chemoradiation. The axial T1 MR image with contrast agent on the left shows CE around the surgical cavity (arrow). After 9.4 months (middle), the CE has grown. On the corresponding ASL image on the right, the ASL was visually rated as hyperperfusion.

Illustration of an assessment of treatment-induced effects in each timeframe: within 3, 3–6, and after 6 months after RT. A, A 42-year-old man with an IDH wild-type glioblastoma was treated with temozolomide-based chemoradiation. The axial T1 MR image with contrast agent on the left shows contrast enhancement (CE) around the surgical cavity (arrow). After 2.5 months (middle), the CE has grown. On the corresponding ASL image on the right, the ASL was visually rated as hyperperfusion, and the mean signal intensity of an ROI in the tumor was compared with that of the contralateral white matter. B, A 46-year-old woman with an IDH wild-type glioblastoma was treated with temozolomide-based chemoradiation. The axial T1 MR image with contrast agent on the left shows CE around the surgical cavity (arrow). After 3.2 months (middle), the CE has grown. On the corresponding ASL image on the right, the ASL was visually rated as hypoperfusion. C, A 79-year-old man with an IDH wild-type glioblastoma was treated with temozolomide-based chemoradiation. The axial T1 MR image with contrast agent on the left shows subependymal CE (arrow). After 16.1 months (middle), the CE has grown. On the corresponding ASL image on the right, the ASL was visually rated as isoperfusion.
Statistical Analysis
For the qualitative image analysis, an OR with a 95% CI and P value was calculated. The diagnostic value was estimated with an AUC, sensitivity, specificity, and positive (PPV) and negative predictive value. The outcome set of the quantitative image analysis consisted of an AUC and the determination of a signal-intensity cutoff value on the ROC curve maximizing sensitivity and specificity. Furthermore, we calculated an OR with a 95% CI and P value after categorization of the signal-intensity values based on the cutoff value.
We performed our main analyses separately for each timeframe: progression before 3, between 3 and 6, and after 6 months after RT. We further performed exploratory analyses in the following subgroups: patients with a glioblastoma treated with temozolomide-based chemoradiation and a histologic reference standard. SPSS, Version 26.0.0.1 (2019; IBM) and MedCalc for Windows, Version 20.019 (2021, MedCalc Software) were used for the calculations.
The funding organizations did not take part in the study design, execution, analysis, or manuscript writing.
Results
In total, 799 patients were reviewed, and 179, with 266 lesions met the inclusion criteria. Finally, 173 lesions from 141 patients were included in the study. Figure 3 depicts the flow chart of patient inclusion. Most patients were men (118, 68.2%) and had a glioblastoma IDH wild-type (151, 87.3%); the median age was 63 years (interquartile range, 55–69 years). Treatment consisted mostly of a subtotal resection (128, 74%) and temozolomide-based chemoradiation (133, 76.9%). Baseline characteristics are shown in the Online Supplemental Data. The median time to progression was 1.1 month after RT (interquartile range, 0.7–4.5 months). After follow-up, 94 lesions (54%) were diagnosed as TIE, and 79 (46%), as PD. The reference standard was based on histology in 46 lesions (26.6%).

Flow chart of patient inclusion.
The median follow-up time was 17.7 weeks (range, 1.14–195.1 weeks). Nineteen patients were followed for <6 weeks, of whom 18 had a histologic reference standard. One patient had his last follow-up MR imaging showing TIE after 5.3 weeks, and he died 3 weeks later from another disease.
Early-versus-Late Progression
For the qualitative image analysis of a positive ASL for PD in the group of patients with progression within 3 months after RT (n = 110), the OR was 0.65 (95% CI, 0.28–1.51; P = .319) with 38.0% PPV and an AUC of 0.456 (95% CI, 0.35–0.57). Between 3 and 6 months after RT (n = 26), the OR was 3.5 (95% CI, 0.69–17.89; P = .132) with a PPV of 58.3% and an AUC of 0.652 (95% CI, 0.43–0.87).
After six months after RT (n = 37), the OR was 6.8 (95% CI, 1.48–32; P = .014) with a PPV of 83.3% and an AUC of 0.719 (95% CI, 0.55–0.89). The results of the sensitivity analysis were consistent.
The Online Supplemental Data present the detailed qualitative and quantitative results.
The quantitative analysis revealed AUCs of 0.520, 0.588, and 0.587 in the groups of progression within 3, from 3 to 6, and after 6 months after RT, respectively. The optimal cutoff values were 2.241, 1.302, and 1.278. These cutoffs were found at 51.1%, 90.9%, and 78.3% sensitivity and 53.9%, 40%. and 50% specificity. The application of the cutoffs in these groups generated ORs of 1.2 (95% CI, 0.57–2.61; P = .609), 6.7 (95% CI, 0.67–66.5; P = .106), and 3.6 (95% CI, 0.85–15.2; P = .082), respectively.
Subgroups
In the subgroup of patients with a glioblastoma treated with temozolomide-based chemoradiation, the OR was near 1, the confidence interval included 1, the P value was large, and the AUC was low.
In the group with a histologic reference standard (n = 46), the final diagnosis was TIE in 14, PD in 7, and mixed histology in 25, classified as PD. The re-resection was total or subtotal in 38 and a biopsy in 8. Patients with positive ASL findings had 3 times the odds of PD compared with patients with negative ASL findings (95% CI, 0.9–12.0; P = .07). The AUC was 0.638 (95% CI, 0.46–0.81), and the PPV, 77%. Assessments of mixed lesions after biopsy and total resection are illustrated in the Online Supplemental Data.
We performed a post hoc analysis of patients with progression before and after 6 months post-RT for each reference standard (radiologic/histologic). In the late timeframe, the diagnostic accuracy was higher with a histologic reference (n = 22) compared with a radiologic reference (n = 15) but was comparable with the results of the whole-group analysis (AUC = 0.760, Online Supplemental Data).
The findings of quantitative analysis of the subgroups were consistent.
Reliability
Intrarater and interrater reliability analysis revealed κ values of 0.62 and 0.67, respectively, which represent a substantial agreement.21 No notable changes in the median signal-intensity ratio or interquartile range were found during the review of 44 lesions by a neuroradiologist (1.8, 1.2–10 versus 2.0, 1.3–10).
The median time between the progression MR imaging and the ASL imaging session was 2 days (interquartile range, 0–50 days). The results did not change significantly after omitting all lesions with >3 weeks between the progression MR imaging and the ASL (n = 73).
DISCUSSION
In this retrospective cohort study of 173 lesions, our main objective was to assess the diagnostic value of ASL perfusion MR imaging in differentiating PD from TIE in irradiated HGG. The ASL images were rated qualitatively and quantitatively and showed a limited diagnostic value with both methods. The PPVs of the qualitative (visual) image analysis were low for progression within 6 months and high for progression after 6 months after RT. The diagnostic performance was similar in our quantitative image analysis, with high sensitivities and low specificities for progression after 3 months after RT.
In comparison with previous literature, the diagnostic accuracy of ASL was lower in our study. Two earlier retrospective studies, one with 62 patients with a glioblastoma and another with 30 patients with grade 2–4 gliomas, used a 3-point scale for a qualitative analysis and found a significant OR of 4.73, and AUC of 0.774, sensitivity of 79.4% and 88%, and specificity of 64.3% and 89%.9,12 However, 1 study included only patients with progression within 4 weeks post-RT,9 and the other was limited to patients after proton beam RT with progression after 6 months or later post-RT and only 1 ASL-slice.12
Three prospective and 7 retrospective studies (or with an unknown study design), including 21–69 patients with low-grade gliomas and HGG after standard-of-care RT or chemoradiation, performed quantitative analysis. An ROI in the tumor was compared with contralateral brain to calculate either a CBF.7,8,10,11,13⇓⇓-16 or tumor blood flow.6 In 1 study, intensity values were analysed.12 The reference region was mostly described as normal brain.7,8,11,12 Others specifically used the contralateral white matter16 or the cerebellum.14 AUCs in these studies were ≥0.848.6⇓-8,10,11,14 Cutoff values of 1.02–2.18 generated 53.9%–100% sensitivity and 50%–92.9% specificity.7,8,10,12⇓-14 In a recently published meta-analysis including most of these studies, the relative CBF in tumor recurrence differed significantly from the one in treatment effect.22
We included new or increasing contrast-enhancing lesions from all time points after RT, possibly negatively influencing our findings. In our study, 110 of 173 lesions (64%) progressed within 3 months after the end of RT, and 59% of these were diagnosed as TIE. The specificity of a positive ASL finding in this group with the qualitative method was only 24.6%. A high incidence of inflammatory, apoptotic pseudoprogression in the first months after RT may have led to many false-positives in comparison with more uniform radionecrosis with vascular changes in the later period, especially beyond 6 months post-RT. The better diagnostic performance in our explorative subgroup analysis with late progression supports this hypothesis, suggesting that a positive ASL beyond 6 months after RT is associated with PD, but a negative signal in this timeframe is still difficult to interpret. These findings on “beyond 6 months postradiation” need to be replicated in an independent cohort. The specificity in the previously mentioned smaller study with 62 progressive lesions before 3 months after RT including 45% TIE was 64.3%.9 Two other studies included only patients with late MR imaging changes.6,12
Another explanation for our moderate diagnostic value may be a high number of mixed lesions (with PD as well as TIE). We considered the progressive component within a mixed lesion as most important because this component determines the patient’s prognosis. Consequently, we regarded mixed lesions as PD. Thus, we ignored the TIE component of the mixed lesion, even though this component is likely to be represented in parts of the lesion on the ASL images. The outcome was retrieved by a different person than the one who retrieved the ASL (test); therefore, this inherent misclassification of the outcome was probably nondifferential. Nondifferential misclassification of the criterion standard can lead to an underestimation of the observed diagnostic value. In previous research, a higher percentage of tumor correlated with a higher CBF,15 but others reported no change of ASL sensitivity or specificity after omitting mixed lesions.12
The interrater reliability coefficient was similar or inferior compared with previous studies (0.65, 0.813, 0.67; Fleiss κ).18⇓-20 The imperfect inter- and intrarater reliability coefficient could also have negatively influenced the diagnostic performance. The consistent results of the interrater and intrarater reliability largely exclude a difference in rating between the 2 observers. A possible source of this nonrobustness in the ASL reading is the sensitivity to artifacts due to patient movement, hemorrhage, and flow effects.5 Furthermore, the low spatial resolution and the lack of standard protocols for the quantitative evaluation constitute limitations of the ASL method in general.
The large, representative sample gathered during 6 years constituted the main strength of our study and contributes to the generalizability of our findings. The exclusion of recurrent low-grade gliomas and patients treated with bevacizumab further homogenized our sample. We applied qualitative (visual) as well as quantitative analyses of the ASL images, and both results were consistent. Last, the second, independent, read of the ASL images blinded to the clinical data provided important information on the test characteristics of ASL imaging.
Limitations of our study were the retrospective and single-center design. Also, we did not register the patients’ dexamethasone doses. Dexamethasone is used as a treatment of the symptoms of TIE and can influence the MR imaging appearance of the lesion. However, our design reflects clinical practice, in which dexamethasone use is common in patients with symptomatic edema. Additionally, 73% of patients lacked a histologic reference standard. Nevertheless, the risk of sampling error, the interrater variability between pathologists, the molecular evolution of the tumor after treatment, and the impossibility of performing high-risk brain surgery in every patient hamper the applicability of histology as the criterion standard.23⇓-25 Last, we considered only a single-time point ASL in this study, which does not correlate with clinical practice. Generally, radiologists have access to other sequences, previous MR images (sometimes including previous ASL images), and clinical information as well. All previously reported studies compared the ASL with another technique, mostly DSC perfusion MR imaging.7⇓⇓-10,12⇓–14,16 In 3 studies, the raters had access to conventional MR imaging.8,9,15 In 1 study, the researchers reported a comparison with previous MR imaging examinations.15
Future prospective studies should include a larger sample size to account for the inevitable, nondifferential misclassification of the criterion standard, to study the value of longitudinal ASL imaging instead of the current single-time point index test, and to combine ASL with other modalities, both from conventional imaging4 and advanced methods. The group with IDH-mutated HGG (n = 6) also deserves more in-depth studying. Our analyses suggest that ASL is less suitable for diagnosis in early progression within 3–6 months after radiation therapy. For the early progressive lesions, other imaging modalities should be considered. The diagnostic value of different imaging methods may be increased with the application of machine learning/radiomics in image analysis.26
CONCLUSIONS
We found a poor diagnostic value of ASL in differentiating progressive disease and TIE in irradiated high-grade gliomas with radiologic progression within 6 months after radiation therapy. In radiologic progression after 6 months, the diagnostic value was better. Our study gives valuable feedback for the application of ASL in clinical practice. Clinicians should be aware of the possibility of a high percentage of false-positives (52% of all positives in our qualitative assessment), especially in the early phase after RT.
Footnotes
This work was supported by a donation from the Stophersenkanker.nu Foundation to T.J.S and F.Y.F.D.V. and the Foundation Vrienden UMC Utrecht.
Disclosure forms provided by the authors are available with the full text and PDF of this article at www.ajnr.org.
References
- 1.
- 2.
- 3.
- 4.
- 5.
- 6.
- 7.
- 8.
- 9.
- 10.
- 11.
- 12.
- 13.
- 14.
- 15.
- 16.
- 17.
- 18.
- 19.
- 20.
- 21.
- 22.
- 23.
- 24.
- 25.
- 26.
- Received December 6, 2023.
- Accepted after revision February 5, 2024.
- © 2024 by American Journal of Neuroradiology