Abstract
BACKGROUND AND PURPOSE: Alternative use of molecular approaches is promising for improving nerve regeneration in surgical repair of neurotmesis. The purpose of this study was to determine the role of MR imaging in assessment of the enhanced nerve regeneration with toll-like receptor 4 signaling activation in surgical repair of neurotmesis.
MATERIALS AND METHODS: Forty-eight healthy rats in which the sciatic nerve was surgically transected followed by immediate surgical coaptation received intraperitoneal injection of toll-like receptor 4 agonist lipopolysaccharide (n = 24, study group) or phosphate buffered saline (n = 24, control group) until postoperative day 7. Sequential T2 measurements and gadofluorine M-enhanced MR imaging and sciatic functional index were obtained over an 8-week follow-up period, with histologic assessments performed at regular intervals. T2 relaxation times and gadofluorine enhancement of the distal nerve stumps were measured and compared between nerves treated with lipopolysaccharide and those treated with phosphate buffered saline.
RESULTS: Nerves treated with lipopolysaccharide injection achieved better functional recovery and showed more prominent gadofluorine enhancement and prolonged T2 values during the degenerative phase compared with nerves treated with phosphate buffered saline. T2 values in nerves treated with lipopolysaccharide showed a more rapid return to baseline level than did gadofluorine enhancement. Histology exhibited more macrophage recruitment, faster myelin debris clearance, and more pronounced nerve regeneration in nerves treated with toll-like receptor 4 activation.
CONCLUSIONS: The enhanced nerve repair with toll-like receptor 4 activation in surgical repair of neurotmesis can be monitored by using gadofluorine M-enhanced MR imaging and T2 relaxation time measurements. T2 relaxation time seems more sensitive than gadofluorine M-enhanced MR imaging for detecting such improved nerve regeneration.
ABBREVIATIONS:
- LFB
- Luxol fast blue
- LPS
- lipopolysaccharide
- PBS
- phosphate buffered saline
- SFI
- sciatic functional index
- SI
- signal intensity
- TLR
- toll-like receptor
Neurotmesis is the most common type of traumatic peripheral nerve injury and could result in complete paralysis of an affected limb or development of intractable neuropathic pain.1 Peripheral nerve repair, either by direct suturing of the nerve ends or by nerve grafting, remains the standard treatment of choice. However, despite advancements of microsurgical techniques and different repair methods, full functional outcome, especially of motor function, is rarely achievable.2 Alternative use of Schwann cell or stem cell–based tissue-engineered conduits has been shown to exert a beneficial effect on peripheral nerve repair. However, the number of regenerating neurons following injury and repair is still suboptimal.3 Other strategies, particularly the use of molecular approaches, are promising for improving nerve regeneration in surgical repair of neurotmesis.4
The success of nerve regeneration depends largely on the severity of the initial injury and resultant degenerative changes.5 A variety of cellular and molecular mechanisms are found to regulate Wallerian degeneration and axonal regeneration in the injured peripheral nerve.6 Recent studies demonstrated that toll-like receptor (TLR) signaling is critical for Wallerian degeneration and functional recovery in peripheral nerve injury7 and spinal cord injury.8 The use of TLR4 agonist lipopolysaccharide (LPS) was able to accelerate myelin phagocytosis during Wallerian degeneration in the crushed sciatic nerve and injured spinal cord, thereby promoting recovery of nerve functions.7,8
MR neurography, including quantitative T2 measurements, has been widely used to evaluate traumatic injuries of peripheral nerves,9,10 to monitor native process of nerve recovery,11 and to reveal enhanced nerve regeneration by stem cell transplantation in peripheral nerve injuries.12 Taking advantage of a strong affinity for degenerating nerve tissues, gadofluorine M-enhanced MR imaging has been successfully applied to monitor nerve regeneration in transected nerve repaired with tissue-engineered nerve conduits.13 However, little is known about the use of MR neurography to evaluate nerve repair with surgical coaptation in presence of simultaneous TLR4 pathway activation.
The purpose of this study was to observe the longitudinal changes of nerve repair on MR imaging and then to determine whether the enhanced nerve regeneration with use of TLR4 activation in surgical repair of neurotmesis could be assessed by gadofluorine M-enhanced MR imaging or nerve T2 relaxation time measurement.
Materials and Methods
Animals and Surgery
All interventions and animal care procedures were performed in accordance with the Guidelines and Policies for Animal Surgery provided by our university and were approved by the Institutional Animal Use and Care Committee. All animals were obtained from the Animal Experiment Center of our university and were housed in a standard animal facility with 12-hour on/off light conditions, and allowed free access to standard food and water. Forty-eight adult Sprague-Dawley rats weighing 250 ± 20 g were used to establish peripheral nerve transection injury models. Animals were anesthetized with an intraperitoneal injection of sodium pentobarbital at a dosage of 30 mg per kilogram of body weight (Sigma-Aldrich, St Louis, Missouri). After anesthesia, the left hind limb of each animal was selected to establish sciatic nerve transection injury. In brief, the sciatic nerve was exposed and transected at the midportion of the nerve trunk. Immediately after transection, the nerve was repaired in an end-to-end coaptation with the manner of epineural suturing. The wound was then closed and the animal was returned and housed separately. The right hind limb served as the control, on which sham operations (incision and exploration of the nerve only) were performed.
After surgery, animals were randomly assigned to 2 groups by means of a random number table. The first group was subdivided into groups A (n = 6) and B (n = 6), and the second group was subdivided into groups C (n = 18) and D (n = 18). Groups A and C received daily intraperitoneal injection of LPS (Sigma-Aldrich) at a dosage of 0.32 mg per kilogram of body weight for 7 days postoperatively, as previously reported,8 whereas groups B and D received intraperitoneal injection of the same volume of phosphate buffered saline (PBS) as controls. Animals of the first group (subgroups A and B) underwent serial MR imaging before surgery (baseline), at 3 days, and 1, 2, 3, 4, 6, and 8 weeks after the surgery. In the second group (subgroups C and D), 6 animals each were randomly selected and sacrificed for histologic evaluation at 1, 3, and 6 weeks after MR imaging.
MR Imaging
MR imaging was performed on a 1.5T scanner (Intera; Philips Medical Systems, Best, the Netherlands) with use of a 5-cm linearly polarized birdcage radiofrequency mouse coil (Chenguang Medical Technologies, Shanghai, China). After anesthesia, animals were placed in the prone position. Coronal images including T2WI and T2 measurements and gadofluorine-enhanced T1WI were obtained in a longitudinal plane parallel to the course of the sciatic nerve. T2WI was acquired by using a 3D FSE sequence (TR/TE = 2500/138 ms, flip angle = 90°, echo-train length = 25, section thickness = 1 mm, section gap = 0 mm); T2 relaxation data were obtained by using a single-section multi-spin-echo (TR/TE = 2000/20–160 ms; echo spacing, 20 ms) sequence as previously described.11 Gadofluorine M (250 mmol Gd/L; Bayer Schering Pharma, Berlin, Germany) enhanced imaging was acquired by using fat-suppressed 2D FSE T1WI (TR/TE = 300/17 ms, flip angle = 120°, section thickness = 1 mm, section gap = 0 mm) 24 hours after intravenous injection of gadofluorine M at a dose of 0.1 mmol/L/kg body as previously described.13 Other parameters of all sequences were: FOV = 60 × 60 mm, matrix size = 512 × 512, and NEX = 2.
The nerve signal abnormalities were observed in a blinded manner by 2 authors in consensus (J.S., with more than 10 years of experience with musculoskeletal MR imaging, and F.Z., with 5 years of experience with musculoskeletal MR imaging). Nerve signal intensities (SIs) and T2 relaxation times were measured by these 2 authors independently and in a blinded manner. The average values from the 2 datasets were used for analysis. SIs of the distal stumps of the injured nerves and the sham-operated nerves were measured on gadofluorine M–enhanced T1WI. Nerve enhancement rate was calculated as the ratio of SI of the injured nerve to SI of contralateral sham-operated nerves. T2 relaxation times of the distal stumps were measured by using the region of interest technique. For each measurement, a rectangular region of interest with a minimal size of 85 pixels covering a 10-mm proximal segment of the distal stump was placed within the nerve and along the course of the nerve. The average value generated from all analyzed pixels of each region of interest was adopted and an effort was made to avoid including fatty tissue, edema, and muscle in the measured volume, as previously described.13
Functional Assessment
Sciatic nerve functional recovery was assessed in subgroups A and B by using walking track analysis, which was performed at each time point before MR imaging by 2 authors (X.Z. and X.H.W., both with 3 years of experience with sciatic nerve functional assessment) in a blinded manner by consensus. The sciatic functional index (SFI) was calculated by the formula of Bain et al14 as an indicator of nerve locomotor dysfunction.
Histologic Examination
Animals in the second group (subgroups C and D) were sacrificed after MR imaging at specific time points by transcardial perfusion with PBS followed by 4% paraformaldehyde in 0.1 mol/L PBS (pH = 7.4). The distal stumps of the injury nerves were harvested and postfixed in 4% paraformaldehyde for 1 hour and then cryoprotected in 20% sucrose solution until examination. In addition, a 5-mm segment distal to the injured site was prepared from each distal nerve stump. Contiguous 6-μm cross-sections were obtained from the distal end of the tissue specimens and processed for Luxol fast blue (LFB) (Sigma-Aldrich) and oil red (Sigma-Aldrich) staining as described7 to detect myelin load and myelin debris. Contiguous 15-μm thickness longitudinal sections were obtained in the proximal end of the tissue specimens and processed for multiple immunohistochemical staining to assess macrophage infiltration, TLR4 expression, Schwann cell proliferation, and axonal regeneration. Briefly, sections were blocked with donkey serum (10:100 vol/vol) for 30 minutes, followed by incubation overnight at 4°C with primary antibodies against cluster of differentiation 68 (CD68) (1:200 vol/vol; Abcam, Cambridge, United Kingdom) to detect activated macrophages, S-100 (1:200 vol/vol; Abcam) to detect Schwann cells, TLR4 (1:200 vol/vol; Abcam) to detect TLR4 expression, or small proline-rich protein 1A (SPRR1A) to detect regenerating axons (1:200 vol/vol; Abcam). After being rinsed 3 times with PBS, sections were allowed to incubate with the corresponding Alexa Fluor 594- or 488-conjugated secondary antibody (1:200 vol/vol; Invotrogen, Carlsbad, California) at room temperature for 30 minutes and subsequently with 4′,6-diamidino-2-phenylindole (DAPI) for nuclear staining. The immunoreactive signals were then observed by a confocal laser scanning microscope (LSM710; Carl Zeiss, Jena, Germany).
The quantification of LFB myelin staining, the number of activated macrophages, and the number of regenerating axons were measured per nerve segment. For the quantification of LFB myelin staining, the proportional area of tissue occupied by labeling within the entire cross-sectional area was measured by using a microscope (Axio Observer; Carl Zeiss) equipped with a digital imaging analysis system, as described previously.7 For the quantification of activated macrophages and regenerating axons, the number of labeled cells on CD68-stained longitudinal sections or axons on SPRR1A-stained longitudinal sections per nerve segment was estimated by the optical fractionator method7 using the digital image analysis system equipped with a confocal laser scanning microscope (LSM710).
Statistical Analysis
All data are presented as mean ± standard deviation. In groups A and B, gadofluorine enhancement rates, T2 values, and SFIs obtained at specific acquisition points were compared by using a repeated-measures 1-way analysis of variance, followed by the Student-Neuman-Keuls post hoc test for multiple pair-wise comparisons among different times. In groups C and D, the quantification of myelin LFB staining, the number of activated macrophages, and regenerating axons were compared using an independent t test. A 2-sided P value less than .05 was considered to indicate a significant difference. All statistical tests were performed by using SPSS 13.0 software (IBM, Armonk, New York).
Results
Signal Abnormalities
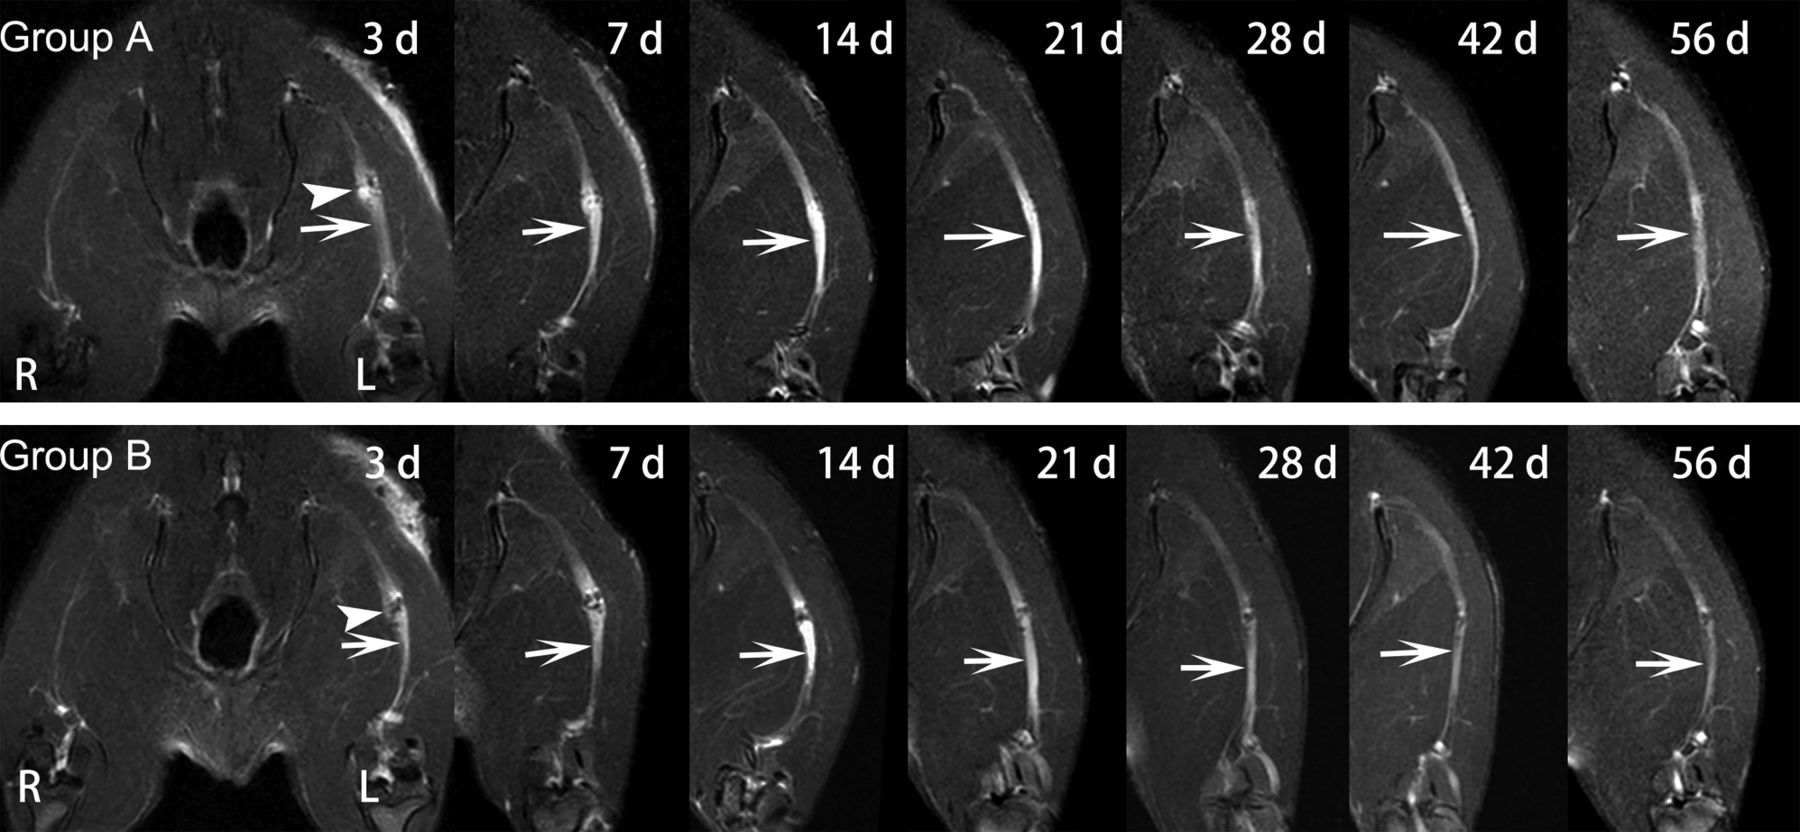
In groups A and B, obvious nerve enlargement, and substantial gadofluorine enhancement and signal abnormality were observed in the distal stumps 3 days after surgery, followed by gradual decrease during the 8-week follow-up. T2 signal abnormality and nerve enlargement returned to almost normal at 6 weeks after surgery in group A, whereas it was at 8 weeks after surgery in group B (Fig 1). Gadofluorine enhancement in groups A and B slowly declined but persisted until 8 weeks after surgery in the distal stumps of nerve. Gadofluorine enhancement was more prominent in the distal stumps of nerves in group A than in group B during the entire study period (Fig 2).

Sequential fat-suppressed T2-weighted images of injured nerves repaired with epineural coaptation. Nerves in group A (LPS treatment) and group B (PBS treatment) show obvious signal abnormalities in the lesion site (arrowhead) and distal stumps (arrows), which gradually declined over time. R = right hind limb; L = left hind limb.

Sequential gadofluorine-enhanced fat-suppressed T1-weighted images of injured nerve repaired with epineural coaptation. Persistent enhancement appears in the lesion site (arrowhead) and distal stumps (arrows) in group A (LPS treatment) and group B (PBS treatment). R = right hind limb; L = left hind limb.
T2 Values
T2 values are shown in the Table and their time courses are shown in Fig 3. In groups A and B, T2 values in both groups showed a rapid increase, then slowly decreased and returned to almost baseline level at 6-week follow-up. Comparatively, the distal stumps in group A had significantly higher T2 values than in group B during the period from 3 days to 3 weeks after surgery (P = .009–.048).
T2 values and gadofluorine enhancement rates of the distal stumps in the injured nerves after surgical repair

Graphs show the time courses of T2 values (A) and gadofluorine enhancement rates for distal stump of injured nerves (B) in group A (LPS treatment) and group B (PBS treatment). * = P < .05. Vertical bars represent the standard deviation.
Gadofluorine Enhancement Rates
Gadofluorine enhancement rates are shown in the Table and their time courses are shown in Fig 3. In groups A and B, gadofluorine enhancement rates of the distal stumps of injured nerves showed a similar time course to T2 values. Gadofluorine enhancement rates in both groups showed a rapid increase, then slowly decreased but remained elevated until 8-week follow-up. The distal stumps in group A had significantly higher gadofluorine enhancement rates than in group B during the period from 3 days to 3 weeks after surgery (P = .004–.037).
Functional Recovery
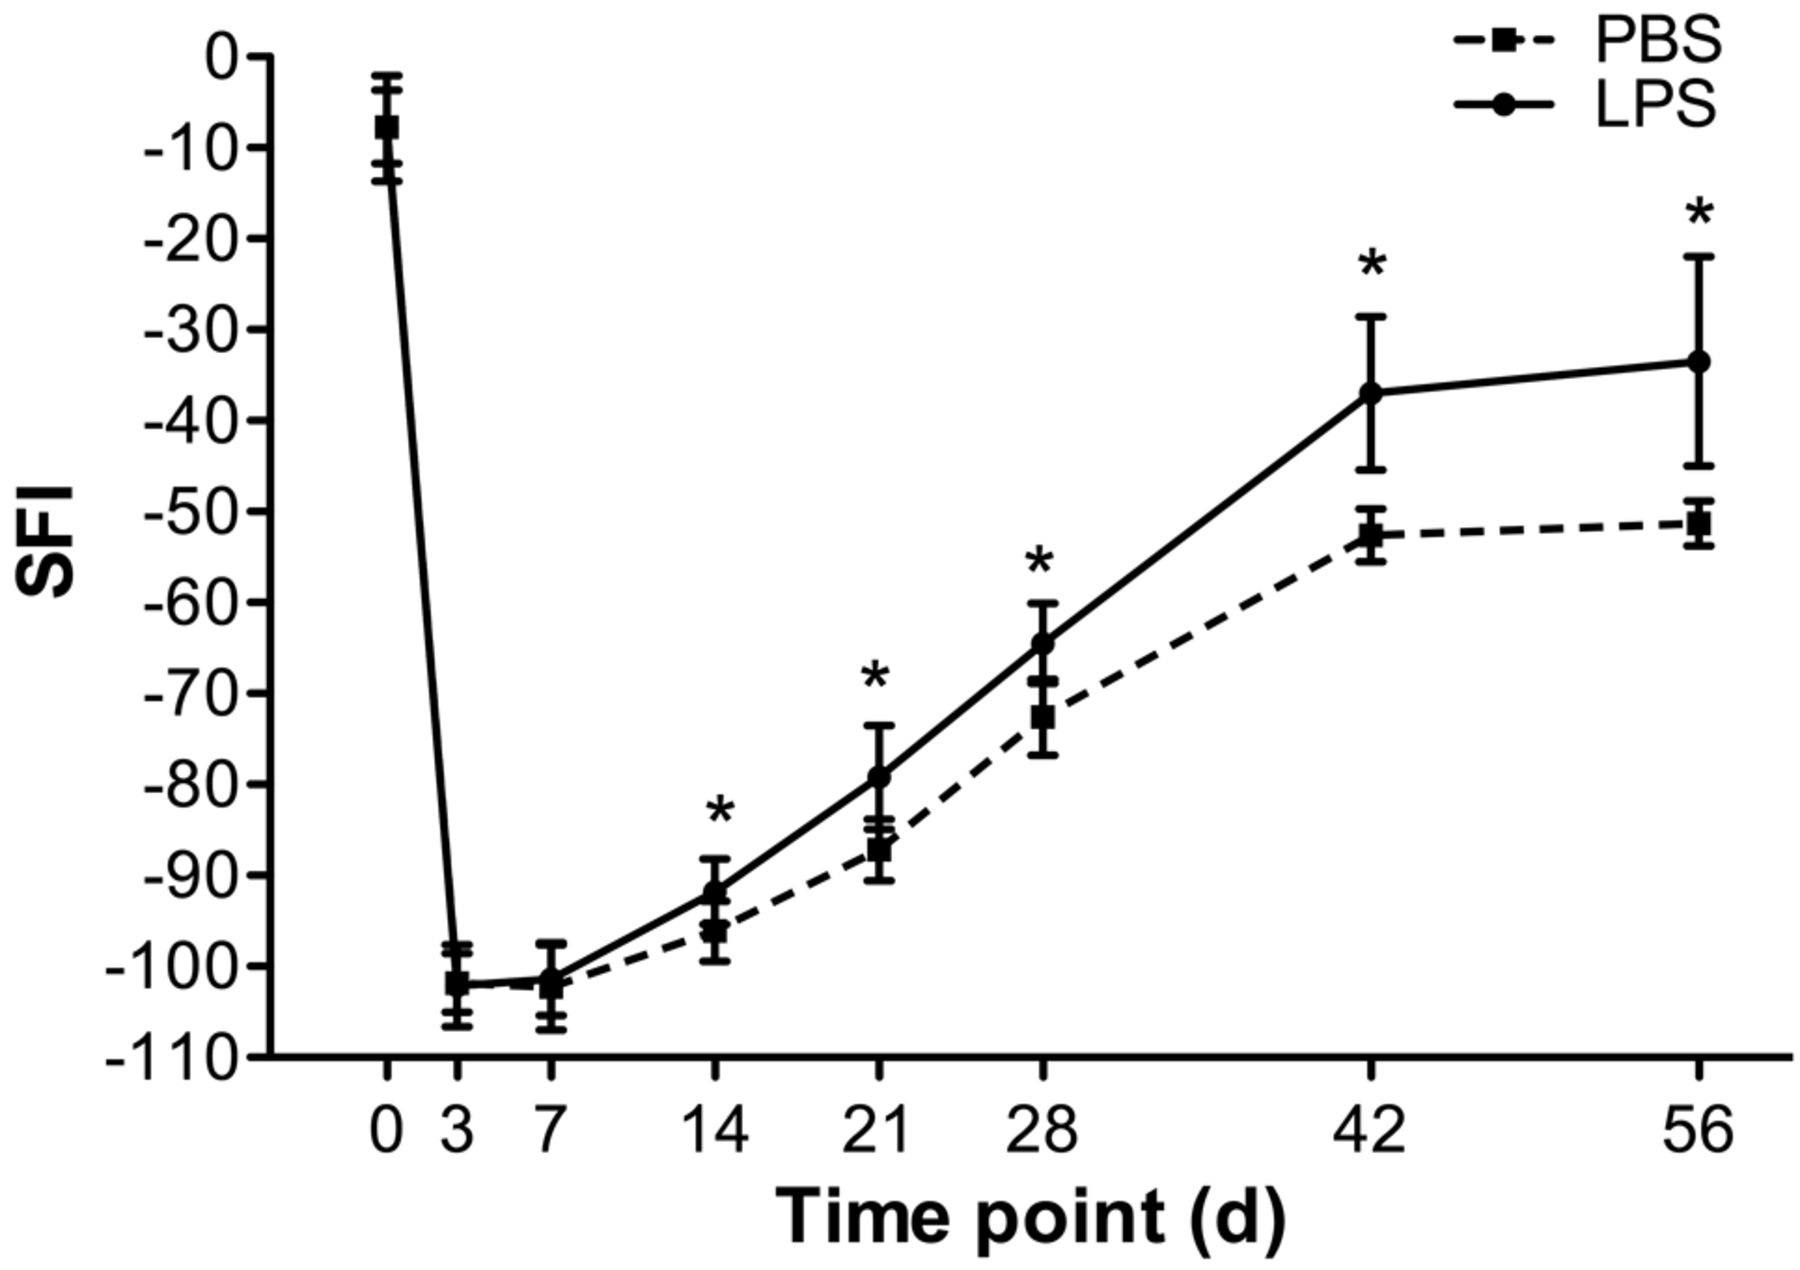
The SFI values are showed in Fig 4. Nerves in groups A and B both demonstrated maximal functional impairment until 2 weeks after surgery, followed by gradual recovery, and reached preinjury levels by 8 weeks after surgery. The SFIs in group A were significantly higher than those in group B during the period from 3 weeks to 8 weeks after surgery (P = .003–.015).

Graphs show time courses of functional recovery in group A (LPS treatment) and group B (PBS treatment). * = P < .05. Vertical bars represent the standard deviation.
Histology
Myelin LFB and oil red staining showed that groups C and D had similar myelin swelling at 1 week after surgery. At 3 weeks after surgery, group C had less prominent myelin breakdown or myelin debris than group D. By 6 weeks after surgery, there was more prominent remyelination in group C than in group D (On-line Fig 1). Immunofluorescence staining showed that group C had higher SPPR1A expression at 3 weeks and 6 weeks after surgery (On-line Fig 2), more CD68+ macrophages as well as more prominent co-expression of TLR4 in macrophages at 1 week and 3 weeks after surgery (On-line Fig 3), more pronounced Schwann cell proliferation from 1 week to 6 weeks after surgery, and more prominent co-expression of TLR4 in Schwann cells at 1 week after surgery in comparison with group D (On-line Fig 4).
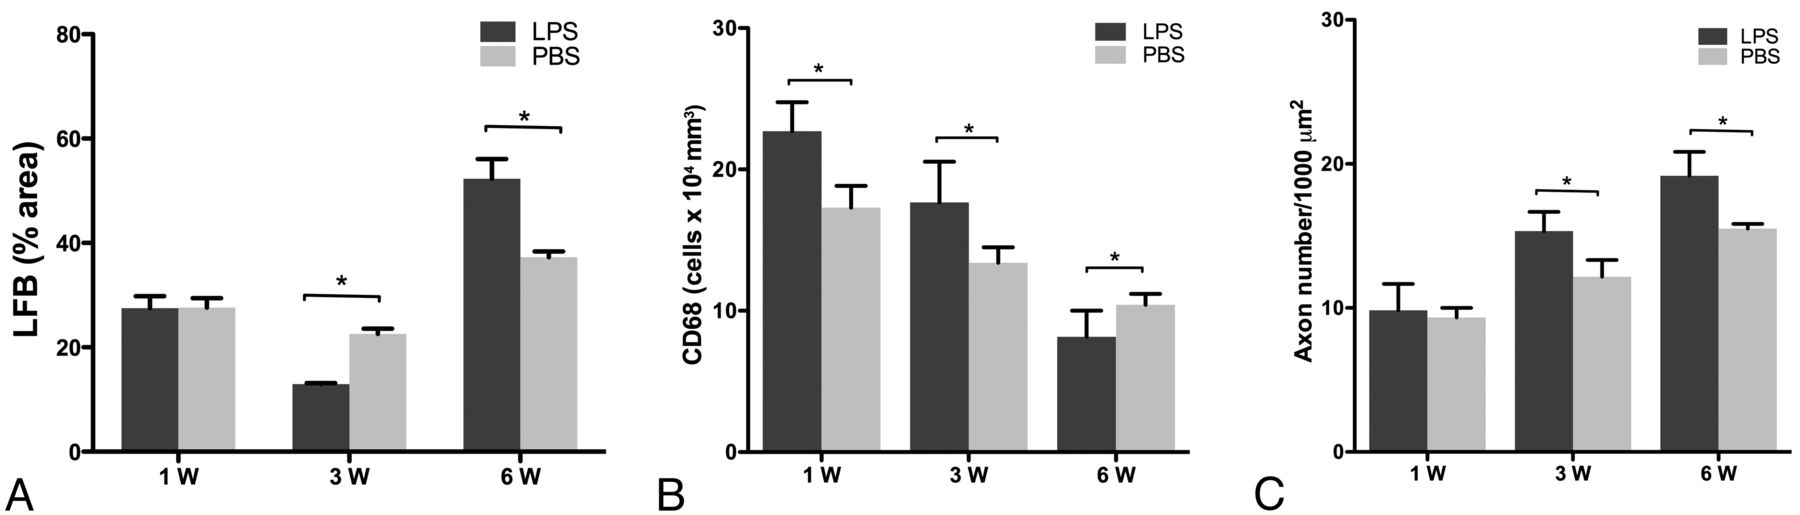
Quantification of myelin stained with LFB, the number of CD68+ macrophages, and the number of regenerating axons are shown in Fig 5. The load of myelin debris was higher in group D compared with group C at 3 weeks after surgery (P < .001). The number of CD68+ macrophages was significantly higher in group C at 1 week and 3 weeks after surgery (P = .0007–.0001), and the number of regenerating axons was higher in group C beginning at 3 weeks after surgery (P = .0003–.0008).

Graphs show the quantification of myelin stained with LFB (A), the number of CD68+ macrophages (B), and the number of regenerating axons (C) in group C (LPS treatment) and group D (PBS treatment). * = P < .05.
Discussion
In our study, systemic injection of LPS was applied to active TLR4 pathways to promote nerve regeneration after surgical repair of the transected nerves. Animals that received LPS injection had more pronounced gadofluorine enhancement and more prolonged T2 values of nerves on MR neurography during the degenerative phase, and achieved slightly higher SFIs and had faster myelin debris clearance and subsequently more pronounced axonal regeneration than those treated with PBS injection.
In Wallerian degeneration following acute nerve injury, axonal degeneration products activate TLR pathway in Schwann cells,15 then TLR signaling activation initiates the innate immune response and aids in subsequent macrophage recruitment, whereas acute neurodegeneration without any intervention would induce a shift in the TLR expression pattern of Schwann cells from normally high expression of TLR3 and TLR4 to strong expression of TLR1.16 Further study also suggests that Wallerian degeneration in animals deficient in TLR2 or TLR4 showed impaired macrophage-mediated debris clearance and axon regeneration. When treated with intraneural delivery of TLR2 or TLR4 ligands into the sciatic nerve crush lesion, the recruitment and myelin phagocytic activity of macrophages could be enhanced, myelin debris clearance could be accelerated, and eventually the locomotor recovery was improved as measured by SFI.7
MR T2 signal intensities can be used to monitor nerve regeneration after the nerve is transected and then repaired with epineural coaptation.17 Furthermore, quantitative T2 relaxation time measurement and gadofluorine enhancement on MR imaging are shown to be able to assess the enhanced nerve regeneration associated with stem cell transplantation12 or stem cell–based tissue-engineered conduit treatment of injured nerves.13 In this study, besides SFI, nerve regeneration after surgical repair was assessed with T2 relaxation time measurements and gadofluorine-enhanced MR imaging. The result of this study showed that T2 values and gadofluorine enhancement in the distal stumps of surgically repaired nerves with or without TLR4 activation had a similar time course with the functional recovery pattern. A return to baseline T2 values or decline in gadofluorine enhancement is correlated well with locomotor recovery. Because T2 values of the distal stumps of injured nerves returned to baseline level at 6 weeks after surgery while gadofluorine enhancement persisted at 8-week follow-up, T2 values are likely a better predictor for assessment of the nerve repair process.
Our study showed that nerves treated with surgical repair in combination with TLR4 activation achieved better functional recovery. Histology revealed that more macrophage recruitment, higher TLR4 expression in macrophages and Schwann cells, and faster myelin debris clearance were present in the degenerative stage, with a subsequent more prominent axon regeneration and Schwann cell proliferation in the regenerative stage. This confirmed the previous beneficial effect of LPS on nerve regeneration after peripheral nerve injury.7 Interestingly, these nerves showed a more prolonged T2 value and more pronounced gadofluorine enhancement during the degenerative phase. In normal nerve tissues, T2 relaxation time has been assigned to 3 components in order of increasing T2 value: myelinic, axonal, and extra-axonal water protons.18 At clinical field strength of MR imaging, intact and disintegrated myelin may not have a crucial effect on the nerve signal on T2-weighted images, whereas axonal disintegration and in particular nerve edema are main determinants for a T2-signal increase.19 As histology revealed that there was less myelin debris load in the distal nerve treated with TLR4 activation at the degenerative phase, the sustained increase of T2 values in nerves treated with TLR4 activation was likely caused by increased extracelluar water content that was associated with relatively larger extracellular space left by the preceding enhanced myelin debris clearance. Gadofluorine M could enter nerves through a disturbed blood-nerve barrier and interacts with local extracellular matrix proteins such as collagens I and IV, proteoglycan, decorin, and tenascin, thereby being locally trapped in the degenerating nerve fibers.20,21 Histology confirmed that gadofluorine could bind to fibrillary structures of the extracellular space and less frequently, to intracellular myelin debris.22 The pronounced gadofluorine enhancement in the degenerating nerves treated with TLR4 activation is probably caused by increased extracelluar volume in degenerating nerve tissues where more gadofluorine bound to extracelluar matrix after their passive diffusion through the disturbed blood-nerve barrier. Therefore, a sustained increase in T2 values or pronounced gadofluorine enhancement in degenerating nerve might indicate a better myelin debris clearance effect relevant to the use of TLR4 activation.
Notably, nerves treated with TLR4 activation showed slightly higher T2 value and prominent gadofluorine enhancement during the regenerative phase. However, no significant difference was determined. This suggested that a major difference in T2 value or gadofluorine enhancement between nerves treated with and without TLR4 activation occurred during the degenerative phase rather than the regenerative phase. As histology revealed that there were more regenerating axons and Schwann cells at the degenerative phase, the marginal increase of T2 values might indicate more prominent nerve regeneration resulted from TLR4 activation treatment. It has been shown that complete clearance of myelin debris usually takes 4 weeks in degenerated nerves,23 and the nerve degeneration and regeneration process with the blood-nerve barrier broken can last much longer, such as over 15 weeks.24 Gadofluorine enhancement can persist until there is complete remyelination and regeneration of the injured nerve.25 Thus, the higher gadofluorine enhancement in nerves treated with TLR4 activation could be assumed in the enhanced nerve fiber regeneration and the ongoing disturbed blood-nerve barrier in the regenerative phase of a severed nerve.
Our study had several limitations. First, nerve repair process was assessed by using conventional T2 values. Diffusion-weighted imaging or diffusion tensor tractography are believed to have great potential as sensitive and noninvasive techniques to detect axonal injury and are objective and reproducible techniques to measure nerve fiber degeneration and regeneration in peripheral nerves.26,27 DTI has been successfully applied to human peripheral nerves by using a 3T scanner, whereas DTI of smaller nerve structures such as rat sciatic nerves in this study need a high performing MR scanner and a dedicated coil technology. On the other hand, DWI is more susceptible to the magnetic susceptibility effect caused by postoperative subtle hemorrhage or micro air bubble, which are most likely introduced during microsurgical manipulation of nerve transection and nerve coaptation. Direct end-to-end repair is technically challenging to perform and usually not feasible in many clinical cases.28,29 Nerve grafts and conduits are becoming increasingly utilized,30 and, in the future, the same methodology as in this study can be applied to regeneration of nerves with grafts and conduits.31 Second, nerve regeneration was only followed for 8 weeks after surgery when gadofluorine enhancement of the injured nerve was still present. Because histology showed that myelin debris clearance had almost completed and nerves showed no significant changes over time since 6 weeks after surgery, increasing observation time probably does not provide additional information to determine the role of T2 value and gadofluorine M–enhanced imaging in monitoring the enhanced nerve repair process mediated by TLR4 activation.
Conclusions
Our study demonstrated that the combined use of TLR4 activation with surgical repair may be associated with a better functional recovery and nerve regeneration. The resultant improved functional recovery and nerve regeneration can be predicted by the sustained increase patterns of nerve gadofluorine enhancement and T2 relaxation times in the degenerative phase. Gadofluorine-enhanced MR imaging as well as nerve T2 values can be used to monitor the enhanced nerve repair process in neurotmesis when treated with the TLR4 activation after surgical coaptation.
Footnotes
This research was supported by National Natural Science Foundation of China (Grant number: 81371607) and the Fundamental Research Funds for the Central Universities of China (Grant number: 11ykzd13).
Indicates open access to non-subscribers at www.ajnr.org
REFERENCES
- 1.
- 2.
- 3.
- 4.
- 5.
- 6.
- 7.
- 8.
- 9.
- 10.
- 11.
- 12.
- 13.
- 14.
- 15.
- 16.
- 17.
- 18.
- 19.
- 20.
- 21.
- 22.
- 23.
- 24.
- 25.
- 26.
- 27.
- 28.
- 29.
- 30.
- 31.
- Received December 4, 2013.
- Accepted after revision January 22, 2014.
- © 2014 by American Journal of Neuroradiology