Abstract
SUMMARY: Resting-state fMRI measures spontaneous low-frequency fluctuations in the BOLD signal to investigate the functional architecture of the brain. Application of this technique has allowed the identification of various RSNs, or spatially distinct areas of the brain that demonstrate synchronous BOLD fluctuations at rest. Various methods exist for analyzing resting-state data, including seed-based approaches, independent component analysis, graph methods, clustering algorithms, neural networks, and pattern classifiers. Clinical applications of resting-state fMRI are at an early stage of development. However, its use in presurgical planning for patients with brain tumor and epilepsy demonstrates early promise, and the technique may have a future role in providing diagnostic and prognostic information for neurologic and psychiatric diseases.
ABBREVIATIONS:
- BOLD
- blood oxygen level–dependent
- DMN
- default mode network
- ICA
- independent component analysis
- RS-fMRI
- resting-state fMRI
- RSN
- resting-state network
fMRI using task-based or stimulus-driven paradigms has been critical to our current understanding of brain function. Using the relative changes from baseline in the BOLD signal during the performance of a task or in response to a stimulus, one infers that certain areas of the brain are activated. In recent years, there has been an increase in interest in the application of the technique at rest, termed resting-state fMRI or functional connectivity MR imaging. RS-fMRI investigates synchronous activations between regions that are spatially distinct, occurring in the absence of a task or stimulus, to identify RSNs. In this review, we provide a discussion of RS-fMRI studies and analysis techniques and present potential clinical applications from the literature.
Background on RS-fMRI
RS-fMRI focuses on spontaneous low frequency fluctuations (<0.1 Hz) in the BOLD signal. The functional significance of these fluctuations was first presented by Biswal et al in 1995.1 In this study, subjects were told not to perform any cognitive, language, or motor tasks. The authors identified a seed region in the left somatosensory cortex on the basis of traditional block design fMRI, during which the same subjects performed bilateral finger tapping. After determining the correlation between the BOLD time course of the seed region and that of all other areas in the brain, the authors found that the left somatosensory cortex was highly correlated with homologous areas in the contralateral hemisphere. The existence of synchronous spontaneous fluctuations between primary and higher order somatosensory areas was further confirmed by later studies.2⇓⇓⇓–6
Perhaps the most fundamental RSN is the DMN (Fig 1A), first identified from PET data by Raichle et al7 (for further discussion, see Gusnard et al8). In this study, the authors analyzed data from healthy volunteers resting quietly with their eyes closed. They found that consistent regions of the brain were active at rest but decreased their activity when cognitive tasks were performed. The default mode network was identified by Greicius et al9 by using fMRI and was confirmed in many studies by using a variety of analysis methods.2⇓⇓⇓–6,10,11 Studies have hypothesized that there are 2 large opposing systems in the brain, one including the DMN and the other composed of attentional or task-based systems, such as somatosensory, visual, or attention RSNs. Terms used to refer to these systems include “task-positive” and “task-negative”4,12,13 and “intrinsic” and “extrinsic.”14,15

Surface plots of RSNs. A, Default mode network. B, Somatomotor network. C, Visual network. D, Language network. E, Dorsal attention network. F, ventral attention network. G, Frontoparietal control network.
Several other RSNs have been identified. The somatosensory network, studied first by Biswal et al,1 includes primary and higher order motor and sensory areas (Fig 1B). The visual network is highly consistent across various studies and spans much of the occipital cortex (Fig 1C).2⇓⇓⇓–6 An auditory network consisting of the Heschl gyrus, the superior temporal gyrus, and the posterior insula has been identified.5 A language network that includes Broca and Wernicke areas but also extends to prefrontal, temporal, parietal, and subcortical regions has been described by using RS-fMRI (Fig 1D).16
RSNs involved in attentional modulation and cognitive control have also been identified. Two networks identified by using both RS-fMRI and task-based fMRI include the dorsal and ventral attention networks.4,6,17,18 The dorsal attention network (Fig 1E) includes the intraparietal sulcus and the frontal eye field and is involved in the executive control of attention. The ventral attention network (Fig 1F), which includes the temporoparietal junction and ventral frontal cortex, is involved in the detection of salient cues (those that stand out from their environment).17 The frontoparietal control network (Fig 1G), which includes the lateral prefrontal cortex and the inferior parietal lobule, is thought to be involved in decision-making processes.19 Finally, the cingulo-opercular network, which includes the medial superior frontal cortex, anterior insula, and anterior prefrontal cortex, is thought to play a role in performing goal-directed task sets.4,20
Analysis Methods
BOLD signal preprocessing generally includes correction for section-dependent time shifts and intensity differences. This is followed by regression of head motion and other nuisance regressors. Nuisance regressors include the signal time courses for regions of interest located in the ventricles and white matter, which are thought to include high proportions of noise related to cardiac and respiratory signals.21⇓⇓–24 Spatial smoothing and low-pass filtering to retain frequencies <0.1 Hz help to remove signal from non-neuronal causes and improve the signal-to-noise ratio.24,25 Images are then registered to atlas space to achieve spatial concordance with coordinate systems and between subjects.
Controversial topics in data preprocessing include whole-brain regression and head-motion correction. Whole-brain regression, which regresses out the average time course of the entire brain, has been proposed as a method of improving the specificity of correlations and reducing noise.26 The whole-brain signal has also been found to correlate with the effects of carbon dioxide partial pressure variation.27 However, some believe that by shifting the distribution of correlations, whole-brain regression produces spurious negative correlations that have no physiologic significance.28,29 Head-motion correction has also recently become a matter of debate because it has been shown that inadequate correction for head motion can result in spurious correlations in RS-fMRI analysis.30⇓–32 Although head motion is less concerning in healthy young adults, it poses significant challenges for the analysis of data acquired from children, older adults, and patients.
After these preprocessing steps, a number of methods can be used to analyze the data, each with its own inherent advantages and disadvantages. In this section, we provide a brief overview of some of the statistical and mathematic approaches previously applied to RS-fMRI data.
The first1 method used was seed-based analysis, which has been applied in numerous studies.1,7,17,19 This method entails selecting ROIs and correlating the average BOLD time course of voxels within these ROIs with each other and with the time courses of all other voxels in the brain. Typically, a threshold is determined to identify voxels significantly correlated with the region of interest. However, this approach requires a priori selection of ROIs.
Another popular approach is ICA,2,10 a mathematic technique that maximizes statistical independence among its components. For RS-fMRI data, ICA can be used to spatially identify distinct RSNs. Compared with seed-based methods, ICA has the advantage of requiring few a priori assumptions but does compel the user to manually select the important components and distinguish noise from physiologic signals. Some studies have aimed to automate this process and use ICA as a method for identifying noise within the BOLD signal.33⇓⇓–36 Despite the differences in the 2 approaches, Rosazza et al37 showed that the results of seed-based analysis and ICA are significantly similar in a group of healthy subjects.
Graph methods provide a distinct alternative to seed-based analyses and ICA.4,38⇓⇓⇓⇓⇓–44 This approach views RSNs as a collection of nodes connected by edges. With RS-fMRI data, ROIs can be represented as nodes, and correlation between the ROIs, as the connectivity of the edges. Connectional characteristics of the graph can then be computed.44 Examples of measures of interest include the average path length, a measure of global connectedness, which is the average length of the shortest connection between all pairs of nodes.44 Another measure of interest is the clustering coefficient, which is related to the connectedness of neighboring nodes and reflects the presence of smaller subgraphs.44 Using these techniques, several studies have demonstrated that the brain exhibits a small world topology. Small world topology, which was first described in social networks, allows each node to have a relatively low number of connections while still being connected to all other nodes with a short distance. This is achieved through the existence of hubs, which are critical nodes with large numbers of connections, that allow high levels of local connectivity.39,45 Small world networks have high clustering coefficients implying high levels of local connections (ie, cliques or groups) and an overall short distance between any 2 nodes, or a small average path length.40⇓–42
Another method used to analyze RS-fMRI data is clustering algorithms. Clustering algorithms attempt to group items that are alike on the basis of a set of relevant characteristics to the problem of interest. When analyzing RS-fMRI data, one may want to group a collection of voxels or ROIs on the basis of similarities in their BOLD time courses by using some distance metric, such as a Pearson correlation. One example of a clustering algorithm is hierarchical clustering,42,46 which builds a dendrogram (a treelike structure) of all members. Other examples of clustering algorithms are the K-means15 and c-means47 clustering algorithms. In these algorithms, all voxels are assigned membership to 1 of several clusters on the basis of their distances from the cluster centers, which, in turn, are calculated from an average of their members. The algorithm iterates to update memberships and cluster centers until convergence is achieved.47 Other variations on clustering include spectral-based clustering48 and graph-based clustering.11
Multivariate pattern classification is another method that can be used for analysis of RS-fMRI data.49 This approach uses patterns in the data that were previously deemed important in a training dataset to classify a new dataset. As an example, one might identify specific sets of patterns or features for each RSN and use them to identify the networks in a new dataset.50 In another example, Dosenbach et al51 used RS-fMRI to predict individual brain maturity. Temporal correlations were computed between the BOLD time courses of various regions throughout the brain. Some of these functional connections were more informative than others in predicting brain maturity and could be used in a classifier to predict the brain maturity of an individual.
Reliability of RS-fMRI
Important issues to consider in regard to RS-fMRI are the test-retest reproducibility and intersubject variability. Studies suggest that RSNs can be detected reliably across imaging sessions52,53 and across different subjects,10,53 though there may be some loci of variability between subjects.52 In particular, Chou et al54 examined the reproducibility of RS-fMRI during 1 year and found an intraclass correlation of >0.60 for >70% of the functional networks examined.
Clinical Applications
RS-fMRI has provided many interesting insights on RSNs in the healthy brain and in multiple disease states.55 However, practical application of RS-fMRI in the clinical setting requires the ability to establish conclusions on the basis of analysis of data from individual patients. In this section, we focus on studies that have demonstrated potential clinical applications at the single subject level. Group-level studies were included in the pediatric applications section due to the more limited literature in this cohort.
Presurgical Localization of Eloquent Cortex
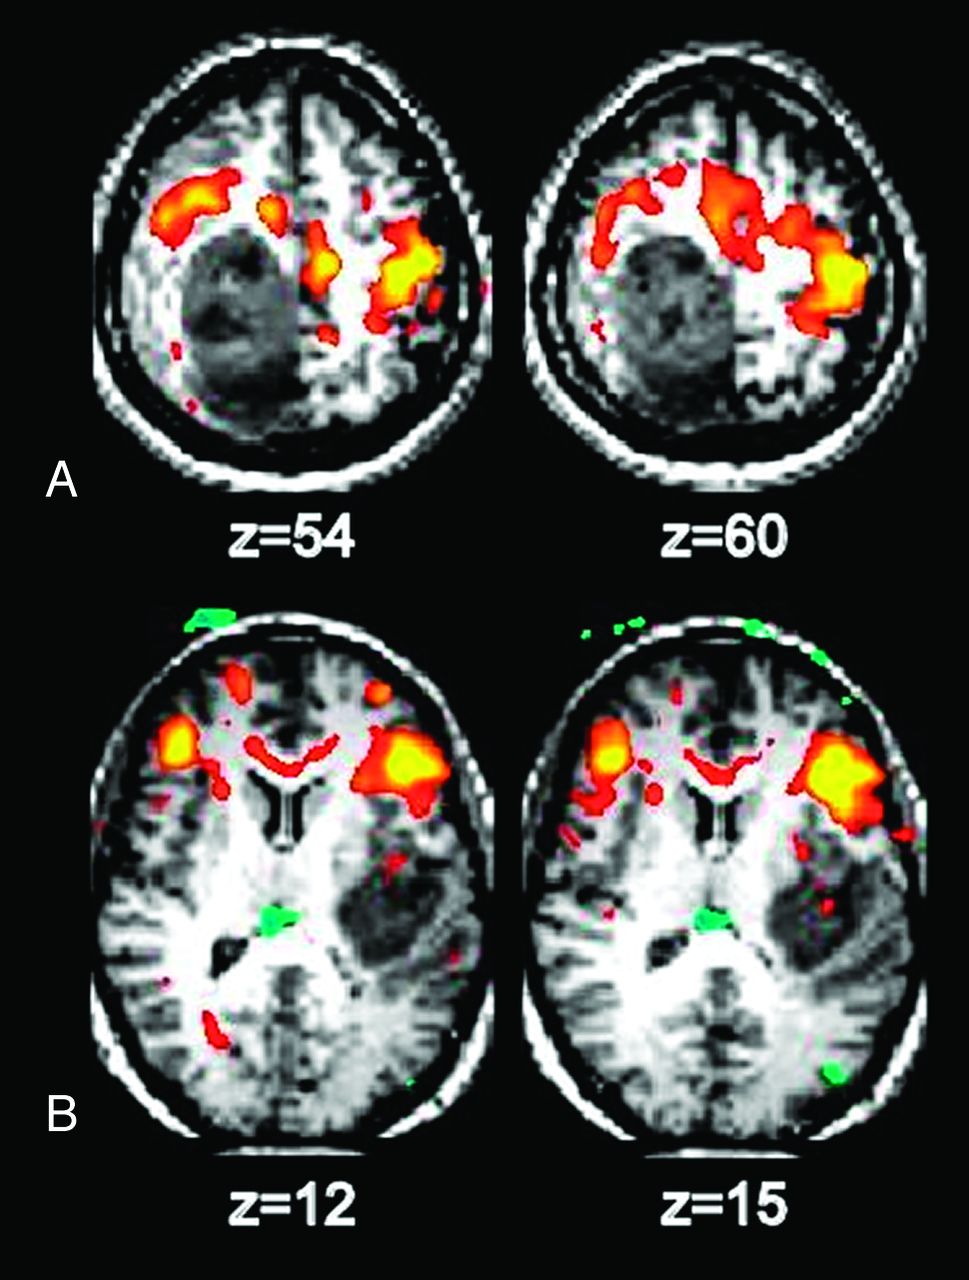
RS-fMRI has been applied to identify specific brain RSNs for presurgical planning in patients with brain tumor (Fig 2). Compared with existing task-based methods, RS-fMRI is less demanding and can be performed on patients who may not otherwise be able to cooperate with task-based paradigms, such as young children, patients with altered mental status, sedated patients, and those who are paretic or aphasic,56⇓–58 especially because BOLD activity seen in RS-fMRI has also been seen during sleep59 and anesthesia.60,61 Another advantage of RS-fMRI over task-based fMRI is the ability to identify many networks simultaneously, thus saving scanning time if information from multiple networks is required.

Identification of motor and language areas by using RS-fMRI in 2 patients with glioblastoma multiforme. A, The somatosensory area is displaced anterior to the tumor. B, Broca area is displaced anterior to the tumor.
Several studies have reported the application of RS-fMRI for preoperative planning. Zhang et al62 reported the successful localization of motor areas in 4 patients with tumors distorting sensorimotor regions. Using a seed-based approach, they used an ROI placed in the contralateral undistorted sensorimotor cortex to identify the sensorimotor area in the distorted ipsilateral hemisphere. A study by Kokkonen et al57 illustrated the convergence between ICA analysis of RS-fMRI and task-based fMRI in identifying sensorimotor areas in 8 patients with tumor and 10 controls. An additional study by Kokkonen et al,63 comparing RS-fMRI pre- and postresection in patients with glioma, suggested that edema affects the BOLD response on the side ipsilateral to the tumor and that auditory and motor cortices are easier to detect postoperatively by using the BOLD signal.
A more challenging problem is the identification of language areas, which are known to be more variable in location64 and which can also be distorted by tumor. In particular, this presents a challenge to the seed-based approach but may be more tractable with other analysis methods.
Surgical Planning in Patients with Epilepsy
RS-fMRI may also be used for presurgical planning in patients with epilepsy. The higher spatial resolution afforded by RS-fMRI over electroencephalography could provide a distinct advantage in mapping epileptic foci or networks. Seed-based methods were used by Liu et al56 to successfully locate sensorimotor areas by using RS-fMRI in patients with tumors or epileptic foci close to sensorimotor areas. They found agreement between RS-fMRI, task-based fMRI, and intraoperative cortical stimulation data. In another study from the same laboratory, Stufflebeam et al65 were able to localize areas of increased connectivity in 5 of 6 patients that overlapped with epileptogenic areas identified by invasive encephalography. Zhang et al66 used graph methods and a pattern classifier to identify regions involved in the epileptogenic network. Using RS-fMRI data from 16 patients with intractable medial temporal lobe epilepsy, they achieved an average sensitivity of 77.2% and a specificity of 83.86%. Bettus et al67 reported that increases in basal functional connectivity were a specific marker of the location of the epileptogenic zone in 22 patients with mesial temporal lobe epilepsy.
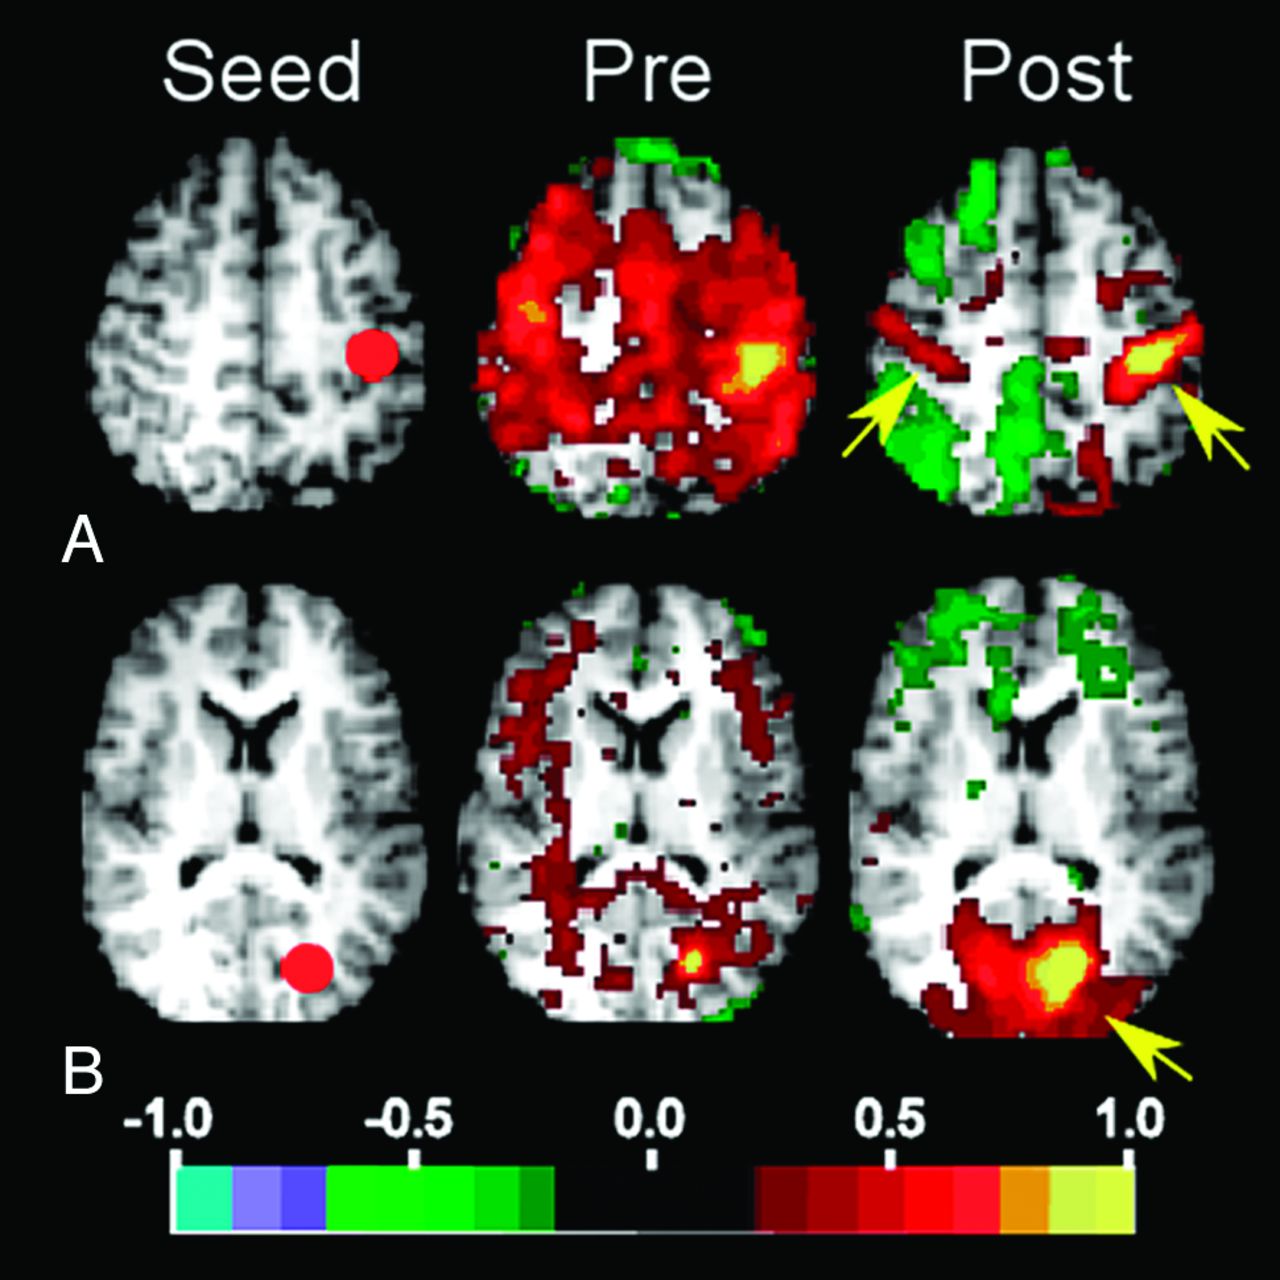
In the future, RS-fMRI may also be of benefit in selecting patients for epilepsy surgery and in evaluating their outcomes. In a study of a 5-year-old patient with severe epileptic encephalopathy, a normal pattern of RSNs returned following corpus callosotomy (Fig 3).68 The change from abnormal to normal RSNs was accompanied by the resolution of behavioral regression that had preceded the surgery and the resumption of new skill development. The implications of this study extend beyond the benefit to the practice of epilepsy surgery by providing evidence that RSNs may be essential to the development and maintenance of the functional organization of the brain.

Selected seed-based correlation maps. Columns show the seeds (left), preoperative maps (middle), and postoperative maps (right). The map quantity illustrated is the Fisher z-transformed correlation coefficient thresholded at ± 0.2. A, Left somatomotor cortex seed (−39 −26 51). Postoperatively, the somatomotor RSN is improved and involves primary somatosensory areas (arrows). B, Visual cortex seed (−20 −75 12). Postoperatively, the visual RSN is improved and involves the occipital lobe (arrow).
Identification of Patients with Alzheimer Disease
Several studies have demonstrated the potential utility of RS-fMRI in identifying patients with Alzheimer disease. A graph analysis of fMRI data from patients with Alzheimer disease and controls showed that clustering coefficients for the hippocampus were significantly lower in patients compared with controls, and that this measure could separate patients from controls with a sensitivity of 72% and a specificity of 78%.69 Koch et al70 studied 15 patients with Alzheimer disease and investigated differences in the default mode network as a marker for Alzheimer disease. They used both ICA and the correlations between 2 ROIs within the DMN. With a multivariate model including both methods, they achieved an accuracy of 97%. The authors of another study used parameters from both structural MR imaging and RS-fMRI and were also able to distinguish patients with Alzheimer disease from healthy controls with an accuracy of 89%.71 Interestingly, this study also found that several default mode regions were most important in the classification.
Chen et al72 studied patients with Alzheimer disease, patients with amnestic mild cognitive impairment, and controls and used seed-based methods to determine correlations between pairs of 116 regions. Using linear regression analysis and a leave-one-out cross-validation, the authors showed that RSN characteristics could identify patients with Alzheimer disease and distinguish patients with mild cognitive impairment from controls.
RS-fMRI may also be able to distinguish different types of dementia. In a study of behavioral-variant frontotemporal dementia, Alzheimer disease, and controls, reciprocal changes were seen between the frontotemporal and Alzheimer dementia groups.73 The frontotemporal dementia group demonstrated decreased connectivity in the salience network but increased connectivity in the default mode network. Conversely, patients with Alzheimer disease demonstrated decreased connectivity in the default mode network but increased connectivity in the salience network. A linear discriminant analysis by using these divergent characteristics was able to distinguish frontotemporal dementia from Alzheimer disease in all cases and achieved an overall 92% accuracy.
Other Applications
Recent work has demonstrated the ability of RS-fMRI to assist in the diagnosis of disorders of consciousness, demonstrating a negative correlation between the connectivity of the DMN and the level of consciousness impairment.74 Pattern classification of RS-fMRI has been applied to distinguish patients with psychiatric diseases from controls, including major depressive disorder75 and schizophrenia.76,77 RS-fMRI has also been used to identify patients with autism78 and attention deficit/hyperactivity disorder.79
Pediatric Applications
RS-fMRI can also be applied to study pediatric populations. Recent work has used RS-fMRI in infants to demonstrate immature forms of RSNs incorporating regions similar to those identified in older children and adults. Smyser et al80 performed longitudinal analysis of network development in a cohort of very preterm infants during the neonatal period. Multiple RSNs were identified as early as 26 weeks' gestation, with characteristic patterns of neural network development reported. Interestingly, differences in RSNs were identified between term infants and those born prematurely, a finding also reported by using other neuroimaging modalities. Doria et al81 reported a similar collection of RSNs during the neonatal period in a cohort of preterm infants. Other investigators have applied RS-fMRI to define early forms of RSNs during infancy in former preterm and healthy term-born subjects.82⇓⇓–85
RS-fMRI of healthy subjects during early and middle childhood has established the patterns of normative functional cerebral development during this period.86⇓⇓–89 Although many RSNs are similar to those recognized in adults, consistent differences reported in pediatric subjects include decreased long-range and increased short-range correlations. The clinical significance of these differences remains undetermined. Most recently, RS-fMRI has been applied to investigate differences in RSN development across pediatric disease states. Investigations in older populations have demonstrated disparities in neural networks for many disease states, including Tourette syndrome, attention deficit/hyperactivity disorder, and autism spectrum disorder.90⇓–92
Future Directions
Although studies to date are promising, much work is needed before RS-fMRI can be used routinely in the clinical setting. Further work is needed to compare the various analysis methods and their efficacy in detecting different disease states both in groups and especially in individual subjects. The Human Connectome Project,93 which is currently in progress, will aid in furthering our understanding of the relationships between functional connectivity and structural connectivity by using advanced MR imaging methods with behavioral and genetic factors.
CONCLUSIONS
RS-fMRI has provided new insights on the functional architecture of the healthy brain. Various RSNs, or collections of regions that have synchronous spontaneous BOLD fluctuations, have been identified, including the DMN and sensorimotor, visual, and attentional networks. While clinical applications of RS-fMRI are still limited, many potential clinical applications are currently being investigated and include presurgical planning for patients with brain tumor and epilepsy. Because it is noninvasive and does not require patient cooperation, RS-fMRI may be particularly useful in patients who are not able to undergo currently available methods for lesion localization. Other potential clinical applications include the identification of patients with Alzheimer disease and various other neurologic and psychiatric diseases.
Footnotes
This work was supported by grant NIH R21 CA159470 (J.S.S.).
Indicates open access to non-subscribers at www.ajnr.org
REFERENCES
- 1.
- 2.
- 3.
- 4.
- 5.
- 6.
- 7.
- 8.
- 9.
- 10.
- 11.
- 12.
- 13.
- 14.
- 15.
- 16.
- 17.
- 18.
- 19.
- 20.
- 21.
- 22.
- 23.
- 24.
- 25.
- 26.
- 27.
- 28.
- 29.
- 30.
- 31.
- 32.
- 33.
- 34.
- 35.
- 36.
- 37.
- 38.
- 39.
- 40.
- 41.
- 42.
- 43.
- 44.
- 45.
- 46.
- 47.
- 48.
- 49.
- 50.
- 51.
- 52.
- 53.
- 54.
- 55.
- 56.
- 57.
- 58.
- 59.
- 60.
- 61.
- 62.
- 63.
- 64.
- 65.
- 66.
- 67.
- 68.
- 69.
- 70.
- 71.
- 72.
- 73.
- 74.
- 75.
- 76.
- 77.
- 78.
- 79.
- 80.
- 81.
- 82.
- 83.
- 84.
- 85.
- 86.
- 87.
- 88.
- 89.
- 90.
- 91.
- 92.
- 93.
- © 2013 by American Journal of Neuroradiology