Abstract
BACKGROUND AND PURPOSE: WMH, associated with cognitive decline and cardiovascular risk factors, may represent only the extreme end of a more widespread continuous WM injury process that progresses during aging and is poorly understood. We investigated the ability of FLAIR and DTI to characterize the longitudinal course of WMH development.
MATERIALS AND METHODS: One hundred nineteen participants (mean age, 74.5 ± 7.4), including cognitively healthy elders and subjects diagnosed with Alzheimer disease and mild cognitive impairment, received a comprehensive clinical evaluation and brain MR imaging, including FLAIR and DTI on 2 dates. The risk for each baseline normal-appearing WM voxel to convert into WMH was modeled as a function of baseline FA (model M1) and both baseline FA and standardized FLAIR (M2). Sensitivity, specificity, accuracy, and AUC for predicting conversion to WMH were compared between models.
RESULTS: Independent of clinical diagnosis, lower baseline FA (P < .001, both models) and higher baseline FLAIR intensity (P < .001, M2) were independently associated with increased risk for conversion from normal WM to WMH. M1 exhibited higher sensitivity but lower specificity, accuracy, and AUC compared with M2.
CONCLUSIONS: These findings provide further evidence that WMH result from a continuous process of WM degeneration with time. Stepwise decreases in WM integrity as measured by both DTI and FLAIR were independently associated with stepwise increases in WMH risk, emphasizing that these modalities may provide complementary information for understanding the time course of aging-associated WM degeneration.
ABBREVIATIONS:
- AD
- Alzheimer disease
- AUC
- area under the receiver operating characteristic analysis curve
- CN
- cognitively healthy
- FA
- fractional anisotropy
- M1
- first logistic regression model
- M2
- second logistic regression model
- MCI
- mild cognitive impairment
- MDT
- minimal deformation template
- nFA
- baseline normalized FA
- nFL
- baseline normalized FLAIR
- OR
- odds ratio
- WMH
- white matter hyperintensities
A growing body of literature suggests that cerebral WM damage is common with advancing age and is associated with cognitive decline in elderly individuals.1⇓–3 In particular, WMH are a common finding on T2-weighted FLAIR MR imaging of older individuals, which increase in prevalence with age and vascular risk factors4⇓⇓–7 and are associated with diminished cognitive performance. Furthermore, reductions in FA and other quantitative measures of white matter integrity derived from DTI are correlated with the clinical diagnoses of MCI and AD, as well as with age-associated cognitive impairment and cerebrovascular disease.8,9 Compared with FLAIR, DTI measures may be more sensitive than WMH to subtle white matter injury.10 However, the time course of development of white matter injury in the aging brain and how this time course is modified by various risk and protective factors are currently unclear. Identifying predictors of such white matter injury could encourage finding strategies for preventing white matter injury, which would thus help to ameliorate age-related cognitive decline.
Understanding the time course and the biology of the development of WMH is clinically relevant for a number of reasons: First and foremost, cross-sectional studies have found that WMH are consistently associated with cognitive impairment,11 including clinically significant memory impairment,6 and increase the likelihood of conversion from mild cognitive impairment to dementia.12 In addition, longitudinal differences in WMH are associated with vascular risk factors and cognitive decline, even in middle age,13 as well as an increased risk for future stroke, dementia, and death.14 Given that WMH are the direct consequence of vascular risk factors, understanding the biology of the evolution of WMH may help to identify new outcome measures for clinical trials that seek to control vascular risk factors and improve cognitive outcomes.15,16
Both FLAIR and DTI appear to be promising predictors of future age-associated white matter injury, but their utility in this regard has been limited due to methodologic issues. In FLAIR studies, WMH have been modeled as distinct sharply delineated anatomic abnormalities that are either present or absent. Instead, WMH may be surrounded by penumbra of subtly injured tissue; thus, WMH may represent merely the focal peaks of more widespread and subtle white matter injury.17
Prior FLAIR studies may have failed to capture the true degree and extent of age-associated white matter injury by concentrating solely on WMH defined by thresholds on FLAIR, rather than the entire range of FLAIR signal values.18 DTI, meanwhile, appears to be better suited for modeling white matter degradation as a continuous process and has been shown to be sensitive to subtle WM changes that occur with advancing age.10,19⇓⇓–22 However, while FLAIR scans are easy to interpret—high signal values generally indicate WM injury—using DTI scans to make inferences about WM injury requires more sophistication. The key reason is that DTI measurements depend heavily on the underlying structural organization of the white matter, even in healthy young individuals; thus, a low FA value may represent heterogeneous local axonal fiber orientations, white matter injury, or a combination of both.19 Additionally, while diffusion MR imaging technology is evolving quickly, the resolution of current DTI sequences is lower than that in their conventional counterparts, and the relatively low signal-to-noise and imaging artifacts23 require caution when interpreting images. Because much of the information inherent in the FLAIR signal is generally discarded and because DTI has inherent measurement complications, it is currently unclear whether either of the 2 modalities may be useful for predicting longitudinal changes in WM integrity in the aging brain.
The goal of this study was to investigate the role of FLAIR and DTI as predictors of longitudinal WM change in the aging brain. Specifically, we used both continuous FLAIR-based measures and continuous DTI-based measures as predictors of incident WMH at follow-up. The FLAIR-based measures controlled for interindividual FLAIR signal scaling differences, and the DTI-based measures controlled for inter-regional differences in inherent tissue organization. We chose the incidence of WMH as our measure of WM degeneration due to the large body of work that has established its relevance as a marker of brain injury and cognitive change. While incident WMH are defined by thresholds on FLAIR signal values at follow-up, using the entire range of baseline FLAIR signal values as a predictor of WMH is not necessarily circular—in fact, the time course of FLAIR signal evolution with time from normal-to-abnormal levels in aging has never been established clearly, to our knowledge.
Materials and Methods
Sample
The sample included 119 community-dwelling individuals who received comprehensive baseline clinical diagnoses according to standardized criteria at the Alzheimer Disease Center at the University of California, Davis. The diagnosis of AD was made according to the criteria of the National Institute of Neurologic and Communication Disorders and the Stroke/Alzheimer Disease and Related Disorders Association.24 MCI was diagnosed according to current consensus criteria.25 Individuals were classified as CN if no clinically significant cognitive impairment was identified. In addition, all subjects received standardized MR imaging of the brain at 2 different dates with a mean interscan interval of 3.7 ± 1.8 years. The institutional review boards at all participating institutions approved this study, and subjects or their legal representatives gave written informed consent. Among the 119 participants, 13 were diagnosed with AD, 34 were diagnosed with MCI, and 72 were CN at baseline.
Image Acquisition and Processing
All brain imaging was performed at the University of California, Davis Imaging Research Center on a 1.5T Signa Horizon LX EchoSpeed system (GE Healthcare, Milwaukee, Wisconsin). We used 3 sequences: a 3D T1-weighted coronal spoiled gradient-recalled echo acquisition, a FLAIR sequence, and DTI by using the DTI-EPI sequence (Stanford University, Stanford, California). All image acquisition was performed according to previously reported methods.8,26
Diffusion-weighted images were generated by using gradients applied in 6 directions given by (Gx, Gy, Gz) = (1, 1, 0) (1, −1, 0), (1, 0, 1) (1, 0, −1),(0, 1, 1) (0, 1, −1) with total gradient diffusion sensitivity measured at b = 1000 s/mm2. To improve spatial registration before calculation of the maps, an image-distortion correction (unwarping) scheme based on an earlier scheme by Haselgrove and Moore27 was applied to the images. FA was calculated at each image from the 3 eigenvalues of the diffusing tensor (see Lee et al8 for a detailed description). Segmentation of WMH was performed by a semiautomated procedure by using a set of in-house computer algorithms and programs previously described.28 In this procedure, FLAIR image voxel intensities are corrected for bias on a section-by-section basis. Corrected intensities, modeled as a Gaussian distribution exceeding the mean value plus 3.5 SDs, are labeled as WMH in each section. With a previously described image-registration method,8 WMH, FLAIR, and FA maps were linearly aligned to the corresponding T1-weighted scan, which, in turn, was deformed to a MDT29 with voxel dimensions of 0.98 × 1.5 × 0.98 mm3. This allowed transfer of all FLAIR, FA, and segmented WMH maps to the MDT space. A WM probability map in the MDT space was created by labeling the WM voxels in each T1-weighted scan,30 transforming the resulting WM masks to MDT space, and averaging across the population. Creating a threshold of this WM probability map provided a binary WM mask in MDT space.
We created average young adult FA maps in MDT space (FAyoung) as previously described8 for comparison with the individuals of the present study. These maps were made by transforming the FA images of 15 healthy young adults to MDT space (mean age, 24.1 ± 3.1 years; 60.0% men) and taking the average at each voxel.
Stratifying Baseline FA and FLAIR Values
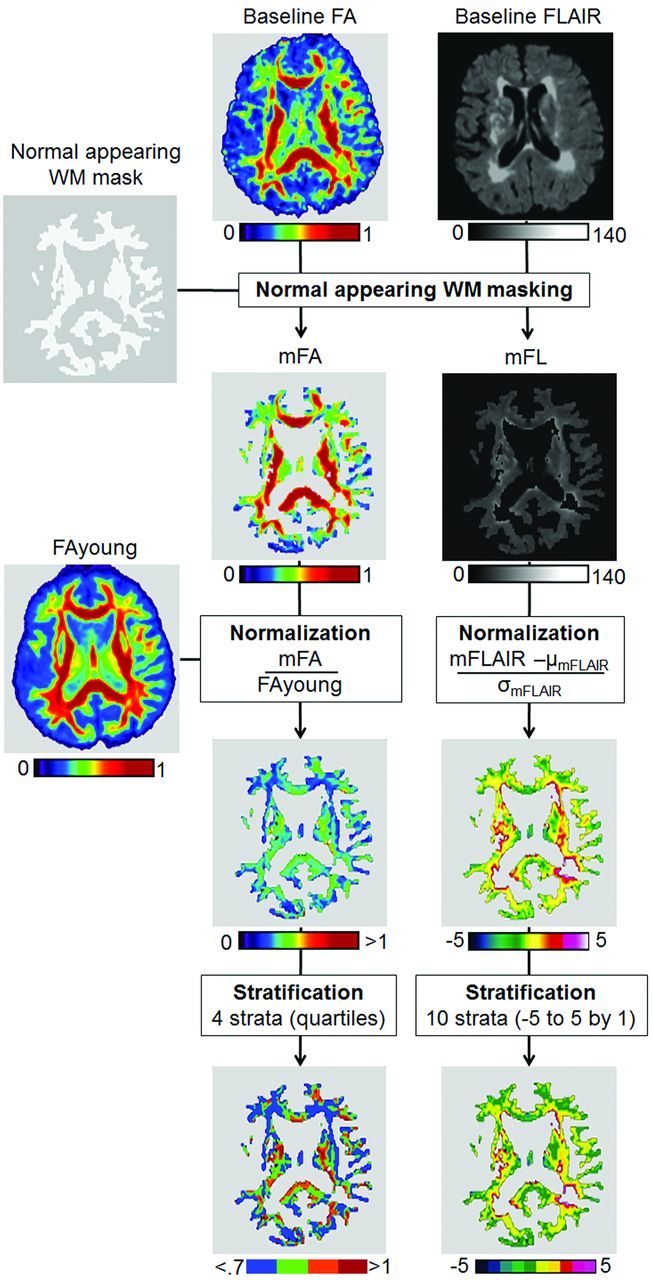
Baseline FA values were standardized to account for inherent variability in FA that is due to the intrinsic organization of WM tracts.8 For each subject, we first subtracted the baseline WMH map from the WM mask described above and applied the resulting normal-appearing WM mask to the individual baseline FA and FLAIR images to ensure keeping the baseline FA and FLAIR values for normal-appearing WM voxels only. For each subject, we created a normalized FA WM map defined as the ratio of the FA WM map of the subject and the FAyoung map described above. In such a normalized FA WM map, a voxel with a value lower than 1 indicates that the subject exhibits, independent of the organization of WM in this voxel, a lower FA compared with the young reference group. Finally, normalized FA WM maps were categorized into 4 strata according to normalized FA quartiles of our sample (<0.7, 0.7∼0.9, 0.9∼1, and >1).
Baseline FLAIR values were normalized to account for arbitrarily interindividual scaling differences in FLAIR intensities. For each subject, we calculated the mean and SD of FLAIR signal values within healthy WM after removal of voxels that were WMH at baseline. The normalized FLAIR image was defined by replacing FLAIR signal values with their z scores: Each voxel in the normalized image indicates how many SDs the initial FLAIR voxel value had been above or below the normal WM mean. Finally, normalized FLAIR WM images were stratified by breaking up the range of values into 10 strata from −5 to 5. The steps of normalization and stratification are displayed in Fig 1.

Flow chart of FA and FLAIR image normalization. WM: μ and σ indicate, respectively, mean and SD.
Calculation of the Risk for a Voxel to Convert into WMH
For each subject, we generated a map that contained only incident WMH, by subtracting the baseline WMH map from the follow-up WMH map. We then calculated within each stratum of baseline nFA, the number of voxels that were normal-appearing WM at baseline and then either converted or did not convert to WMH at follow-up. To investigate the complementary role of nFL as a predictor of incident WMH, we also calculated the number of baseline-normal WM voxels within each pairing of nFA stratum and nFL stratum that converted or did not convert to WMH at follow-up. Analysis of incident WMH rates by strata allowed statistical modeling of differences in WMH rates between strata.
Statistical Analyses
The key goals of the statistical analysis were to determine whether the baseline nFA stratum was associated with increased risk for voxels to convert to WMH at follow-up and to assess whether the nFL stratum was associated with a risk of conversion to WMH independent of nFA. Mixed-effects generalized linear models were used to achieve these goals. Two different logistic regression models were computed. The first, M1, modeled the probability of conversion to WMH as a function of nFA stratum. The second, M2, modeled the probability of conversion to WMH as a function of both nFA and nFL strata. To explore whether nFL and nFA effects may be modulated by baseline clinical diagnosis, we also included the clinical diagnosis and its interaction with both baseline nFA and nFL signals in M2.
Only nFL strata above −1 were included in the analysis because very few voxels with baseline FLAIR below −1 SD from the normal WM mean converted to WMH. Both models included random effects due to subject identity as well as the age and interscan intervals as continuous covariates, centered on the mean age and interscan intervals of our sample (Table 1). The interaction of nFA and nFL strata fixed effect was tested for the M2 model but was found to be not significant and therefore was removed from the model. For M1 and M2, the OR and 95% confidence interval for conversion to WMH were obtained for each nFA and nFL strata. The probability obtained for a reference condition is used to normalize the probabilities under the other conditions, to compute the OR. The highest level of nFA (>1 stratum) and lowest level of nFL (−1∼0 strata) were used as reference categories because these are more likely to contain normal WM voxels only. ORs were compared by using post hoc t tests adjusted for multiple comparisons.
Summary of subject characteristics, broken down by diagnostic categorya
The sensitivity, specificity, and accuracy of WMH conversion predictions were computed for both logistic regression models.
Statistical analyses were performed by using R, Version 2.13.0 (R Development Core Team, Vienna, Austria).
Results
Demographics
Descriptions of demographics, clinical groups, and WMH MR imaging measures of all the subjects are summarized in Table 1. The annual rate of change in WMH volume was found be significant (P < .001) and to differ across the clinical group (P = .013) with higher rates of WMH incidence in individuals with AD and MCI compared with those who are CN.
Effect of Baseline FA on Risk of Incident WMH (M1)
Table 2 shows the OR for conversion to WMH within each nFA stratum as estimated by M1, assuming the mean age and interscan interval (74.5 and 3.7 years, respectively). Stepwise decreases in the nFA stratum incurred stepwise increases in WMH conversion risk, with voxels in the lowest nFA stratum 2 times more likely to convert to WMH on follow-up than those in the highest nFA stratum.
Summary of the generalized linear mixed-effects model of risk for a voxel to convert into white matter hyperintensities at follow-up with baseline nFA (M1) strata or baseline nFA and nFL (M2) strata as main factorsa
Effect of Baseline FA and FLAIR on Risk of Incident WMH (M2)
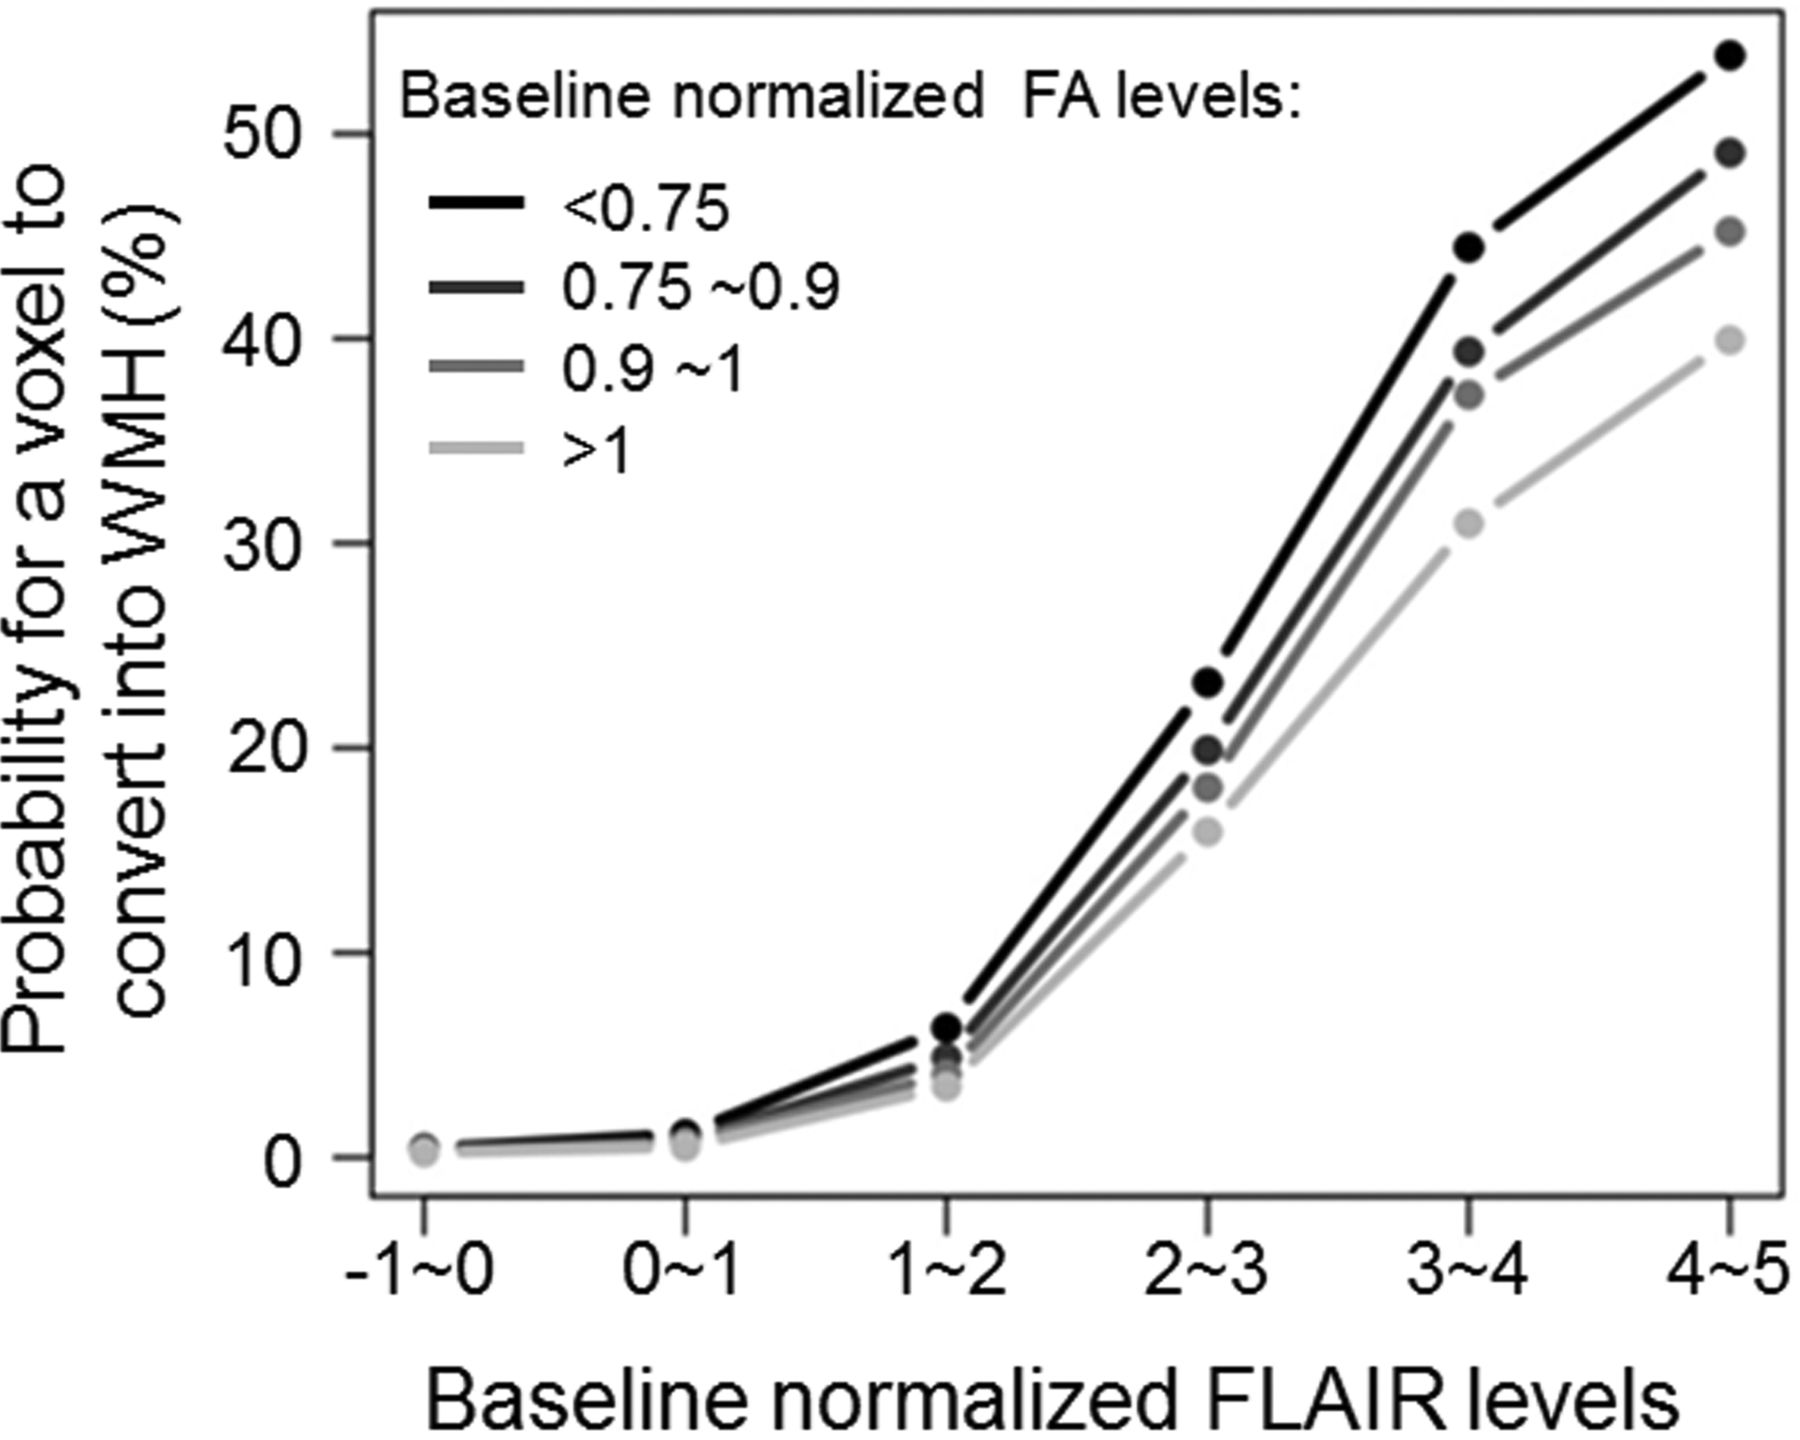
Figure 2 illustrates the probability for a baseline normal-appearing WM voxel to convert into WMH at follow-up within each pairing of baseline nFA and nFL strata as estimated by model 2. When the nFL stratum was added as a second predictor of WMH conversion risk in M2, the baseline nFA stratum remained a significant risk for conversion independent of the nFL stratum (Table 2). Stepwise increases in the baseline nFL stratum were significantly associated with stepwise increases in WMH conversion risk independent of the nFA stratum. Despite the fact that the impact of the nFL stratum on WMH conversion risk was orders of magnitude stronger than that of the nFA stratum, nFA stratum remained a significant risk for WMH in M2, suggesting an additive effect.

Risk of white matter hyperintensity incidence according to FA and FLAIR strata.
The baseline cognitive diagnostic was not found to interact with normalized MR imaging measures (P = .29 and P = .094 for baseline nFA and nFL strata, respectively), indicating that the strength of both associations relating baseline nFA and nFL strata and the risk for a voxel to convert into WMH at follow-up were not modulated by the clinical status of the subject.
Comparison of Models Including FA versus FA and FLAIR
Although the sensitivity of M1 for detecting novel WMH was higher than that of M2 (79% versus 60%), the specificity and accuracy measures were higher for M2 (80% and 68%) than for M1 (48% and 47%).
Spatial Distribution of Incident WMH for Each FA Stratum
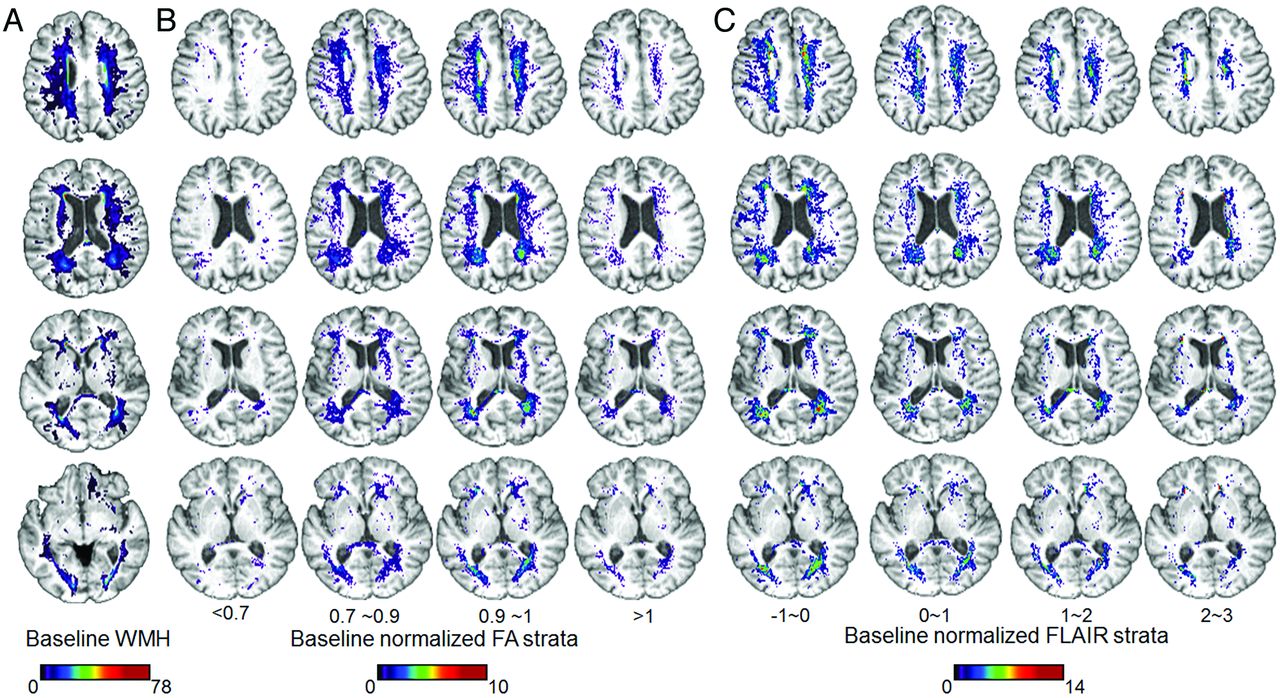
Figure 3A shows the average map of baseline WMH frequencies across all individuals. Figure 3B illustrates, for each nFA stratum, which of the voxels in MDT space had nFA values within that stratum at baseline and converted to WMH at follow-up. Figure 3C shows the analogous plot for each nFL stratum. The voxels that convert to WMH on follow-up are in very similar regions for all nFA strata and all nFL levels. None of the 4 nFA strata appreciably differ from the others in terms of which brain regions start out with that range of nFA values and convert to WMH; intuitively, the implicated regions are nearly identical to regions identified cross-sectionally as preferentially vulnerable to WMH.28,31 Thus, it is unlikely that nFA and nFL reflect benign regional variability in DTI-based and FLAIR measurements and that WMH occur randomly and independently of these; instead, this study suggests that dynamic changes to tissue in vulnerable areas, such as cerebral watershed areas, reflected in DTI and FLAIR signal changes, increase the risk of WMH.

Spatial distribution of baseline and incident white matter hyperintensity according to baseline normalized FA and FLAIR strata. Spatial distribution of baseline white matter hyperintensities (A) and incident white matter hyperintensity voxels at follow-up according to baseline normalized FA (B) and FLAIR (C) strata. Note that the maps for baseline nFL strata higher than 3 SDs above the mean were not displayed because there were very few voxels with nFL in these ranges that were not already classified as WMH at baseline.
Discussion
The present study used continuous measures derived from DTI and FLAIR as predictors of the course of WM change with time. These measures were obtained by normalizing FA and FLAIR images to correct for normally occurring spatial variability in FA and arbitrary scaling differences in FLAIR intensities across subjects. There were 2 key findings: First, stepwise decreases in baseline WM integrity according to both imaging modalities were associated with stepwise increases in the risk of incident WMH at follow-up, thus supporting the hypothesis that age-associated WM degeneration may be a progressive and continuously evolving process, with WMH constituting the most advanced stage. The second finding is that the baseline FLAIR level provides substantial complementary information to baseline FA for predicting incident WMH at follow-up.
WMH correspond to tissue damage, including ischemia/infarction, gliosis and rarefaction, loss of myelin, microglial infiltration, inflammation, and amyloid angiopathy. This tissue damage is likely to cause disconnection of functionally related cortical and subcortical structures that are important to cognitive functioning and that are often disrupted in dementia. Identifying new outcome measures of WMH evolution for clinical trials that seek to improve cognitive outcomes15,16 is therefore crucial. The emergence of DTI as a sensitive index of WM integrity indirectly raised the question of whether FLAIR may now be obsolete for WM injury characterization, especially because DTI measures correlate more strongly with cognition than WMH burden does.10,32 Our findings suggest that the dichotomization of the FLAIR signal into normal and abnormal ranges (ie, normal-appearing white matter or WMH) may be to blame for the relatively weak associations between FLAIR and cognition, as previously suggested.33,34
The evidence of a penumbra of WM injury in the so-called normal-appearing WM surrounding WMH17 supports the notion that WMH fail to capture the full degree and extent of WM injury. The current results extend this finding by demonstrating that much of the dynamic range of FLAIR signal values carry information about the risk of future WMH and thus about the underlying integrity of current WM. In future studies, therefore, FLAIR should be considered as a continuous index of WM health rather than a technique strictly relegated to defining WMH. FLAIR should also not be considered simply an inferior version of DTI, because FLAIR continued to contribute substantially to the prediction of WMH risk even when DTI measures were included in the model.
The signal intensity in FLAIR sequences is influenced by both T1 and T2 relaxation times. The T1 shortening in the FLAIR sequence reflects the fact that water is now in hydration layers around the myelin protein rather than in the bulk phase. T2 relaxation depends on the presence of static internal fields in the substance, generally due to protons on larger molecules. When T1 shortening occurs, the signal intensity of lesions, depending on whether the protons align with or against the main magnetic field, will be enhanced dramatically.35 In WM, the FLAIR contrast is indirectly determined by the attenuation of lipid protons within the myelin, but the histopathology of FLAIR hyperintensities can range from minor correlates, such as high levels in tissue water content, to more malignant correlates such as patchy rarefaction of myelin.36 WMH detected by FLAIR imaging, therefore, may vary in pathology from slight to severe so that the biologic meaning of a progressive change in the FLAIR measure requires further investigation. Nevertheless, the present study shows that incident WMH were more frequent in the watershed territories (Fig 3), implying an ischemic component in their genesis.
The possibility that combined FLAIR and DTI imaging can detect the full spectrum of vascular injury to cerebral white matter has direct clinical implications, particularly with regard to clinical trials aimed at the treatment of vascular risk factors to prevent vascular cognitive impairment, stroke, or mortality. In a recent observational study, WMH volumes increased more slowly among well-controlled hypertensives,37 suggesting the potential benefit of treatment. Unfortunately the power to detect a significant difference is relatively small, requiring large numbers of individuals in the study.38 Using continuous FLAIR imaging with or without DTI, therefore, could add substantial power to detecting treatment-related differences.
WMH segmentation from FLAIR is fundamentally about finding an optimal threshold between FLAIR intensities corresponding to normal-appearing WM and those corresponding to WMH, and even in the cleanest images, there may be a range of reasonable thresholds, each of which gives rise to segmentations that are more or less conservative. The threshold used to detect baseline WMH1 from the native FLAIR images might be considered too conservative. However, our method has been used for many years to report clinically relevant associations among risk factors, WMH, and cognition in a number of large-scale aging studies8,19,37,11,39,40; the reliabilities between raters, between scans, and between scanners are high.26 In addition, the effect of FLAIR intensity on the risk to convert to WMH was continuous and significant at values far below the threshold used to segment the images at baseline. To ensure that the threshold used to segment WMH (ie, ±3.5) did not affect results, we performed all analyses by applying thresholds to the normalized FLAIR images (±2.5 and 3), and the relations evidenced in the present study did not demonstrate significant changes (data not shown). Our conclusion, therefore, remains that FLAIR voxel intensities above the mean for white matter and FA values below the mean for white matter indicate subtle WM injury and voxels that are at significant risk for developing WMH during approximately a 4-year period.
While the annual rate of change in WMH volume was found to be associated with the baseline clinical diagnosis, the present study suggests that the strength of the prediction of the risk of WMH conversion by baseline normalized FA and FLAIR signal intensities was not modulated by clinical diagnosis. This finding suggests that the negative cognitive consequences of WMH are retained across the cognitive spectrum, making treatments to reduce the accretion of WMH potentially helpful, even in the setting of clinically relevant cognitive impairment such as MCI and dementia. These results should, nonetheless, be considered with some caution regarding the sample size of clinical groups, because most subjects in this study had normal cognitive ability. Studies including a larger number of individuals are needed to confirm this finding.
The objective of the present study was to explore whether only 2 measures of WM integrity at baseline could help to predict the risk of WMH conversion at follow-up. Although this work did not directly address an association between WMH progression and cognitive change, we believe the current study to be an important initial step in the process of understanding the impact of these changes on cognition. Now that there is evidence of areas of vulnerability, we can further examine the relationship between these areas of vulnerability and cognitive change either in the absence or presence of incident WMH. Should these areas of vulnerability prove to be related to cognitive decline, then medical treatment to rescue these areas could be the goal of future clinical trials.
Conclusions
This longitudinal study provides evidence that the WM injury process is continuous with time. The risk for a WM voxel to convert into WMH at follow-up increases continuously with continuous decrease in baseline WM integrity. FA and FLAIR provided complementary information for capturing the time course of WM degeneration and, therefore, have potential as biologic markers of vascular brain disease in clinical therapeutic trials.
Footnotes
Disclosures: Charles DeCarli—UNRELATED: Consultancy: Avid Pharmaceutical, Payment for Development of Educational Presentations: American Academy of Neurology Continuing Medical Education lectures.
P. Maillard drafted the manuscript, participated in study concept and design, and analyzed and interpreted the data. O. Carmichael revised the manuscript, participated in the study concept and design, and analyzed and interpreted data. D. Harvey participated in the study concept and design. E. Fletcher interpreted the data. B. Reed participated in the study concept and design. D. Mungas participated in the study concept and design. C. DeCarli revised the manuscript, participated in the study concept and design, and analyzed and interpreted the data.
This work was supported by National Institute on Aging grants AG10220, AG10129, AG 030514, AG031252, and AG021028 and by the California Department of Public Health Alzheimer's Disease Program contracts 06-55311 and 06-55312.
Indicates open access to non-subscribers at www.ajnr.org
References
- 1.
- 2.
- 3.
- 4.
- 5.
- 6.
- 7.
- 8.
- 9.
- 10.
- 11.
- 12.
- 13.
- 14.
- 15.
- 16.
- 17.
- 18.
- 19.
- 20.
- 21.
- 22.
- 23.
- 24.
- 25.
- 26.
- 27.
- 28.
- 29.
- 30.
- 31.
- 32.
- 33.
- 34.
- 35.
- 36.
- 37.
- 38.
- 39.
- 40.
- Received September 27, 2011.
- Accepted after revision February 8, 2012.
- © 2013 by American Journal of Neuroradiology