Abstract
BACKGROUND AND PURPOSE: Diffusion-weighted (DW) MR imaging is a useful technique for detecting ischemia. In adults and neonates, however, temporal changes on DW images after ischemia complicate interpretation. Our purpose was to investigate the temporal evolution of the apparent diffusion coefficient (ADC), diffusion-tensor (DT) imaging components, and anisotropy in neonatal brain after hypoxic-ischemic white matter injury and to determine which anisotropy index is preferable.
METHODS: DT images were obtained with single-shot echo-planar imaging, by using pulsed field gradients in six directions. Sixteen volunteers and 10 term neonates with normal MR images were evaluated to obtain reference values. Among the anisotropy indexes of fractional anisotropy (FA), relative anisotropy (RA), volume ratio (VR), linear (CI) and planar (Cp) diffusion, and axial anisotropy (Am), simulations were performed to select the most appropriate indexes for clinical practice. The ADC, DT imaging components, and anisotropy were evaluated as a function of time after onset of symptoms in 11 neonates with hypoxic ischemia.
RESULTS: In neonates, changes in lesions were characterized by a large decrease (40%) in all eigenvalues, with a stronger decrease in the direction perpendicular to the fibers, resulting in increased anisotropy indexes. The temporal evolution of the relative change in ADC did not show a significant trend (P > .05). The relative change in anisotropy decreased linearly with time (P < .05), with the strongest trend in anisotropy index Am.
CONCLUSION: In clinical practice, anisotropy indexes FA, RA and Am appear to be useful. Am is the best index to monitor anisotropy changes. DT imaging provides information about diffusion parallel and perpendicular to white matter fibers, which helps the interpretation of physiologic changes after hypoxic-ischemic injury.
Pathophysiologic changes due to perinatal hypoxic ischemia can result in structural and functional damage to the brain of the neonate, and detecting these changes in an early stage is important. Diffusion-weighted (DW) imaging has been applied successfully in the detection of ischemic injury; the apparent diffusion coefficient (ADC) decreases in ischemic areas to about 40–50% of its original value. This effect was first seen in animal studies (1) and later in human stroke studies (2) and in children with ischemic white matter injury as well (3–8). The decrease in ADC to about 50% of its original value occurs 3–6 hours before changes in T2 and T1 are visible and might reflect tissue at risk for damage (9, 10). The DW imaging technique and its quantitative ADC map are considered to be important tools for diagnosis of ischemia (9, 10).
Diffusion tensor (DT) imaging is an extension of DW imaging and measures diffusion in six or more directions to obtain information about the tissue structure, as the main direction of diffusion in white matter is assumed to coincide with the direction of the fiber bundle of axons (11, 12). The DT imaging information can be used to determine the main direction of diffusion by calculation of the eigenvalues and eigenvectors of the DT, and it can be visualized by using various visualization techniques, usually based on anisotropy indexes. Various anisotropy indexes exist to describe the ratio between the eigenvalues of the DT (11–14).
Compared with adult white matter, neonatal white matter is less structured and contains more water. This is reflected by a 30–50% higher ADC in neonates than in adults and by a 40–60% lower anisotropy. Both values depend on the gestational age (15–18). Anisotropy measurements are promising for the early detection of impaired brain development in neonates (17, 19).
The temporal evolution of the effect of ischemic changes on the ADC is quite well known from animal studies, as reviewed by Hoehn et al (20), but anisotropy changes have not often been taken into consideration. A limited number of studies have investigated the temporal evolution of anisotropy after ischemia in animal studies and in humans (21–23). The characterization of the temporal evolution is important to improve interpretation and diagnosis.
The first studies in neonates show that the time evolution of the ADC follows more closely the pattern of adult stroke than that of rodents (6, 8). However, to our knowledge, no data on the temporal evolution of anisotropy changes after neonatal brain injury are available yet. We hypothesized that differences in the temporal evolution of anisotropy between adults and neonates might occur due to the differences in brain development, myelination state, and pattern of injury.
Although many different kinds of anisotropy indexes exist, it remains unclear which index is most sensitive to detect changes in anisotropy in the neonatal brain. Among other characteristics, the anisotropy index in the neonatal brain should be sensitive to relevant changes in tissue structure, but insensitive to noise effects (24).
The purposes of this study were to investigate the temporal evolution of the ADC, the three eigenvalues of the DT, and the anisotropy in the neonatal brain after focal hypoxic-ischemic white matter injury and to evaluate which anisotropy index is preferable for the characterization of ischemic lesions in the neonate. In the process of selecting an appropriate anisotropy index, a study in adult volunteers and in neonates with normal MR images was performed to compare several well-known anisotropy indexes, and simulations were used to investigate the reliability and the sensitivity to noise of these indexes. Finally, the usefulness of the three most promising indexes for the detection of ischemic lesions in the neonatal brain was evaluated.
Methods
MR Imaging Protocol
A 1T whole-body system (Gyroscan; Philips Medical Systems, Best, the Netherlands) was used, with a gradient system that can reach a maximum gradient strength of 21 mT/m in each main direction. Besides the DT imaging series discussed below, the imaging protocol consisted of a spin-echo T1-weighted series (568/18 TR/TE), a turbo spin-echo T2-weighted series (4381/120), and an inversion-recovery series (3436/18/400 TR/TE/IR). The neonatal patients were sedated with chloralhydrate (50 mg/kg 1 hour before MR imaging and again 50 mg/kg 1/2 hour before MR imaging) and fixated by using a vacuum pillow. For all brain imaging, the standard birdcage head coil was used.
DT images were obtained by using pulsed field gradients in six directions with single-shot echo-planar imaging. Eighteen sections were recorded within 2 minutes (3595/94 TR/TE). The voxel size was 1.2 × 1.2 × 4 mm. The sensitivity to diffusion is expressed by the b value, as introduced by Stejskal and Tanner (25), which depends on the gradient strength G, gradient lobe duration δ, and time between the onsets of the gradient lobes Δ. Three b values (0, 400, and 800 s/mm2) were used to calculate the ADC, with δ = 20.06 ms, Δ = 40.5 ms, and G = 19.6 mT/m for b = 400 s/mm2 and G = 27.8 mT/m (by combining x, y, and z gradients) for b = 800 s/mm2. We chose to use lower b values than those used in the adult brain (typically 1000 s/mm2), because the ADC in neonatal white matter is higher than that in adults. The optimal b value was calculated as indicated by Jones et al (26).
Adult Volunteer Group
The volunteer group consisted of 16 healthy adult volunteers (eight men and eight women) between the ages of 18 and 47 years. All volunteers gave written informed consent for MR imaging measurements. The voxel size in the adult brain was 1.8 × 1.8 × 5 mm.
Neonatal Patient Group
The study group was recruited from a group of asphyxiated neonates born at term age with perinatal hypoxic-ischemic encephalopathy (HIE), who were treated in our neonatal intensive care unit (level 3). Perinatal hypoxic ischemia was diagnosed when clinical symptoms of neonatal encephalopathy were present in the first days of life together with two or more of the following risk factors: fetal heart rate abnormalities, umbilical artery pH less than 7.10, meconium stained fluid, APGAR score after 5 minutes of less than 7 (27). Included in our study group were neonates with focal white matter injury due to perinatal hypoxic ischemia. Excluded from evaluation were infants with congenital abnormalities, neurometabolic disease, or perinatal infection.
In total, 22 term neonates with HIE underwent DT imaging between July 2002 and November 2003 as part of a normal clinical examination. Parental informed consent was always obtained before the MR imaging. The data were evaluated retrospectively by two of the authors (J.B., G.F.R.).
Eleven neonates had focal white matter injury (one neonate was imaged at two different time points). All 11 included neonates born after an uneventful pregnancy; the onset of symptoms could be timed to the day of birth. The neonates had an average gestational age of 39.5 ± 1.6 weeks and were imaged within 10 days after birth. The white matter injury could be subdivided into an arterial infarct related to the asphyxia (n = 5), a typical pattern of asymmetrical multifocal lesions in the white matter as described by Volpe (28) (n = 4), or parasagittal infarcts, bilateral (n = 2).
Follow-up MR imaging studies (T1- and T2-weighted images) at the age of 3 months were available for eight of the 11 neonates. These data were evaluated by two of the authors (J.B., G.F.R.) to determine the extent of the injury. Neurodevelopmental examination was performed at 1 year (n = 7), at 6 months (n = 2), and at 3 months (n = 2). Infants with a follow-up at 3 months were included in the study only if a follow-up MR study at 3 months was available.
As we did not have a control group of healthy neonates, we obtained reference values from 10 full-term neonates who had clinical symptoms of asphyxia with Sarnat 1–2 in eight neonates, perinatal infection in one neonate, and persistent pulmonary hypertension in one neonate. All neonates had normal MR images (n = 7) or an MR image with only minor abnormality in the basal ganglia (n = 1), in the cerebellum (n = 1), or in occipital white matter (n = 1). Brain development and myelination in the frontal white matter was assessed to be normal by two of the authors (J.B., G.F.R.), based on T1- and T2-weighted images, and it was verified that no abnormality was visible on the DW images. All infants were developmentally normal at very short-term follow-up (2–3 months). Neurodevelopmental examinations were performed in seven of the 10 children, at the age of 1 year (n = 3), 6 months (n = 2), and 3–4 months (n = 2). These children were all neurodevelopmentally normal. For three children who were neurodevelopmentally normal at short term, long-term follow-up was not available.
The control group (n = 10) consisted of neonates born at term age (average gestational age, 39.3 ± 1.8 weeks).
Postprocessing, Image Analysis, and Statistics
ADC maps were calculated with the imager software. Detailed analysis of the DW imaging and ADC data and calculation of the eigenvalues, eigenvectors, and anisotropy indexes were performed by using Mathematica 4.2 (Wolfram Research, Inc., Urbana, IL). The three eigenvalues are called λ1, λ2, and λ3, from largest value to smallest value, respectively. The ADC parallel to the structure is reflected by λ1, and the ADC perpendicular by the average of λ2 and λ3 (11).
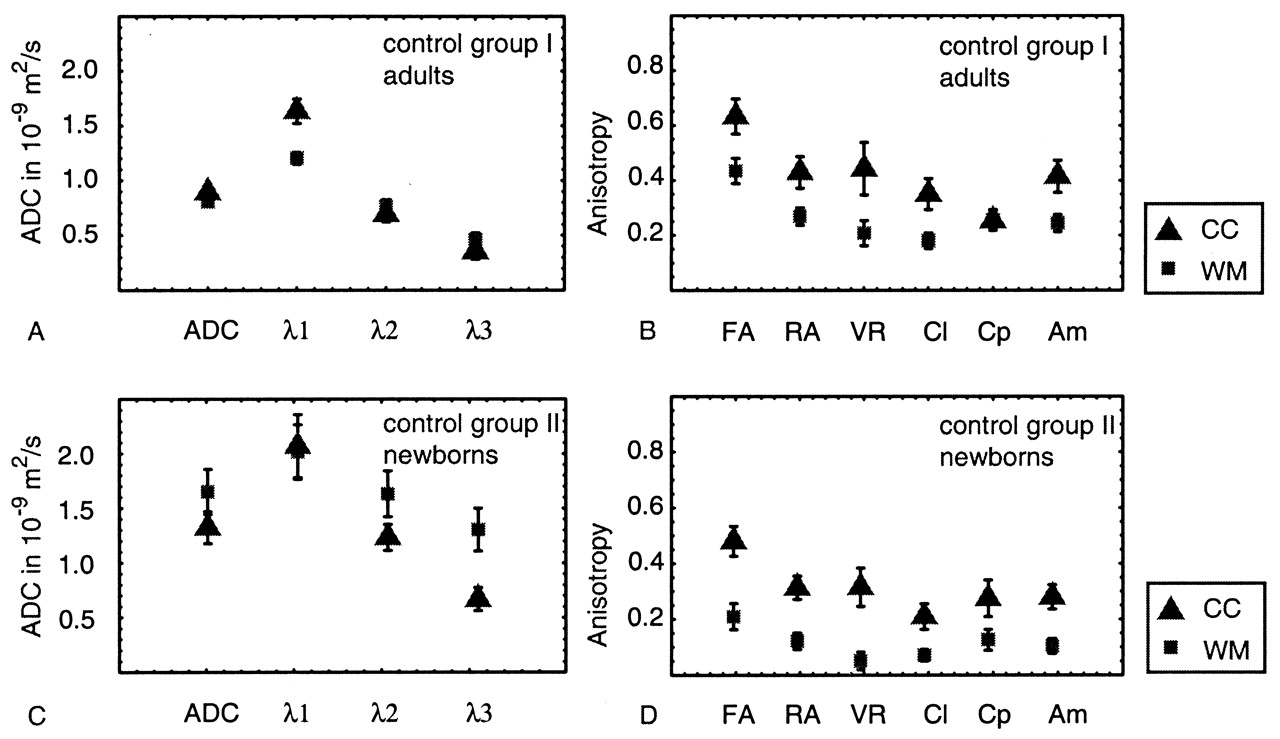
Normal ADC and anisotropy values in volunteers and neonates with a normal MR imaging study were evaluated in the corpus callosum and white matter (Fig 1). The corpus callosum was chosen because this is structure contains compact white matter, which has already completed a greater percentage of myelination compared with frontal lobe white matter, a non-compact white matter structure (29). The neonatal values were compared with the adult values by calculating the difference between both values divided by the adult value.

Definition of the regions of interest in the adult brain. 1 indicates corpus callosum; 2, white matter.
In neonates with white matter lesions, the largest lesion was selected, if reliable ADC and anisotropy calculation was possible and without artifacts in the region of the lesion. The region of interest was drawn manually around the lesion, following the boundary of the lesion but including only white matter, and had the same volume in the contralateral measurement. Most of the neonates in our study group had asymmetric lesions (n = 9), making contralateral measurements possible. The contralateral tissue was assessed to be normal, based on T1- and T2-weighted images. In two children, the injury was bilateral and in this case, the ‘contralateral’ measurement was obtained from normal-appearing white matter in a nearby region. The region of interest was used for ADC and anisotropy calculations.
The relative change in the lesion compared with the contralateral tissue, contra, was determined by the following equation:  The two control groups (adult volunteers and full-term neonates with normal MR images) were compared by using the Student t distribution to evaluate the hypothesis that the means of the two populations are equal.
The data points of the temporal evolution in the neonatal patient group with white matter injury were fitted by using a least squares fitting algorithm, and Pearson correlation coefficient was calculated by using Mathematica (Wolfram Research, Inc.). To determine whether a trend was significant, a Student t test was used (30). A test result with P less than .05 was considered to indicate a statistically significant difference.
Anisotropy Indexes
In the volunteer study, various anisotropy indexes were investigated (Table 1). The equations for all indexes are scaled to make isotropic diffusion 0 and anisotropic diffusion 1. Fractional anisotropy (FA) measures the fraction of the magnitude of the diffusion tensor that can be ascribed to anisotropic diffusion (11). Relative anisotropy (RA) is the normalized standard deviation (11). Volume ratio (VR) is the ratio of the ellipsoid volume to the volume of a sphere with radius λ = (λ1 + λ2 + λ3)/3 (14). In the linear and planar diffusion cases (Cl and Cp), as the names suggest, the index is high in regions where diffusion is linear or planar, respectively (31). Linear diffusion (CI) means that the diffusion ellipsoid is cigar-shaped; in this case the diffusion along the white matter fiber structure is much larger than that perpendicular to the fibers. Planar diffusion (Cp) means that the diffusion ellipsoid is pancake-shaped, which can occur in areas where fibers are crossing. Axial anisotropy (Am [also called Amajor]) is similar to Cl, but also takes λ3 into account (32). The concept of intravoxel indexes can be extended to intervoxel indexes, based on eigenvectors and eigenvalues of the reference voxel and adjacent voxels, for which lattice indexes are used, as introduced by Pierpaoli and Basser (13). However, due to the relatively low imaging matrix that we use (128 × 128), the lattice indexes suffer from partial volume effects. As the lattice indexes did not give reliable additional information in our clinical situation, their characteristics were not investigated further.
Equations for the anisotropy indexes evaluated in this study and the authors who introduced them
Visualization of Index Characteristics and Simulations
Eigenvalue Space Plots.
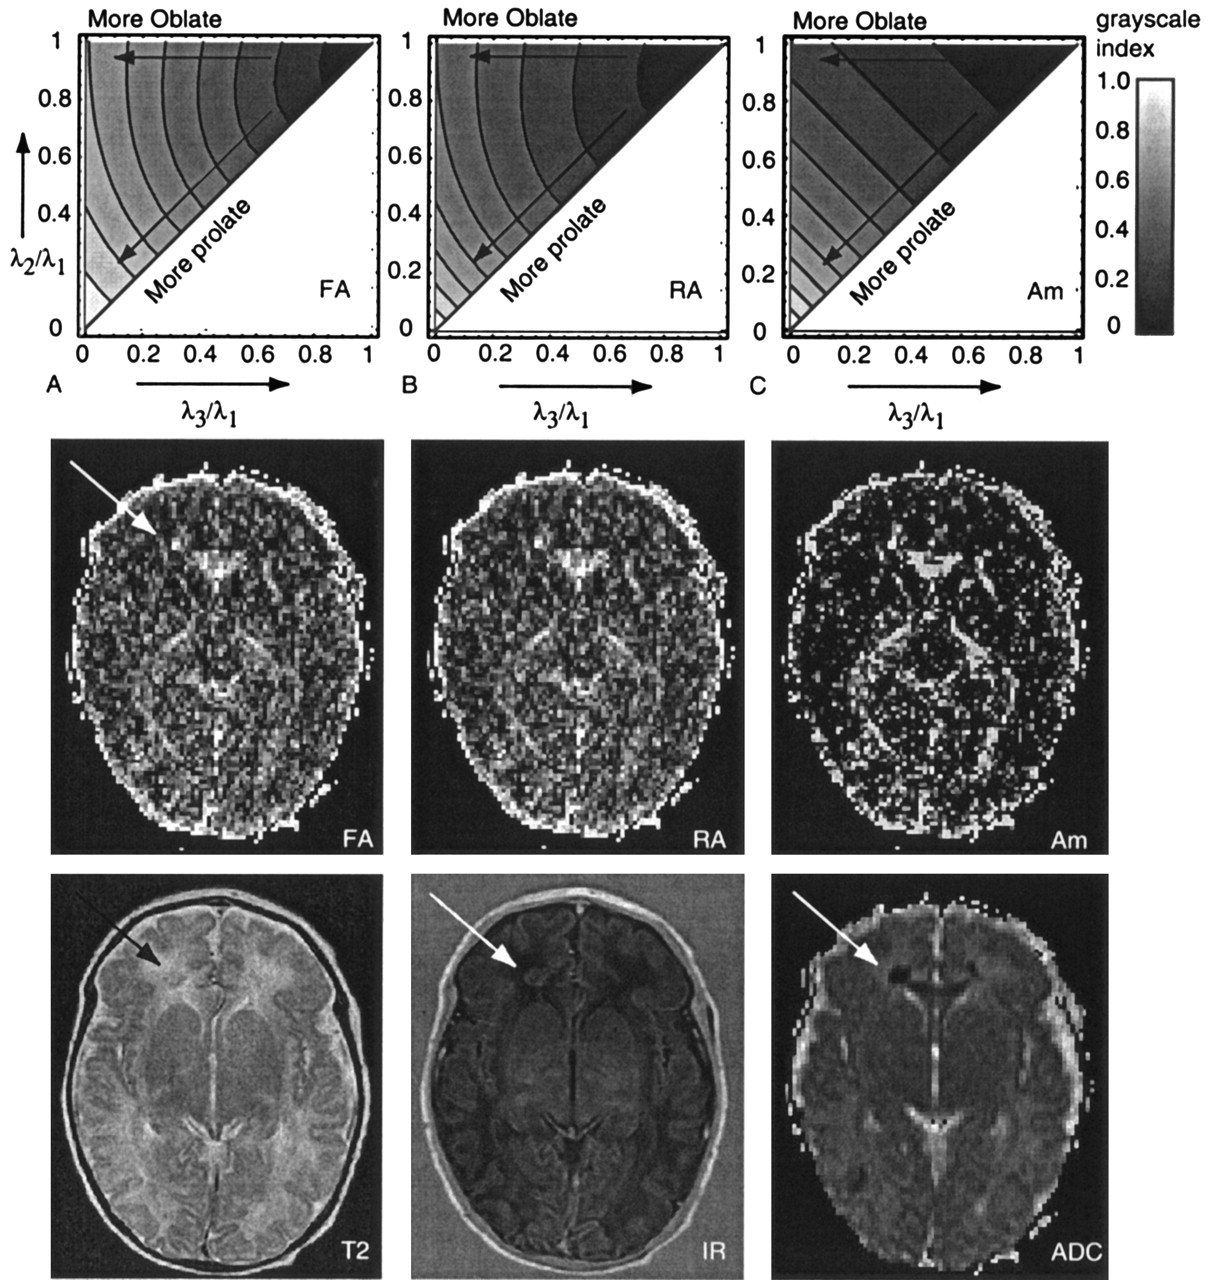
The intrinsic characteristics of each anisotropy index can be visualized by using normalized eigenvalue space plots, as introduced by Bahn (33). This method of visualization gives insight into the sensitivity of the investigated anisotropy index to linear (prolate or cigar-shaped) and planar (oblate or pancake-shaped) diffusion. For each index, this method was used to determine whether linear and planar diffusion could be distinguished from each other. More details on the eigenvalue space can be found in Bahn (33). The value of the anisotropy index under investigation was calculated as a function of λ3/λ1 and λ2/λ1 and displayed in corresponding gray level (Fig 2), as it is used in anisotropy maps. The combination of both a small λ2 and λ3 with respect to λ1 resembles a more prolate (cigar)-shaped diffusion ellipsoid, whereas the combination of a relatively small λ3 with a λ2 and λ1 in the same range means that the diffusion is more oblate (pancake) shaped.

Eigenvalue space plots as defined by Bahn (33), plotted for anisotropy index FA. FA is high (bright) for both λ3/λ1 and λ2/λ1 close to zero, which corresponds to a cigar-shaped diffusion ellipse. But FA is still relatively large for λ2/λ1 close to 1, the pancake-shaped diffusion ellipse.
Noise Simulations.
Because anisotropy values are known to be lower in the neonatal brain owing to the lower degree of myelination (18), it is important to know the noise sensitivity of each index. Numerical simulations were performed to estimate the accuracy of the diffusion scheme and postprocessing procedure, by using a similar method as introduced by Basser and Pajevic (34).
For several sets of eigenvalue and eigenvector distributions and two noise levels, the DT was calculated. The six ADC components (because of six pulsed field gradient directions) were determined. Gaussian-distributed noise was added to these ADC components, and next the noise-affected components of the tensor were calculated. They are the basis of the noise-affected anisotropy indexes. All calculations were performed in Mathematica (Wolfram Research, Inc.), and to obtain precise estimates of values derived from the calculated DT, the calculations were repeated 10,000 times.
The input eigenvalues shown in Table 2 are in the same range as the values that we found for white matter and corpus callosum in both neonatal and adult brain. Also, an isotropic case was simulated. The noise levels used were derived from water phantom measurements on our 1T system. The average signal-to-noise ratio (SNR) in the ADC maps of 18 measurements by using the adult protocol was 64 and by using the neonatal protocol it was 35.
Input eigenvalues for noise simulations
Sensitivity to Changes
In clinical practice, the changes in a parameter are usually expressed as the relative change with respect to the contralateral tissue; for example, the ADC after ischemia is decreased with about 50%. However, the sensitivity of these relative changes in each anisotropy index to changes in the eigenvalues is unknown. We visualized the relative change in the index (defined by the Change equation) as a function of a change in one of the eigenvalues (‘factor’ times the eigenvalue). In this way, it can be visualized that some indexes are more sensitive to changes than others. Three input eigenvalue sets were used: the settings for adult and neonatal white matter, as defined in Table 2, and a nearly isotropic situation, arbitrarily chosen with λ1 = 1.6 10−9 m2/s, λ2 = 1.5 10−9 m2/s, and λ3 = 1.4 10−9 m2/s. It is not possible to investigate an isotropic situation in this way, because a change in anisotropy would result in a division by zero.
Choice of Three Anisotropy Indexes
The three most promising anisotropy indexes to use in our clinical study were to be selected from the six indexes (Table 1) according to the following criteria: in our opinion, an anisotropy index should meet the requirements of 1) being sensitive to relevant changes in tissue structure, 2) showing good contrast between isotropic tissue (e.g., gray matter) and anisotropic tissue (e.g., white matter), 3) being distinguishable from noise, and 4) having a low interpatient variability relative to the average value.
Results
Volunteers and Neonates with Normal MR Images
Volunteers.
The average ADC, eigenvalues (λ1, λ2, λ3), and six anisotropy values in 16 volunteers are shown in Figure 3A and B, for corpus callosum and white matter. The difference between tissue in corpus callosum and frontal white matter can be clearly seen. The ADC parallel (λ1) was larger in the corpus callosum (1.63 ± 0.11 10−9 m2/s) than in the white matter (1.20 ± 0.06 10−9 m2/s), whereas for the ADC perpendicular, (λ2 + λ3)/2, no significant differences between corpus callosum and white matter were seen (0.52 ± 0.07 and 0.61 ± 0.06 10−9 m2/s, respectively). For most anisotropy indexes, the difference between corpus callosum and white matter was about 30%, although for the planar case (Cp), the index was the same for corpus callosum and white matter, which means that the planar component of the diffusion was the same in both regions. The error bars in Figure 3 show the standard deviation (variability) between subjects. The intervolunteer variability with respect to the average value was smallest for FA (10%) and largest for VR (22%).

A–D, Average ADC, eigenvalues, and anisotropy indexes in frontal white matter (WM) and in the corpus callosum (CC), measured in 16 adult volunteers (A and B) and in 10 full-term neonates with normal MR images (C and D).
Neonates.
In Figure 3C and D, the average values for neonates with normal MR images are shown. The average ADC in neonatal corpus callosum was 1.25 ± 0.13 10−9 m2/s and 40% larger than that in adult corpus callosum. The ADC in neonatal white matter was 1.58 ± 0.19 10−9 m2/s and 94% larger than that in adult white matter. The ADC parallel was about the same for corpus callosum and white matter (1.85 ± 0.24 and 1.94 ± 0.22 10−9 m2/s, respectively) and 14% and 61% larger than that in adult corpus callosum and white matter, respectively. The ADC perpendicular was smaller in corpus callosum than in white matter (0.95 ± 0.12 and 1.39 ± 0.18 10−9 m2/s) and 83% and 127% higher than that in adult white matter and corpus callosum, respectively.
The anisotropy in the corpus callosum was about 32–48% lower than that in adults for all indexes, except Cp (1%), whereas in the white matter, the anisotropy was about 47–53% lower for all indexes, except VR (70%).
As for the anisotropy indexes, the average value for FA was relatively large compared with other indexes and showed the smallest interpatient variability (15% in corpus callosum and white matter). Indexes with the highest interpatient variability were VR (up to 40% in white matter), Cl (27% in corpus callosum), and Cp (27% in corpus callosum).
Visualization of Index Characteristics and Simulations
Eigenvalue Space Plots.
One of the characteristics of an anisotropy index should be that the contrast between isotropic and anisotropic diffusion is large, as the main interest is the fiber structure in the white matter. The contrast is high if the index is sensitive to linear (cigar-shaped) diffusion. This can be visualized qualitatively by using the normalized eigenvalue space, as introduced by Bahn (33). The eigenvalue space is shown in Figure 4 for FA, RA, and Am. In the eigenvalue space plots, differences between FA and RA with respect to the sensitivity to the shape of the diffusion ellipse were small: the gray-scale patterns in the eigenvalue space were almost similar. Clear differences between the patterns of FA and Am were visible. The anisotropy index Am was high for prolate (linear) diffusion and low for oblate (planar) or isotropic diffusion, whereas FA and RA were already relatively high for oblate diffusion as well. This means that these indexes had a relatively high value in areas where fibers might be crossing.

A–C, Eigenvalue space plots, as introduced by Bahn (33) (explained in Fig 2), for FA, RA, and Am. In the middle row, the corresponding anisotropy maps are shown for a neonate with lesions (arrow) in the frontal white matter and occipital white matter. Note the increased anisotropy corresponding to the low ADC area. In the bottom row, T2-weighted image, IR image, and ADC map in the same neonate are shown.
The anisotropy maps for FA, RA, and Am in a neonatal patient with hypoxic-ischemic lesions are shown in Figure 4, together with their corresponding T2-weighted, IR-weighted, and ADC image. The largest lesion in the white matter, as indicated by the arrow, was evaluated in the patient study. The regions where only linear diffusion occurs can be best seen on the Am anisotropy map (Fig 4). On FA and RA maps (Fig 4), values with oblate (planar) diffusion also had brighter signal intensity.
Noise Simulations
It is important to distinguish true anisotropy from noise artifacts. Special attention to noise sensitivity was necessary, because we used a 1.0-T system, resulting in a relatively low SNR. The influence of noise on the anisotropy measurements was investigated by using simulations, with input values as discussed in Table 2. The results of the simulations are shown in Figure 5, for input values comparable to adult values (Fig 3) in Figure 5A and B and for input values comparable to neonatal values (and lower SNR) in Figure 5C and D. The error bars show the standard deviation of the 10,000 simulations. For the anisotropic case, no significant differences between the input value and the simulated values were observed, both for the adult case with high SNR and the neonatal case with lower SNR.

A–D, Results of simulations of the effect of random noise on ADC and eigenvalues (A and C) and anisotropy (B and D) for the adult case (A and B) and neonate case (C and D). Open symbols indicate the input values (Table 2); filled symbols, the values after noise was added. The error bars show the standard deviation of the simulated results.
For the isotropic case, however, the highest (λ1) and the lowest (λ3) eigenvalues deviate from their input value (110% and 91% of the input value, respectively, both for SNR = 64 and SNR = 35). This means that isotropic diffusion can be erroneously interpreted as anisotropic, which can be clearly seen for FA, which has the largest anisotropy for the isotropic case. However, the contrast between the ‘false’ anisotropy (‘iso’ case in Fig 5) and the simulated anisotropy in white matter is still large for FA. For all indexes except Cp, the white matter case still differed significantly from the ‘iso’-case (P < .05), although for Cl, it is hardly significant.
Sensitivity to Changes
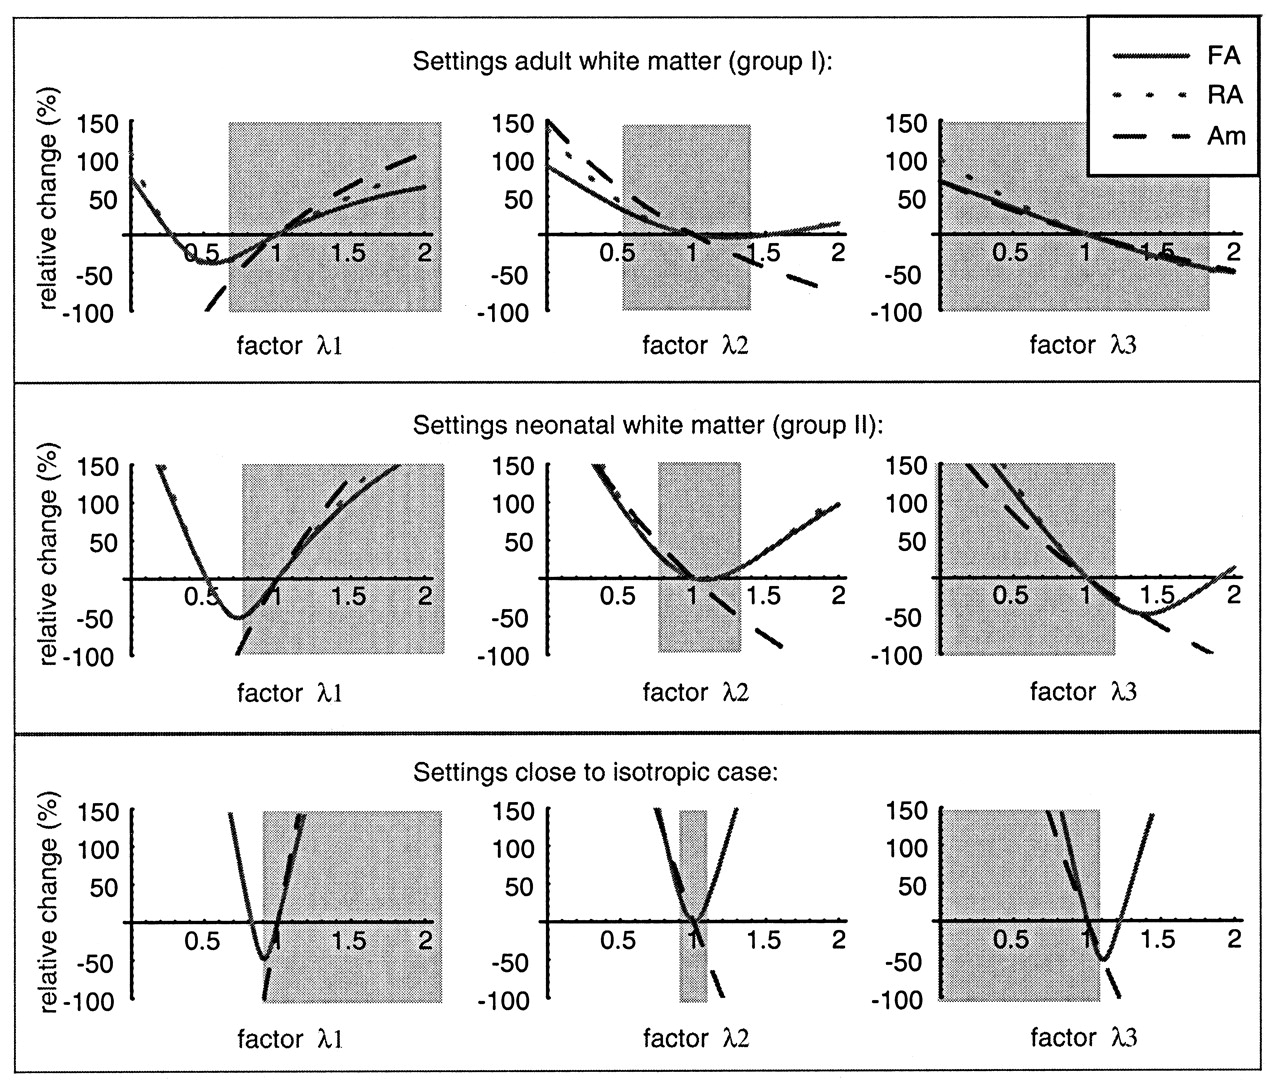
To be able to interpret the relative changes with respect to the contralateral tissue in an anisotropy index, the relative change (Change equation) was plotted as a function of changes in λ1, λ2, and λ3, defined by a ‘factor’ times the original value. This method of showing the sensitivity to changes was applied for three settings, corresponding to adult white matter, neonatal white matter, and settings close to the isotropic case. Showing all indexes would make the figure unclear, and therefore we have chosen to show only the sensitivity to changes in FA, RA, and Am. Note that the equations describing all indexes are only valid as long as λ1 > λ2 > λ3. In each graph, the gray box denotes the area in which the equations are valid (Fig 6).

Relative change in FA, RA, and Am as a function of a change in one of the eigenvalues λ1, λ2, and λ3. The change is defined as a factor times the original value; the factor is displayed on the x-axis. The relative change is shown for three input settings, corresponding to adult white matter (top row), neonatal white matter (middle row), and a case close to isotropic (bottom row). The gray area is the area in which the function is valid, that is where λ1 > λ2 > λ3.
For input settings corresponding to adult white matter (Fig 6, top row), the relative change in λ1 between 0.7 and 1.3 times its input value was close to a linear function of λ1, both for FA and RA, and also for Am but with a steeper slope. A decrease in λ1 to 85% of its original value (factor 0.85), without changes in λ2 and λ3, will result in a relative change of −16% in FA, −17% in RA, but a relative change of −26% in Am. For a decrease in λ2 with factor 0.85, the changes will be +7%, +8%, and +16%, for FA, RA, and Am, respectively. For a decrease in λ3 with factor 0.85, the changes were similar as for λ2 for FA and RA; only Am increased less (+9%).
In settings corresponding to neonatal white matter (Fig 6, middle row), it is directly clear that for this situation, each anisotropy index was much more sensitive, and relatively small changes in one of the eigenvalues already resulted in larger changes than in the adult white matter case: a decrease in λ1 to 85% of its original value (factor 0.85), now resulted in a relative change of −36% in FA, −37% in RA, and even −52% in Am. The index Am was still the most sensitive to changes.
For input settings even closer to isotropic, minor changes in one of the eigenvalues resulted in large changes in the relative change in anisotropy. The differences between the three anisotropy indexes became less pronounced the closer the input settings were to the isotropic case.
Choice of Three Anisotropy Indexes
An intermediate discussion is necessary, to select the three most promising anisotropy indexes to use in our clinical study, based on the criteria mentioned in Methods.
As requirement 1 will be investigated in the next section, all indexes were evaluated with respect to requirements 2–4, and the best three indexes will be selected for further use in the patient study.
First, anisotropic diffusion (e.g., in white matter) has to be distinguishable from isotropic diffusion (e.g., in gray matter). It can be concluded from Figure 3 that the value for VR in neonatal white matter is too low (0.06 ± 0.04) to be really distinguishable from isotropic (value 0). All other indexes differ significantly from zero in neonatal white matter (P < .05), although for Cl, P ≈ .05. Furthermore, the index should be sensitive to cigar-shaped diffusion and less sensitive to pancake-shaped diffusion, as the latter occurs in areas where fibers are crossing, which will make the interpretation of anisotropy and changes in anisotropy more difficult. From the analysis of the eigenvalue space plots, it can be concluded that only Am and Cl (the latter is not shown in Figure 4, but shows the same kind of gray-scale pattern) are sensitive to cigar-shaped and not sensitive to pancake-shaped diffusion. Cp is an index that is only sensitive to pancake-shaped diffusion and is therefore less useful in this study.
The noise sensitivity was evaluated by using numerical simulations (Fig 5), and it was shown that Cp in neonatal white matter could not be distinguished from the isotropic case anymore, and for Cl the difference of the simulated anisotropy in neonatal white matter from zero is hardly significant (P ≈ .05).
Finally, with respect to the interpatient variability, it was shown (Fig 3) that the highest interpatient variability with respect to the average value was found in VR, Cp, and Cl.
Therefore, the three indexes that performed best were FA, RA, and Am, and these were further investigated in the patient study to evaluate their performance in a clinical setting.
Neonatal Patient Study
First, the results of the absolute values in the lesion and the contralateral tissue as a function of time after asphyxia (at birth) are discussed for the 11 included neonates. However, as these data originate from different neonates and are not data as a function of time of one neonate, the relative change of the lesion compared with the contralateral tissue per patient is plotted as a function of the time and discussed in the second subsection.
Absolute Data.
In Figure 7, the measured absolute values of ADC, eigenvalues, and anisotropy indexes in 11 neonates with perinatal hypoxic ischemia (12 measurement points) are plotted as a function of time (in days after birth). Using a least squares fitting algorithm, we checked whether a trend in the data was present. The result is plotted only if the trend was significant (P < .05). The absolute ADC values in the lesions increased as a function of the time after the onset of symptoms (P = .02). The three eigenvalues (λ1, λ2, and λ3) in the lesion also increased as a function of time, but only for the second and third eigenvalues (λ2 and λ3) was the trend significant (P = .03 and .002, respectively). The trend in the lesion for λ3 was most pronounced. All three anisotropy indexes decreased as a function of time after the onset of symptoms (P = .008 for FA and RA and .007 for Am); only the slope is different. In the contralateral tissue, the anisotropy did not change with time (R2 ≈ 0).

Average absolute values for the ADC (top image), the three eigenvalues λ1, λ2, and λ3 (middle row), and the three anisotropy indexes FA, RA, and Am (bottom row) as a function of time after the onset of symptoms for neonates with a white matter lesion.
Relative Data.
The relative change, the ratio between the values in the lesion and values in the contralateral tissue, as defined in the Change equation, is shown in Figure 8 for the 11 neonates with hypoxic-ischemic white matter injury. The ADC is largely decreased after the insult, and the relative change increases with time, but the trend is not significant (P = .3). As shown in Figure 8B, the third eigenvalue λ3 was more decreased during the first days after ischemia than were λ1 and λ2 (i.e., at day 2, λ3 decreased by 68%, λ2 by 58%, and λ1 by 46%), and λ3 increased more rapidly than λ1 and λ2. Only the trend in the relative change in λ3 was significant (P = .03, compared with .7 for λ1 and 0.20 for λ2).

A–C, Time evolution of the relative change (Change equation) in ADC values (A), the three eigenvalues (B), and the anisotropy indexes FA, RA, and Am (C) after hypoxic-ischemic brain injury in neonates. Trend lines are shown only if the trend was significant (P < .05).
The anisotropy in the lesion was increased compared with the contralateral tissue after the infarct and decreased toward normal within the next 10–11 days. The trend in the relative anisotropy change was most pronounced in Am, but for all indexes, the correlation coefficient was about the same (0.52–0.55) and significant (P = .006 for FA and RA and .002 for Am).
Follow-up
In eight of the 11 neonates, a follow-up MR image was obtained at the age of 3 months. In six infants, (severe) tissue loss or signal intensity abnormalities were observed in the region of the lesion, with abnormalities in the basal ganglia in two infants, and mildly to moderately delayed myelination in four and normal myelination in two. In both infants without abnormalities in the region of the infarct, myelination was delayed.
Clinical follow-up showed severe neuromotor and mental delay in three children, cerebral palsy in two, and visual impairment in one child. Normal development was observed in two children at the age of 1 year, in one at the age of 6 months, and in two at the age of 3 months.
Discussion
Choice of Three Anisotropy Indexes to Use in the Patient Study
From the results of the volunteer study, the neonatal study, and the simulations, the three anisotropy indexes that are most likely to be useful in clinical practice for neonatal brain studies are the FA, RA, and Am. The advantage of the first two, besides the fact that both are already often used, is that the intervolunteer variability relative to the average value was low, compared with the other indexes (15% and 16% in neonatal white matter). The advantage of Am (with interpatient variability of 17% in white matter) is that this index was sensitive to linear diffusion and not sensitive to planar diffusion. This means that areas with crossing fibers, in which planar diffusion occurs, are not detected with this index.
Differences Between Neonates and Adult Volunteers
One of the main differences between the neonatal and adult brain is that in the former the white matter is less myelinated and structured and the brain contains more water, which is reflected by the higher ADC and lower anisotropy.
In the neonatal brain, the first eigenvalue (λ1), which is said to reflect the diffusion parallel to the white matter fibers (11), was the same in white matter and corpus callosum and higher (61% and 14%, respectively) than that in adults, where λ1 was smaller in white matter than in corpus callosum. The values for the perpendicular diffusion were higher in the white matter than in the corpus callosum in neonates, and also larger than that in adults (by 127% and 83%, respectively) where the values in corpus callosum and white matter were comparable. The anisotropy in both white matter and corpus callsoum in neonates cannot be explained by myelin, as both are not myelinated at birth (28). The anisotropic diffusion in both structures might be due to the early wrapping of axons by oligodendroglial processes, as suggested by Hüppi et al (16). The higher anisotropy in the corpus callosum can be explained by the fact that it is a compact structure with a higher density of fibers than in the white matter (29).
The effective diffusion coefficient is assumed to be composed of at least two components, the effective intracellular and the effective extracellular diffusion coefficient; both coefficients are called ‘effective’ because they also contain exchange characteristics (35–37). In axons surrounded by myelin, the exchange processes are considered slow (38).
A large difference between parallel and perpendicular diffusion, especially in the corpus callosum of adults (1.63 ± 0.11 and 0.52 ± 0.07 10−9 m2/s), was observed. If only the effective extracellular diffusion coefficient would show anisotropic behavior, the difference between the parallel and the perpendicular ADC would not be this large, given the normal tissue typical volume fractions of 0.8 in the intracellular space and 0.2 in the extracellular space. Therefore, it suggests that the effective intracellular diffusion is affected by membrane restrictions and is already anisotropic, although a soundly based explanation is not available, as the exact reason for diffusion anisotropy itself is still a subject of discussion (39). Membranes are considered to form the first restrictions, as anisotropy is already observed in the neonatal cerebrum before myelination (15, 18, 40), and myelination increases diffusion anisotropy (15, 41). The influence on the anisotropy of intracellular structures, like microtubules and neurofilaments, and of microflow have been shown to be negligible in large (single) neurons, where diffusion is isotropic in the center (39, 42, 43). However, no data are available on their contribution in human axons, although the contribution of microflow is small on time scales of diffusion measurements.
In neonates, both the ADC parallel to the fibers and the ADC perpendicular to the fibers are larger than those in adults. As the brain develops, the diffusion perpendicular to the white matter fibers will decrease due to increased myelination. The decrease in parallel diffusion may originate from changes in cell density, intracellular structure of the axons, and decrease in overall water content in the brain during development (18). The average ADC in our term group (1.58 ± 0.19 10−9 m2/s) was larger than that in the full-term group studied by Hüppi et al (1.2 ± 0.1 10−9 m2/s), but in the same range as values found by Neil et al (1.45 ± 0.12 10−9 m2/s) and Tanner et al (1.62 ± 0.16 10−9 m2/s) in the frontal white matter in term neonates (15, 18, 44). The differences in ADC values between our study and other studies can be due to the use of a different DW imaging measurement technique. However, we cannot exclude small ADC abnormalities in our normal term group due to small disturbances in white matter tissue, which have not been observed directly on the conventional T1- and T2-weighted images, although these children had a normal MR image and a normal outcome.
The interpatient variability was much larger in the neonatal group than in the adult group. This most probably has several reasons. First, the global development of the white matter structure might have been delayed, as mentioned above. Second, both the ADC and anisotropy depend on gestational age, and the relatively large standard deviation in gestational age of the neonates can also cause a larger interpatient variability on the ADC and anisotropy indexes. The relative interpatient variability compared with the average value in the neonatal group was smallest for FA (15%).
Decreased ADC and Increased Anisotropy in the Initial Stage After Ischemia
Directly after the insult, the ADC in neonates was largely decreased and all three anisotropy indexes were significantly increased; the same was found in adult stroke studies (21, 22, 45). In our study in neonates, a relative change in the parallel ADC (λ1) by about −50% was observed in the first days after the insult and a relative change in the perpendicular ADC (λ2 and λ3) by −60% to −70%.
Several mechanisms have been proposed to explain the reduction in the ADC in the initial stages of ischemia. Ischemic cell swelling (glial or neuronal) due to cell membrane dysfunction is observed histologically and correlates with a decreased ADC (46, 48, 49). It causes the water molecules to migrate from the extracelluar space with a high diffusion coefficient into the intracellular space with a lower diffusion coefficient, causing a net decrease in ADC due to changes in the volume distribution combined with an increase in extracellular tortuosity (1, 49, 50), although some argue that both intracellular and extracellular spaces have the same diffusion coefficient (51). The large decrease, especially in parallel diffusion, in our study cannot be explained by the water redistribution alone, and a decrease in intracellular diffusion coefficient is likely to occur at the same time, in correspondence to measurements of changes in diffusion coefficients of metabolites after ischemia (52–54).
In most studies of ADC changes, the typical changes in anisotropy are not taken into account. If the relative decrease in all eigenvalues would be the same, the anisotropy would not change, as was seen in patients after stroke by Green et al (55) by using so-called p-q diagrams. In our study, the ADC perpendicular to the fibers was more decreased than the parallel ADC in all patients, causing the anisotropy to be increased. Changes in intracellular diffusion (i.e., by viscosity changes) as suggested by Sehy et al (56) would be the same for molecules diffusing along the fibers and those diffusing perpendicular to the fibers, and cannot cause the extra decrease perpendicular to the fibers (and corresponding increase in anisotropy after ischemia). Changes in the effective diffusion coefficient of the extracellular space due to increased tortuosity may account for the larger change in perpendicular diffusion compared with parallel.
Yang et al (22) observe an increase in FA by 15–20% in adults. We found a larger increase in neonates (i.e., 25%) at day 2 for FA and even higher values for RA and Am. The value of the relative change in anisotropy depends on the anisotropy index that is used and on the anisotropy (and eigenvalues) of the tissue before ischemic changes, as seen in Fig 6. Therefore, these values for the relative change in anisotropy cannot be directly compared.
Time Evolution of ADC and Anisotropy in Neonates
In general, within the first hours after the onset of ischemia, the ADC decreases to about 50–60% of its original value and the anisotropy increases (21–23, 45). The ADC remains decreased during the first days, whereas the time evolution of the anisotropy is less clear: in the animal model, the anisotropy decreases below its original value within several hours (23), whereas in humans both decreased and increased anisotropy is measured (21, 22). After several days, when cellular breakdown occurs and extracellular edema develops, the ADC passes the pseudonormalization point and is increased for several weeks, whereas the anisotropy decreases and remains decreased. The ADC normalization is seen at a later point in time in humans than in animal studies and is still a subject of discussion (10, 57).
Although anisotropy in the neonatal brain is lower than that in the adult brain, with a higher interpatient variability, relative changes in all three anisotropy indexes can be used to characterize white matter lesions in addition to the ADC values as shown by our data. The changes in ADC and anisotropy show overall the same trend as in the adult brain after stroke (21, 22), but the relative changes in neonatal white matter are larger. This difference results from the fact that the anisotropy in white matter tissue is much larger in adults than in neonates, causing the anisotropy index to be less sensitive to changes in the adult white matter than in the neonatal white matter (Fig 6).
The trend in relative ADC change in our study (Fig 8) was less pronounced than in adult stroke data. In our data (up to 9 days), pseudonormalization of the ADC was not seen, whereas McKinstry et al (8) found pseudonormalization of the ADC between days 7 and 8 in neonates. However, we did not have serial measurements in time of the same neonate. We did not find a significant trend in the relative ADC change, the same findings as found by Forbes et al (6) for ADC changes in cortical injuries in neonates. In the absolute ADC data, however, the trend in the ADC in the lesion was significant (Fig 7).
One of the limitations of our study is that the contralateral tissue might be affected as well, as global hypoxia is known to reduce the ADC in the whole brain during hypoxia (58). However, no significant difference between the ADC in the contralateral measurements and the normal control group was observed.
The trend in the absolute values of the three eigenvalues is only significant for changes in λ2 and λ3, the diffusion perpendicular to the fibers. As no significant trend in λ1 could be found, we conclude that the ADC parallel to the fibers remains decreased in the first 10 days, whereas the ADC perpendicular to the fibers increases, resulting in a decrease in anisotropy. We hypothesized that the increasing ADC perpendicular to the fibers can be assigned to membrane degradation and injury to the oligodendroglial processes in the premyelination phase, which result in a lower tortuosity of the extracellular space.
The almost linear increase in the perpendicular diffusion coefficient results in the even more pronounced trend in the relative change in anisotropy: the initial increase in anisotropy is seen to decrease almost linearly with time, heading toward pseudonormalization between days 10 and 11. As discussed earlier, we hypothesized that the almost linear changes in anisotropy are related to changes in the membrane and the integrity of the axonal oligodendroglial complex.
Differences between temporal evolution in adult stroke and neonatal brain injury due to perinatal complications are likely due to the differences in injury mechanisms as suggested by Neil et al (18) and McKinstry et al (8): adult stroke is a thromboembolic disease, whereas in neonates, reperfusion will start directly after injury. Another cause for differences might be that the complications occur in not fully developed brain tissue.
Usefulness in Clinical Practice
In our study, the DW images and ADC maps are important, as more (small) lesions can be diagnosed than with only T1- and T2-weighted images. An example of a patient in whom the ADC map displays the lesion more clearly than the T1- and T2-weighted images is shown in Fig 4. The importance of finding these lesions for the prognosis of the child is still a subject of investigation. In general, the usefulness of the ADC has been recognized in other studies, as reviewed by Neil et al (18). The added value of the anisotropy information has to be further evaluated. Studies by Hüppi et al (17) and Miller et al (19) have shown that anisotropy measurements are promising for the early detection of impaired brain development in neonates. Our data indicate that for further understanding of the temporal evolution after ischemia, the eigenvalues give additional information that might be useful for the interpretation of structural tissue changes. In addition, the anisotropy index seems to be a good indicator that might be useful for timing of the lesion in cases in which the onset of the insult is not known.
Conclusion
Based on measurements in volunteers, neonates with normal MR images, and numerical simulations, three anisotropy indexes were selected to test their usefulness in clinical practice: FA, RA and Am, as the intervolunteer variability relative to the average value was low for FA and RA, and Am was sensitive to linear diffusion and not sensitive to planar diffusion.
All three indexes can be used in clinical practice to observe the temporal evolution of anisotropy after the onset of symptoms; the index Am shows the strongest trend in relative changes. Therefore, we conclude that Am will be the best index to monitor changes in anisotropy with time after symptoms.
We observed that all three anisotropy indexes respond differently to changes in one of the eigenvalues, and that the value of the relative changes depends not only on the chosen index but also on the anisotropy of the tissue under investigation. This is the reason that the relative change in anisotropy after stroke in adults is smaller than the relative change in anisotropy observed in neonates.
The changes after ischemia are characterized by a large decrease in all eigenvalues (>40%), with an even stronger decrease in perpendicular diffusion than in diffusion parallel to the fibers. This decrease can only be explained if, besides the shift from extracellular water into the cell and increased tortuosity of the extracellular space, also the intracellular diffusion decreases. The temporal evolution of the ADC after the insult did not show a significant trend in neonates in our study (P > .05), in contrast to studies in adults (21, 22), but the trend in anisotropy changes was more pronounced than in the ADC and was significant (P < .05). The trend in anisotropy is governed by changes in the diffusion perpendicular to the fibers, which we assign to changes in membrane and myelin integrity.
References
- Received February 9, 2004.
- Accepted after revision June 14, 2004.
- Copyright © American Society of Neuroradiology