Abstract
Summary: We report the case of a 9-month-old boy with Sturge-Weber syndrome and new onset of seizure. Perfusion MR imaging showed early changes compatible with impaired venous drainage in the affected hemisphere, whereas proton MR spectroscopic imaging revealed a focal parietal area of elevated choline without significant alteration of N-acetylaspartate levels. The perfusion and subtle metabolic abnormalities are comparable with the extent of the overlying leptomeningeal enhancement, illustrating the early pathophysiological manifestation of this disease.
Sturge-Weber syndrome is a neurocutaneous syndrome characterized by port wine stain (facial nevus flammeus), congenital glaucoma, and underlying anomalous leptomeningeal venous plexus and the lack of normal cortical venous drainage (1). It has been postulated that venous stasis results in hypoperfusion of the subjacent brain parenchyma, progressively insufficient to meet metabolic demands, particularly in the presence of seizures (1, 2). In this case report, the use of MR perfusion imaging and proton MR spectroscopic imaging for the evaluation of cerebral perfusion and metabolism in early Sturge-Weber syndrome is described.
Case Report
A 9-month-old African-American male infant who was born with left facial port wine stain and ipsilateral congenital glaucoma had undergone glaucoma surgery at 5 months of age. He was referred for MR imaging evaluation because of new onset of focal motor seizures 3 weeks previously that consisted of tonic-clonic activities of the right upper and lower extremities. He showed no weakness or developmental delay at the time of this study.
MR Imaging Methods and Techniques
Deep sedation was achieved with 1000 mg (100 mg/kg) of chloral hydrate supplemented by 50 mg of Benadryl, with continuous monitoring by the nursing staff. MR images included sagittal T1-weighted (350/10/1 [TR/TE/number of excitations]), axial T2-weighted (4000/100/1), fluid-attenuated inversion recovery (8800/130; inversion time, 2200 ms), and coronal T2-weighted images.
Spin-echo proton MR spectroscopic imaging (1700/282/1) was performed with three 15-mm axial sections from the midbrain to the centrum semiovale (3). Nominal voxel size was 0.8 cm3 (4). Metabolic map of choline, creatine, N-acetylaspartate, and lactate were reconstructed.
MR perfusion-weighted imaging with gradient-echo echo-planar imaging (2000/60; flip angle, 90 degrees; number of phases, 30) was acquired dynamically after a hand bolus injection of 2 mL (0.1 mmol/kg) of gadolinium contrast agent. Maps of regional cerebral blood volume, regional cerebral blood flow, mean transit time, and time to peak were reconstructed based on first pass dynamics.
Results
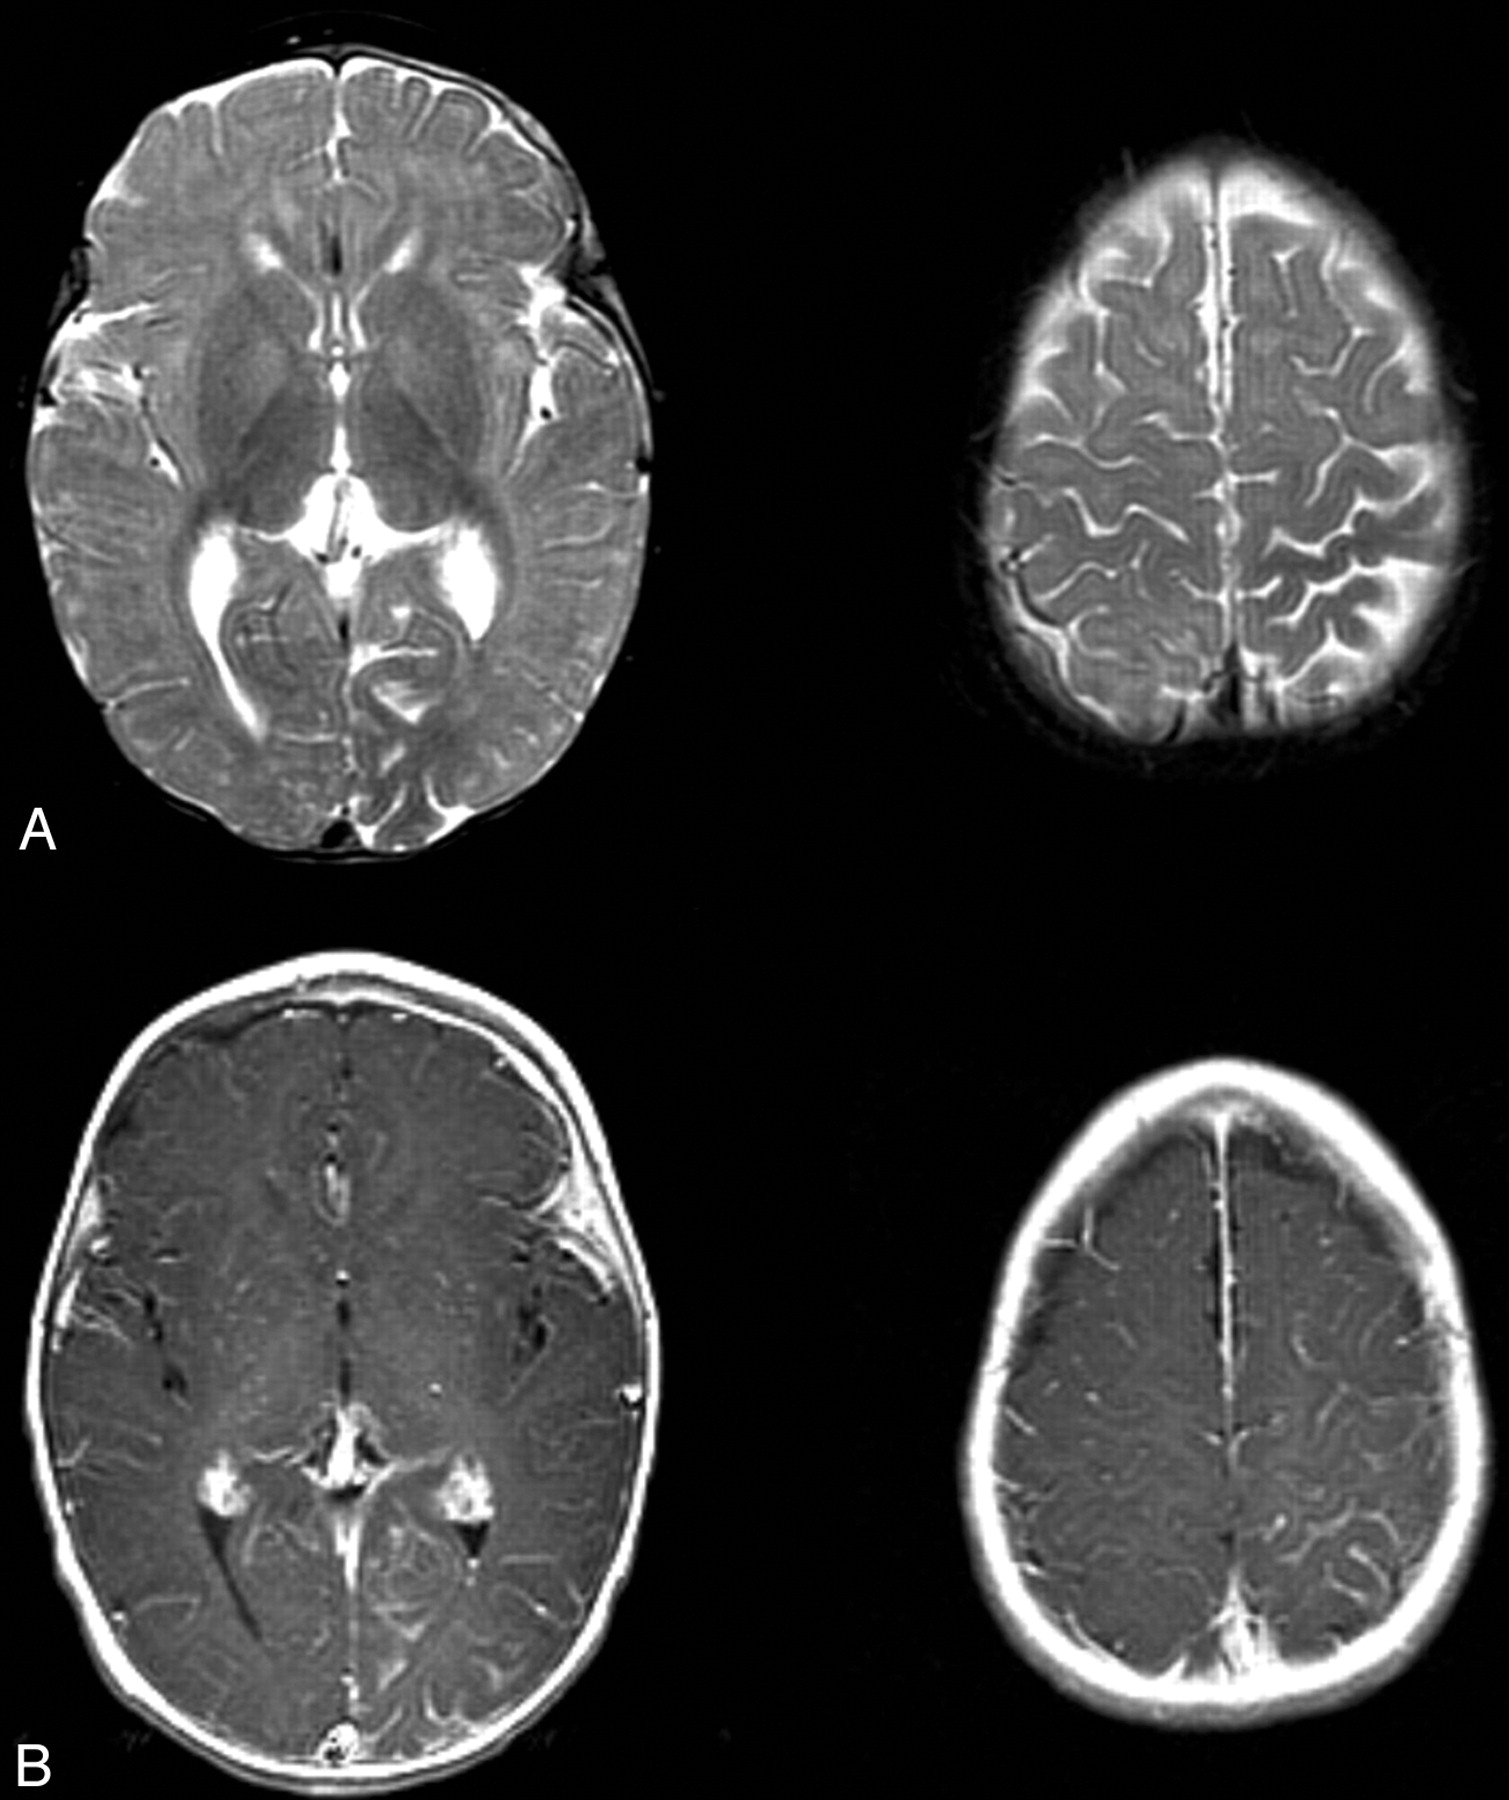
T2-weighted MR images showed mild parenchymal volume loss of the left cerebral hemisphere, most pronounced in the parietal and occipital lobes. Contrast-enhanced T1-weighted MR images showed prominent leptomeningeal enhancement of the left parietal and occipital lobes, particularly the medial occipital and high parietal regions (Fig 1). These findings were consistent with Sturge-Weber syndrome with leptomeningeal angiomatosis. It was also noted that white matter adjacent to the areas of leptomeningeal enhancement showed relative T2 hypointensity compared with the contralateral regions (Fig 1A).

T2- and contrast-enhanced T1-weighted images from the case of a 9-month-old male patient with Sturge-Weber syndrome and new onset of seizure.
A, Axial T2-weighted images show mild parenchymal volume loss involving the left parietal and occipital lobes and decreased signal intensity in the subcortical white matter underlying the area of leptomeningeal enhancement seen in B.
B, Axial contrast-enhanced T1-weighted images. Leptomeningeal enhancement is most marked in the left parietal lobe and medial occipital lobe.
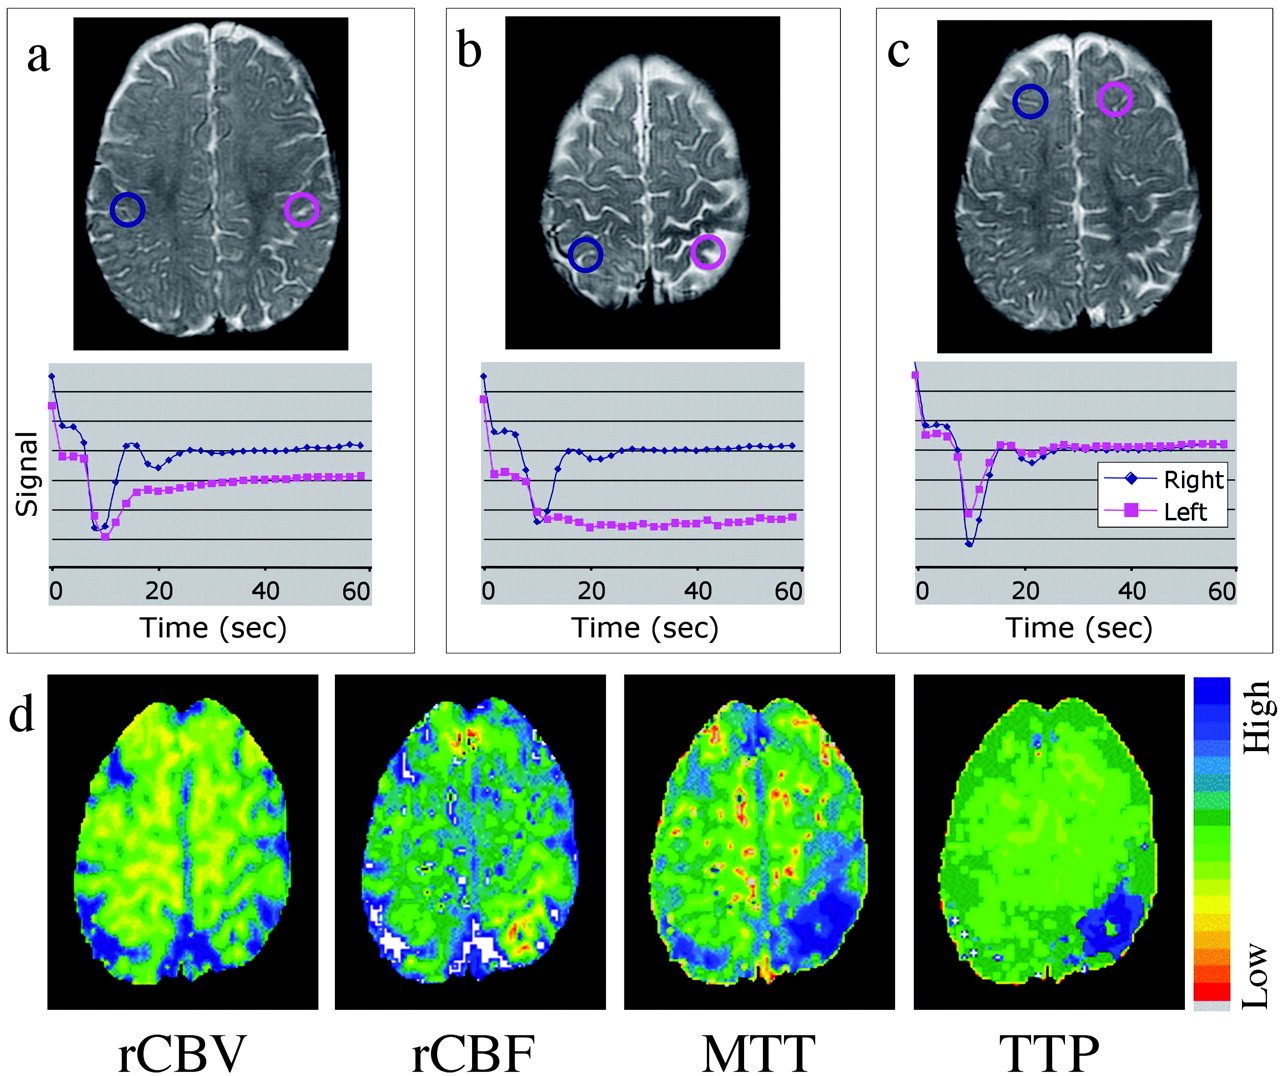
Mean transit time and time-to-peak maps showed delayed and diminished perfusion to the left parietal and occipital lobes (Fig 2). Two patterns of perfusion abnormality were observed. An extensive area of the left parietal lobe approximately corresponding to leptomeningeal enhancement showed normal bolus arrival but protracted recovery phase, indicating delayed clearance of contrast material, suggestive of impeded venous drainage (Fig 2A). Second, confined to the high left parietal cortex where the perfusion abnormality is most prominent (as shown on mean transit time and time-to-peak maps), both arterial and venous phases seemed impaired (Fig 2B) (lesion mean transit time 24.9 ± 1.5 s compared with 13.7 ± 1.5 s in the contralateral hemisphere, lesion time-to-peak 37.0 ± 5.6 s compared with 13.0 ± 3.6 s contralaterally). Regional cerebral blood flow showed similar areas of diminished flow in the left parietal and medial occipital lobe. Regional cerebral blood volume was nearly symmetric in both hemispheres but showed a tendency for a mild increase in the vicinity of the lesion (Fig 2D).

T2-weighted images, time-series curves, and parameter maps generated from the same contrast-enhanced T2*-weighted perfusion image.
A, Time-series plot from contrast-enhanced T2*-weighted perfusion study shows delayed recovery phase, reflecting impaired venous drainage in the left parietal lobe.
B, Time-series plot shows delayed bolus arrival and protracted recovery, indicating arterial and venous perfusion abnormality more focally in the high left parietal cortex.
C, Symmetric time-series curves in the unaffected frontal lobes.
D, Parameter maps of regional cerebral blood flow, mean transit time, and time-to- peak show decreased flow and increased transit time in the same region. A very mild increase in regional cerebral blood volume is noted.
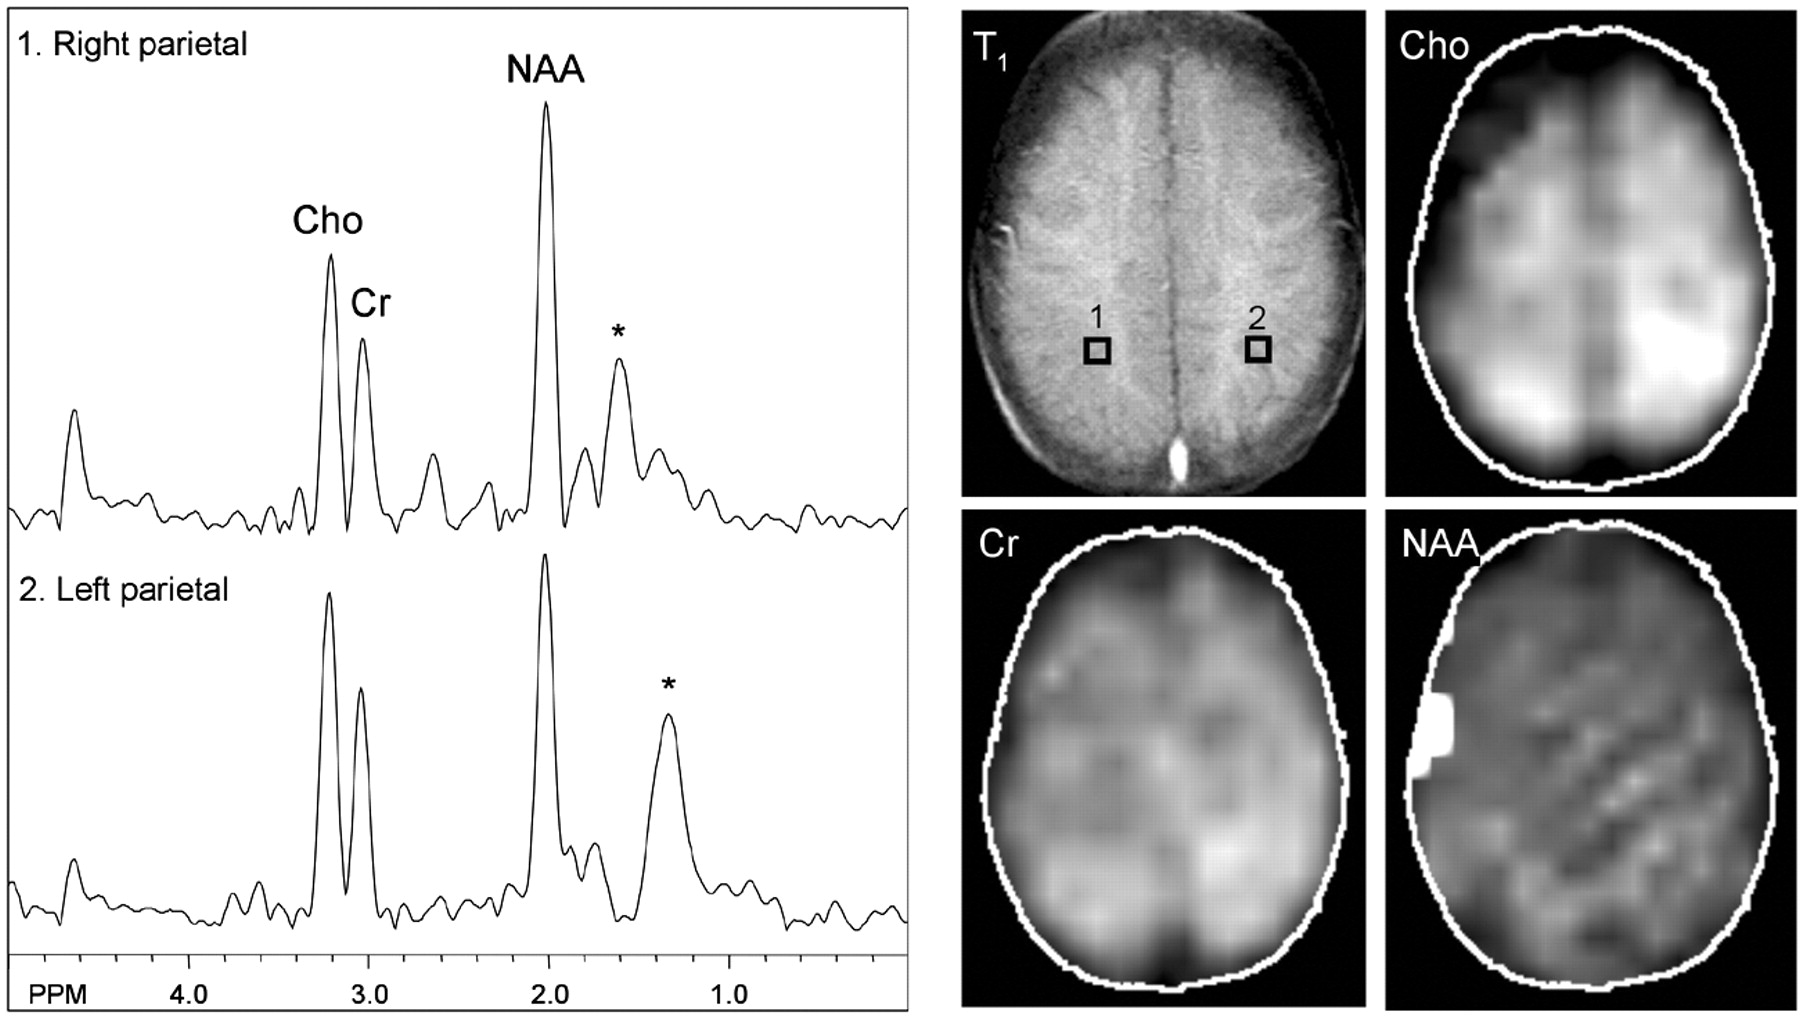
MR spectroscopic imaging showed a normal metabolic profile except for a mildly elevated choline level in the left parietal white matter at the level of the centrum semiovale (Fig 3) (peak areas [in arbitrary units]: choline, 1.73; creatine, 1.12 in the affected region; choline, 1.29; creatine, 1.06 contralaterally), corresponding to the region of perfusion deficit. Although selective spectra from the left parietal lobe showed mild regional variation of N-acetylaspartate levels depending on the placement of voxels, overall there appeared no reduction of N-acetylaspartate on the left side compared with the right side. The N-acetylaspartate metabolic image was nearly symmetric in both hemispheres and within normal limits. No lactate was detected in any brain region or CSF.

MR spectroscopy at the level of the centrum semiovale shows nearly symmetric and normal levels of N-acetylaspartate and creatine. Mild elevation of choline is shown in the left parietal region, which is best depicted on the metabolic map. No lactate is detected. Asterisk marks broad peaks at 1.2 through 1.4 ppm that most likely reflect lipid contamination.
Discussion
Imaging studies are useful for confirming the diagnosis of Sturge-Weber syndrome and evaluating the extent of intracranial involvement and may be important when clinical stigmata are atypical or not yet developed. Both CT and MR imaging provide useful structural information, and contrast-enhanced MR imaging is most sensitive for showing the extent and distribution of the leptomeningeal angiomatosis that is the hallmark of Sturge-Weber syndrome (2). Functional perfusion data are fundamental in depicting the primary deficit but thus far are available only from nuclear medicine studies. Cerebral perfusion imaging with technetium-99m hexamethylpropyleneamine oxime single photon emission computed tomography (SPECT) has shown hypoperfusion in the area of vascular malformation, at times more extended compared with abnormalities evident on CT scans and MR images (5, 6). In a few cases, the perfusion (estimated by using SPECT) and metabolism (assessed by using fluorine-18-fluorodeoxyglucose SPECT) abnormalities were evident before the development of structural abnormalities (7), suggesting that functional measures may be more sensitive for early diagnosis of disease. Furthermore, Maria et al (8) followed young Sturge-Weber syndrome patients (mean age, 1.75 years; early seizure onset, 6.8 months) longitudinally and found that six of 10 patients had baseline hypoperfusion and that five of nine had worsening of perfusion and glucose metabolism 1 year later that corresponded to neurologic deterioration. Interestingly, Pinton et al (9) evaluated infants who had not yet developed epilepsy and found early changes consistent with paradoxical hyperperfusion in the affected brain region compared with the contralateral side. The classic pattern of hypoperfusion then developed after 1 year of age, regardless of the presence or absence of seizures (9).
The case presented in the current study shows that functional cerebral perfusion data can be obtained in the same MR imaging study that is used to delineate structural abnormality in patients with Sturge-Weber syndrome. An important advantage of dynamic MR perfusion imaging, compared with positron emission tomography and SPECT, is that examination of the bolus arrival and clearance time course may provide information regarding abnormalities due to either the arterial or venous phase. A pronounced delay of venous clearance of contrast agent was observed in the areas of leptomeningeal angiomatous involvement, corroborating the currently accepted pathophysiology of anomalous cortical venous drainage and venous stasis. The region of venous stasis (Fig 2A) could be distinguished from a smaller focal area of true hypoperfusion (Fig 2B) that showed both delayed arrival and clearance of contrast agent.
Proton MR spectroscopy has also been useful in showing abnormalities of metabolites, providing an independent functional assessment of these patients. In a study of six patients with Sturge-Weber syndrome, decreased N-acetylaspartate was observed in the affected region in all patients, suggesting neuronal dysfunction or loss (10). These results were consistent with the first report of MR spectroscopy of Sturge-Weber syndrome in a child older than the child reported in the current study, who also had decreased N-acetylaspartate without change in choline or creatine (11). The difference between the current study and these two previous reports may be due to the older average age or longer seizure duration of those cases. The degree of cortical volume loss in our patient was apparent but subtle, and spectra did not reveal significant abnormality other than a focal area of mildly elevated choline, suggesting that impairment of neuronal function (with loss of N-acetylaspartate) occurs after development of the perfusion abnormality. Because choline level is normally higher in a young child’s brain and gradually decreases with maturation, the mild elevation of choline may be explained by the lack of normal development in the area of hypoperfused brain parenchyma or, alternatively, gliotic changes or demyelination. A decreased N-acetylaspartate level reflective of neuronal loss or dysfunction may be expected to develop in the region of more severe hypoperfusion or perhaps after a longer disease duration or as the result of prolonged seizure activity.
Also of interest is the observation of decreased T2 signal intensity in the subcortical white matter underlying the area of leptomeningeal angiomatosis (Fig 1A). This phenomenon in cases of Sturge-Weber syndrome has been extensively reported (1) and postulated to reflect areas of calcification, altered myelination states, and cerebral blood oxygenation effect. Calcification is unlikely to be responsible for this appearance because T2 shortening is frequently seen in the area without CT evidence of calcification (furthermore, Sturge-Weber syndrome calcification is typically cortical in location rather than in subjacent white matter). We think that considering the alteration of perfusion pattern in the area of angiomatosis, the third mechanism involving the change in cerebral blood oxygenation state is most plausible. This may be directly supported by the observation of increased oxygen extraction fraction in the affected brain region of a patient with Sturge-Weber syndrome measured by positron emission tomography using inhaled oxygen-15 as the radiotracer (12). A similar phenomenon has been shown in animal models, in which graded reduction of cerebral blood flow produced hypoperfusion that resulted in decreased T2 relaxation times (13, 14).
Conclusion
MR perfusion imaging and MR spectroscopic imaging can be safely used to characterize the early hemodynamic and metabolic changes in Sturge-Weber syndrome. A better understanding of the natural progression of disease may aid in early diagnosis, perhaps before development of symptoms and direct appropriate therapeutic intervention.
Acknowledgments
We thank MaryBeth Pule for dedicated nursing support and George Lutjen for excellent technical expertise, which made this study possible. We also thank the Sturge-Weber Foundation for support. The MRSI pulse sequence was provided by Dr. Jeffrey Duyn and Dr. Jan Willem van der Veen (NIH, Bethesda, MD).
Footnotes
This work was supported in part by National Institutes of Health grants NIH P41RR15241 and NIH K12N01696
References
- Received December 23, 2002.
- Accepted after revision April 14, 2003.
- Accepted after revision April 14, 2003.
- Copyright © American Society of Neuroradiology