Advertisement

Main menu

  • Home
  • Content
    • Current Issue
    • Accepted Manuscripts
    • Article Preview
    • Past Issue Archive
    • Video Articles
    • AJNR Case Collection
    • Case of the Week Archive
    • Case of the Month Archive
    • Classic Case Archive
  • Special Collections
    • AJNR Awards
    • Low-Field MRI
    • Alzheimer Disease
    • ASNR Foundation Special Collection
    • Photon-Counting CT
    • View All
  • Multimedia
    • AJNR Podcasts
    • AJNR SCANtastic
    • Trainee Corner
    • MRI Safety Corner
    • Imaging Protocols
  • For Authors
    • Submit a Manuscript
    • Submit a Video Article
    • Submit an eLetter to the Editor/Response
    • Manuscript Submission Guidelines
    • Statistical Tips
    • Fast Publishing of Accepted Manuscripts
    • Graphical Abstract Preparation
    • Imaging Protocol Submission
    • Author Policies
  • About Us
    • About AJNR
    • Editorial Board
    • Editorial Board Alumni
  • More
    • Become a Reviewer/Academy of Reviewers
    • Subscribers
    • Permissions
    • Alerts
    • Feedback
    • Advertisers
    • ASNR Home

User menu

  • Alerts
  • Log in

Search

  • Advanced search
American Journal of Neuroradiology

American Journal of Neuroradiology

ASHNR American Society of Functional Neuroradiology ASHNR American Society of Pediatric Neuroradiology ASSR
  • Alerts
  • Log in

Advanced Search

  • Home
  • Content
    • Current Issue
    • Accepted Manuscripts
    • Article Preview
    • Past Issue Archive
    • Video Articles
    • AJNR Case Collection
    • Case of the Week Archive
    • Case of the Month Archive
    • Classic Case Archive
  • Special Collections
    • AJNR Awards
    • Low-Field MRI
    • Alzheimer Disease
    • ASNR Foundation Special Collection
    • Photon-Counting CT
    • View All
  • Multimedia
    • AJNR Podcasts
    • AJNR SCANtastic
    • Trainee Corner
    • MRI Safety Corner
    • Imaging Protocols
  • For Authors
    • Submit a Manuscript
    • Submit a Video Article
    • Submit an eLetter to the Editor/Response
    • Manuscript Submission Guidelines
    • Statistical Tips
    • Fast Publishing of Accepted Manuscripts
    • Graphical Abstract Preparation
    • Imaging Protocol Submission
    • Author Policies
  • About Us
    • About AJNR
    • Editorial Board
    • Editorial Board Alumni
  • More
    • Become a Reviewer/Academy of Reviewers
    • Subscribers
    • Permissions
    • Alerts
    • Feedback
    • Advertisers
    • ASNR Home
  • Follow AJNR on Twitter
  • Visit AJNR on Facebook
  • Follow AJNR on Instagram
  • Join AJNR on LinkedIn
  • RSS Feeds

AJNR Awards, New Junior Editors, and more. Read the latest AJNR updates

Research ArticleHealth Policies/Quality Improvement/Evidence-Based Neuroimaging

Shift Volume Directly Impacts Neuroradiology Error Rate at a Large Academic Medical Center: The Case for Volume Limits

Vladimir Ivanovic, Kenneth Broadhead, Yu-Ming Chang, John F Hamer, Ryan Beck, Lotfi Hacein-Bey and Lihong Qi
American Journal of Neuroradiology April 2024, 45 (4) 374-378; DOI: https://doi.org/10.3174/ajnr.A8119
Vladimir Ivanovic
aFrom the Department of Radiology, Section of Neuroradiology (V.I., J.F.H., R.B.), Medical College of Wisconsin, Milwaukee, Wisconsin
  • Find this author on Google Scholar
  • Find this author on PubMed
  • Search for this author on this site
  • ORCID record for Vladimir Ivanovic
Kenneth Broadhead
bDepartment of Statistics (K.B.), Colorado State University, Fort Collins, Colorado
  • Find this author on Google Scholar
  • Find this author on PubMed
  • Search for this author on this site
  • ORCID record for Kenneth Broadhead
Yu-Ming Chang
cDepartment of Radiology, Section of Neuroradiology (Y.-M.C.), Beth Israel Deaconess Medical Center, Boston, Massachusetts
  • Find this author on Google Scholar
  • Find this author on PubMed
  • Search for this author on this site
  • ORCID record for Yu-Ming Chang
John F Hamer
aFrom the Department of Radiology, Section of Neuroradiology (V.I., J.F.H., R.B.), Medical College of Wisconsin, Milwaukee, Wisconsin
  • Find this author on Google Scholar
  • Find this author on PubMed
  • Search for this author on this site
Ryan Beck
aFrom the Department of Radiology, Section of Neuroradiology (V.I., J.F.H., R.B.), Medical College of Wisconsin, Milwaukee, Wisconsin
  • Find this author on Google Scholar
  • Find this author on PubMed
  • Search for this author on this site
Lotfi Hacein-Bey
dDepartment of Radiology, Section of Neuroradiology (L.H.-B.), University of California Davis Medical Center, Sacramento, California
  • Find this author on Google Scholar
  • Find this author on PubMed
  • Search for this author on this site
  • ORCID record for Lotfi Hacein-Bey
Lihong Qi
eDepartment of Public Health Sciences (L.Q.), School of Medicine, University of California Davis, Davis, California
  • Find this author on Google Scholar
  • Find this author on PubMed
  • Search for this author on this site
  • Article
  • Figures & Data
  • Info & Metrics
  • Responses
  • References
  • PDF
Loading

Abstract

BACKGROUND AND PURPOSE: Unlike in Europe and Japan, guidelines or recommendations from specialized radiological societies on workflow management and adaptive intervention to reduce error rates are currently lacking in the United States. This study of neuroradiologic reads at a large US academic medical center, which may hopefully contribute to this discussion, found a direct relationship between error rate and shift volume.

MATERIALS AND METHODS: CT and MR imaging reports from our institution’s Neuroradiology Quality Assurance database (years 2014–2020) were searched for attending physician errors. Data were collected on shift volume specific error rates per 1000 interpreted studies and RADPEER scores. Optimal cutoff points for 2, 3 and 4 groups of shift volumes were computed along with subgroups’ error rates.

RESULTS: A total of 643 errors were found, 91.7% of which were clinically significant (RADPEER 2b, 3b). The overall error rate (errors/1000 examinations) was 2.36. The best single shift volume cutoff point generated 2 groups: ≤ 26 studies (error rate 1.59) and > 26 studies (2.58; OR: 1.63, P < .001). The best 2 shift volume cutoff points generated 3 shift volume groups: ≤ 19 (1.34), 20–28 (1.88; OR: 1.4, P = .1) and ≥ 29 (2.6; OR: 1.94, P < .001). The best 3 shift volume cutoff points generated 4 groups: ≤ 24 (1.59), 25–66 (2.44; OR: 1.54, P < .001), 67–90 (3.03; OR: 1.91, P < .001), and ≥ 91 (2.07; OR: 1.30, P = .25). The group with shift volume ≥ 91 had a limited sample size.

CONCLUSIONS: Lower shift volumes yielded significantly lower error rates. The lowest error rates were observed with shift volumes that were limited to 19–26 studies. Error rates at shift volumes between 67–90 studies were 226% higher, compared with the error rate at shift volumes of ≤ 19 studies.

ABBREVIATIONS:

ICC
intraclass correlation coefficient
QA
quality assurance
VIF
variance inflation factor

Medical errors are the third leading cause of death in the United States.1 Many industries have implemented system-wide measures and technological advancements to decrease errors and fatalities. Between 1973 and 2020, the number of commercial aviation fatalities has decreased by 97%.2 Anesthesia-related mortality in the United States has decreased by 97% from 1952 to 2005.3 Reported rates of major errors in radiology range between 2%–6%.4⇓⇓-7 Error rates in diagnostic radiology have remained relatively constant since the time they were first studied in 1949.8⇓⇓⇓⇓⇓-14

Studies of both general radiology15,16 and neuroradiology17 have found higher shift volumes to be associated with diagnostic errors. Larger scale studies evaluating radiology error rates as a function of specific shift volume are lacking. The identification of specific shift volume ranges that minimize error rates could lead to corrective interventions. Our aims were to extend the knowledge gained from our prior work by using the same data set17⇓⇓⇓⇓-22 to evaluate shift volume specific error rates by neuroradiologists at a large academic medical center and to identify the shift volume ranges with the lowest error rates.

MATERIALS AND METHODS

Study Setting

Institutional review board approval with a waiver of informed consent was obtained for this retrospective study. Our department’s neuroradiology quality assurance (QA) database was searched for attending neuroradiologist errors between 2014–2020, which includes cases collected during the review of all addended reports and a review of computer selected studies during a clinical service, as previously described.20 Whenever assigned to a clinical service (all shifts, all radiologists), the neuroradiologist is presented with 3 randomly computer selected CT or MR imaging examinations, and the neuroradiologist is instructed to review and assign a score (1, 2a, 2b, 3a, 3b) to each by using the American College of Radiology RADPEER system.23 All RADPEER scores of 2 and 3 are further reviewed by either 2 additional attending neuroradiologists or the entire neuroradiology division during a quarterly QA conference to reach a consensus RADPEER score. Each reviewed examination is entered into the QA database along with its associated RADPEER score. Diagnostic error rates are expressed as the number of errors per 1000 interpreted examinations that are shift volume specific.

All 16 current or former members of the neuroradiology division are full-time employees who have completed neuroradiology fellowships. Division members have similar yearly productivity, read similar neuroimaging case mixes and rotate with similar frequency among general neuroradiology nonsubspecialized clinical services: emergency/inpatient (9-hour day shift), spine (9-hour day shift), outpatient (9-hour day shift), evening weekday call (6-hour evening shift), and weekend call (9–12-hour day shift). Attendings read a similar mix of adult and pediatric CT and MR imaging neuroradiology studies, which are read in chronological order on either a single common outpatient study worklist or a dedicated emergency/inpatient worklist. Broadly speaking, approximately 40% of the studies were dictated by trainees.

Data Collection

Data on shift volumes on the days an error was documented, the number of errors per shift volume, the total number of studies interpreted for each shift volume and demographic information were extracted from the radiology departmental database. Diagnostic error rates are expressed as the number of errors per 1000 interpreted examinations for each specific shift volume (for example, if there were 10 errors detected on all shifts of 40 studies, and there were 1000 shifts during which 40 studies were interpreted, then the error rate for a shift volume of 40 would be 10 / [40 × 1000]). The shift volume was defined as the total number of CT and MR imaging examinations that the neuroradiologist interpreted during the shift (eg, if 6 radiologists are working on a given day, this would constitute 6 total shifts for that day). We excluded shifts with 10 or fewer interpreted studies per day as outliers; many of these likely represent reports generated on administrative or off days, possibly to catch up with overflow work from the day before. For examinations comprising multiple unique accession numbers (eg, head MR imaging-MRA), each accession number was considered to be a single examination for purposes of determining shift volume.

Statistical Methods

Descriptive statistics (mean and SD for age; count and percentages for age) were obtained for the error group.

Optimal cutoff points categorizing examinations into one of several risk groups, using shift volume level as the diagnostic variable, were computed by using ordinary logistic regression.24 Given the wide range of daily shift volume productivity within our practice, we wanted to determine more than one possible cutoff point and error rate differences for the resultant groups. Each possible combination of cutoff points, categorizing examinations into 2, 3 or 4 separate risk groups, were computed. The optimal cutoff values are defined as the ones with the most significant overall likelihood ratio test statistics, giving the most significant overall set of risk groups for a specified number of cutoff points. Individual odds ratios and P values comparing each group with the group with the lowest shift volume (group 1) within each split are also computed, but these were not used to determine optimality. The error rate per 1000 studies was computed for each group within a split.

To assess the impact of potential correlation among examinations read by the same radiologist, the intraclass correlation, measured by the intraclass correlation coefficient (ICC), and the resulting variance inflation factor (VIF) were examined. In the presence of high intraclass correlation or VIFs, the use of ordinary logistic regression is inappropriate. As covariate information on the attending radiologist was unavailable for all examinations, the ICC and VIF were computed by using a subset of the data analyzed in a previous study.25 ICC values near 1 indicate high correlation, whereas values near 0 indicate low correlation. High VIFs indicate that variances of estimated parameters are higher than they would be in the absence of intraclass correlation, whereas values near 1 indicate little inflation. The ICC, its 95% confidence interval, and the VIFs were computed by using resampling techniques.26 All statistical analyses were performed in R, version 4.1.1.

RESULTS

There were 643 patients within the error group; 349 were men (54.3%), 293 were women (45.6%), and 1 (0.2%) patient’s sex was not recorded. The mean patient age was 49.8 years (SD, 25).

The estimated ICC among attending radiologists was low (0.001; 95% CI, 0–0.079), as was the estimated VIF (1.099), suggesting minimal correlation between examinations and minimal variance inflation. Six attending radiologists had small cluster sizes (having read fewer than 10 examinations). A sensitivity analysis of the ICC and VIF estimates was performed by rerunning the analysis without the small clusters. Similar estimates of the ICC (0.0005; 95% CI, 0–0.0796) and VIF (1.073) were obtained. Because of the low correlation and VIF, the method for determining optimal risk groups by using ordinary logistic regression was deemed acceptable.

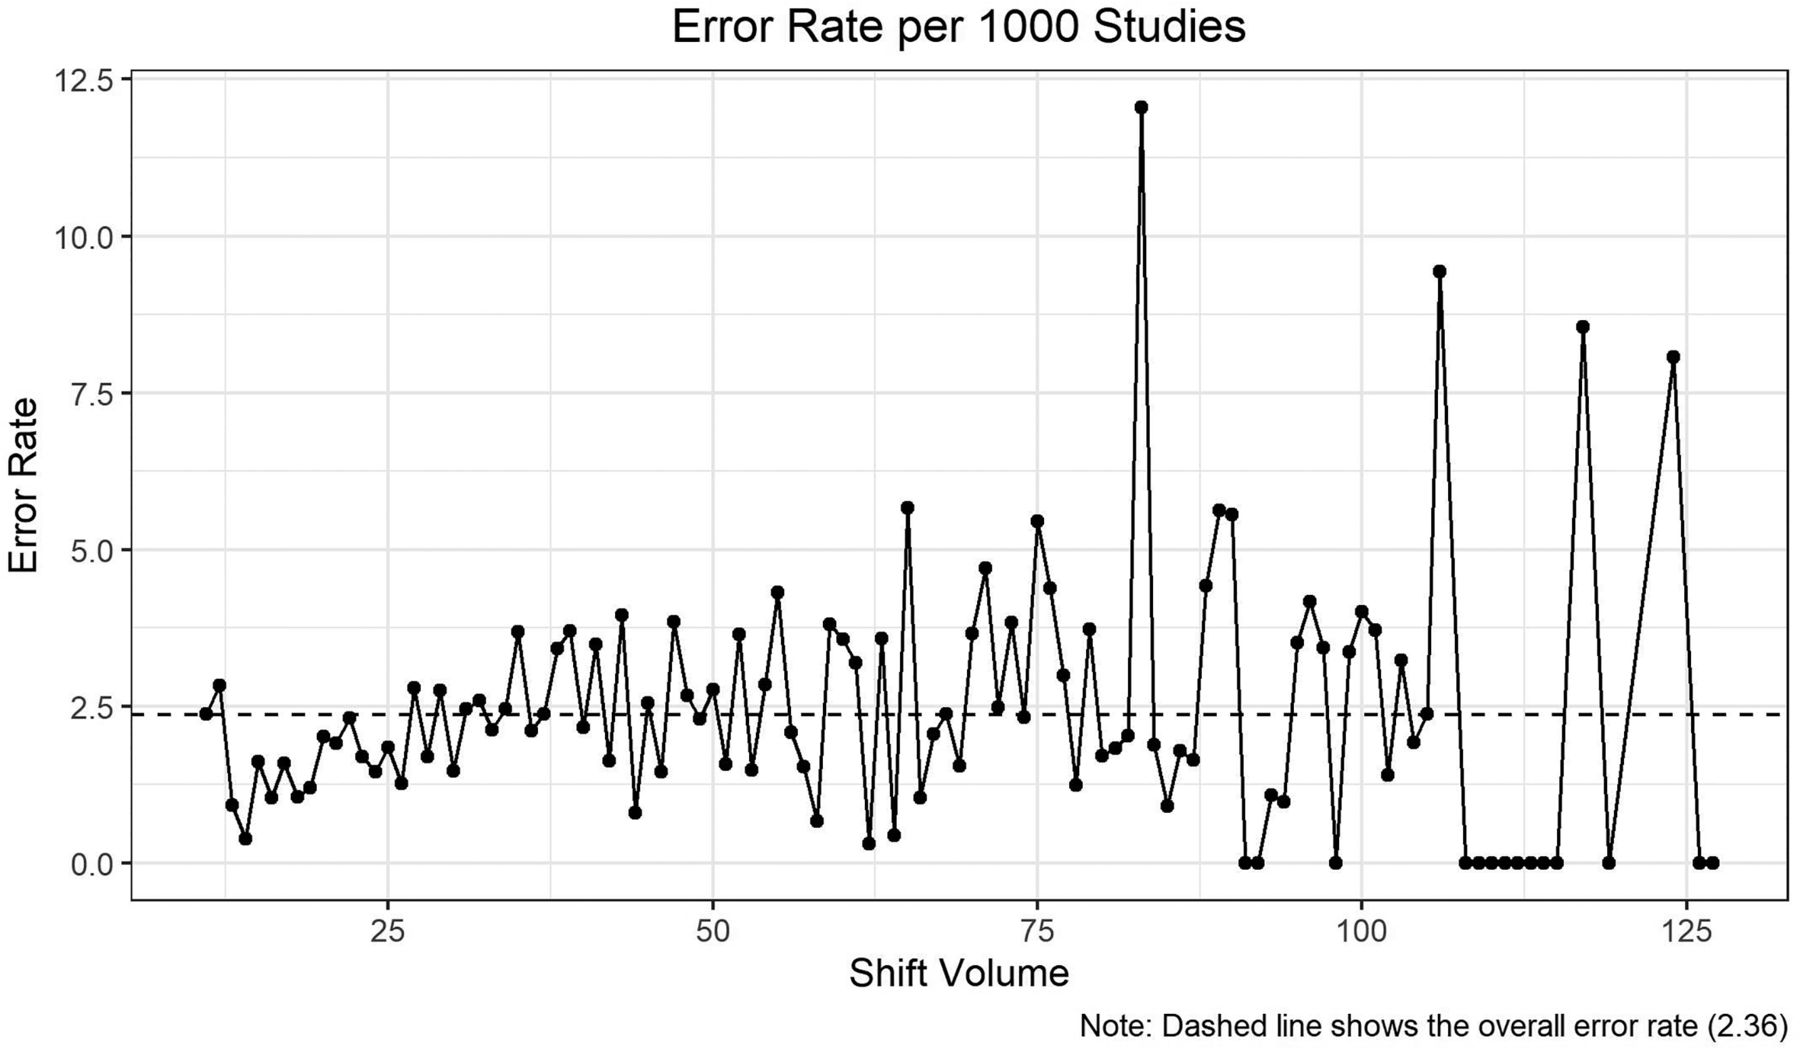
A total of 643 errors were detected during the study period; 590 (91.7%) were clinically significant (RADPEER 2b, 3b). The overall error rate (per 1000 interpreted examinations) was found to be 2.36. Figure 1 presents a detailed view of the trend in error rate as a function of shift volume compared with the overall error rate. The Table presents the risk groups by shift volume for 1, 2 and 3 cutoff points. All group splits were found to be highly significant by using the likelihood ratio test (P < .001).

FIG 1.
  • Download figure
  • Open in new tab
  • Download powerpoint
FIG 1.

Detailed view of the trends in error rate as a function of shift volume level against the overall error rate.

View this table:
  • View inline
  • View popup

Optimal risk groups

For a single cutoff point (search done for each shift volume level), group 1 consists of examinations read during shift volumes of ≤26 (error rate 1.59), whereas group 2 consists of examinations read during shift volumes of ≥27 (error rate 2.58). The odds of an examination in group 2 containing an error were found to be 63% higher than examinations in group 1 (OR: 1.63, P < .001).

For 2 cutoff points (search done by fours), group 1 consists of examinations read during shift volumes of ≤19 (error rate 1.34), group 2 consists of examinations read during shift volumes between 20 and 28 (error rate 1.88), and group 3 consists of examinations read during shift volumes of ≥29 (error rate 2.6). The odds of an examination in group 2 containing an error were found to be 40% higher than examinations in group 1 (OR: 1.4, P = .1), whereas the odds of examinations in group 3 were found to be 94% higher than examinations in group 1 (OR 1.94, P < .001).

For 3 cutoff points (search done by tens), group 1 consists of examinations read during shift volumes of ≤24 (error rate 1.59), group 2 consists of examinations read during shift volumes between 25 and 66 (error rate 2.44), group 3 consists of examinations read during shift volumes between 67 and 90 (error rate 3.03), and group 4 consists of examinations read during shift volumes of ≥91 (error rate 2.07). The odds of an examination in group 2 containing an error were found to be 54% higher than examinations in group 1 (OR: 1.54, P < .001), the odds of an examination in group 3 containing an error were found to be 91% higher than examinations in group 1 (OR: 1.91, P < .001), and the odds of an examination in group 4 containing an error were found to be 30% higher than examinations in group 1 (OR 1.30, P = .25).

DISCUSSION

In this study, we have found that neuroradiology errors are significantly lower on low shift volumes compared with high shift volumes. Based on our data, the best outcomes are seen when shift volumes are ≤19–26 studies. Our data are in line with the findings of a recent nationwide survey of 42 academic neuroradiology division chiefs that suggested a mean optimal shift volume of between 25–33 studies.27 Our group error rate was 2.36; if our shift volume could be limited to 19 studies, error rates could potentially decrease by 57%. The highest error rates were observed at shift volumes of between 67–90 studies, which was 226% higher than the lowest error rate, which was observed at shift volumes of ≤19 studies. Error rates at high shift volumes might be difficult to justify, given this degree of difference. Approximately 74 million CT and 39 million MR imaging studies are performed in the United States per year,28 and decreasing the mean error rates might have a significant impact from a public health perspective.1 Medicolegal outcomes of errors are not insignificant. An analysis of 2019 malpractice claims in diagnostic and interventional neuroradiology found a median plaintiff award of $2,877,847 and a median settlement amount of $1,950,000.29 Missing aneurysms on CT or MR imaging may lead to plaintiff awards of $4–43 million.30

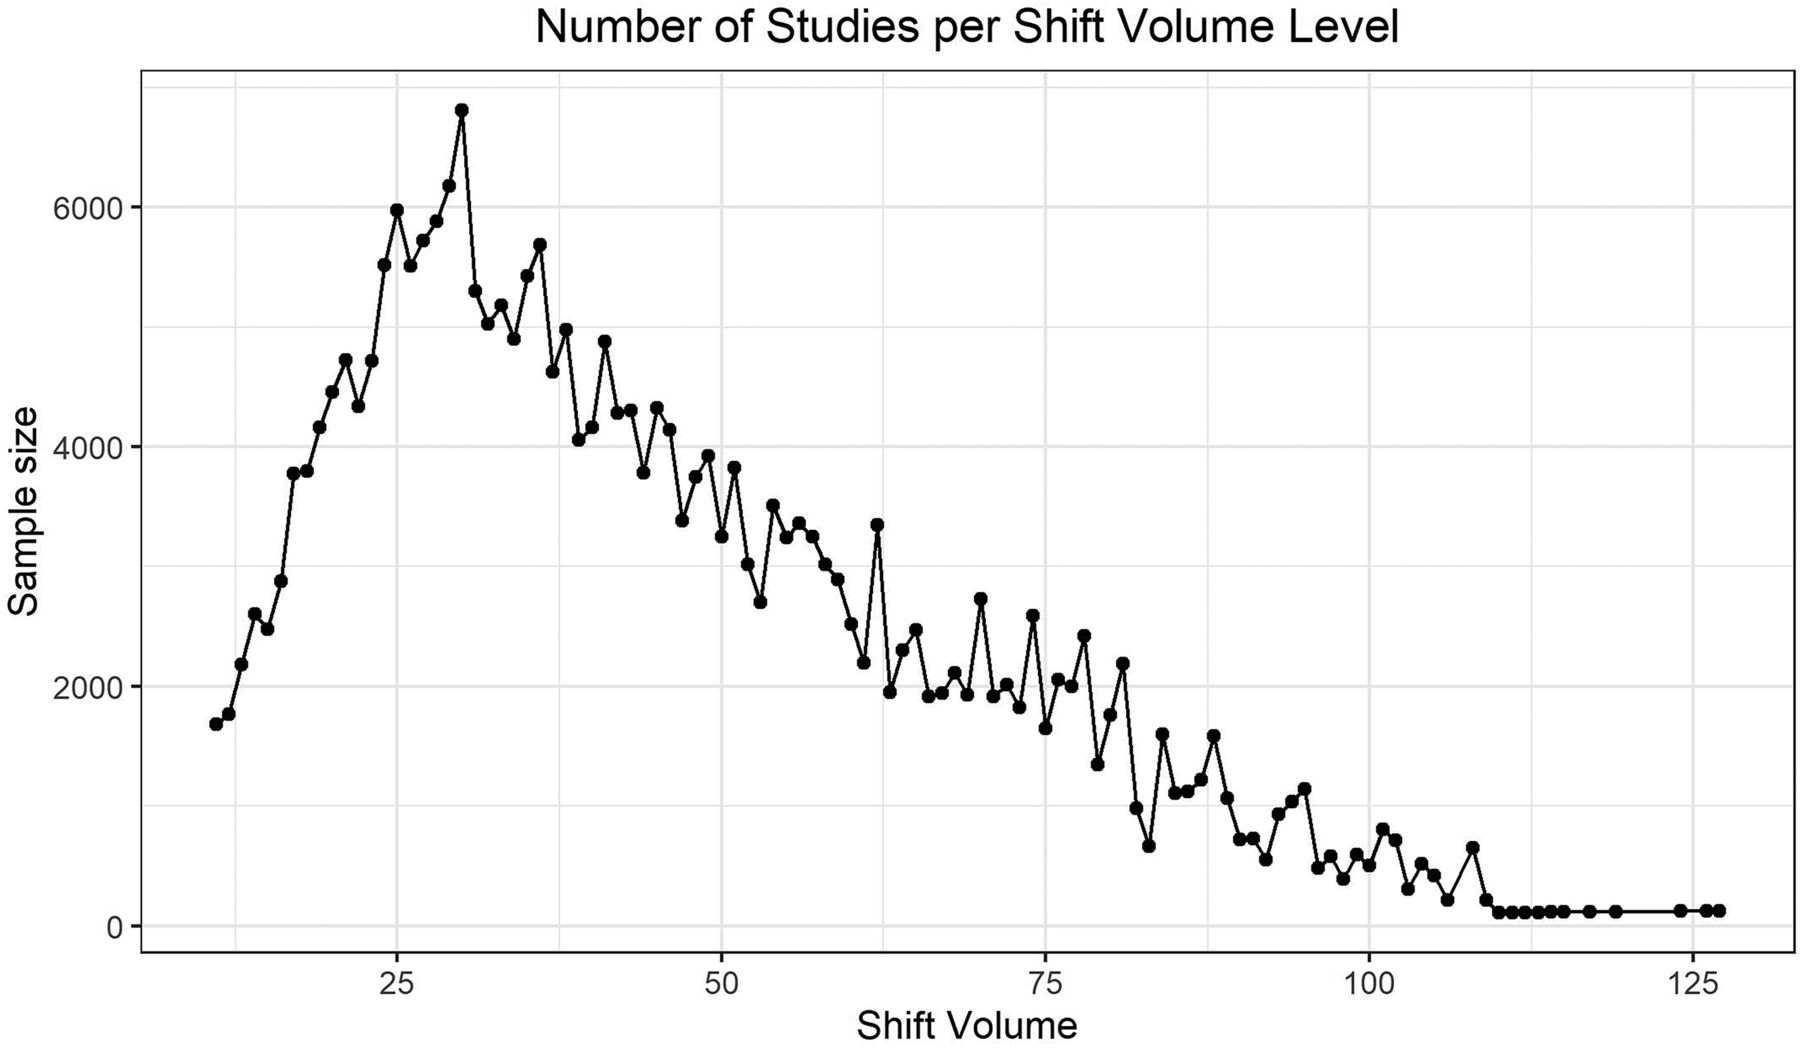
For 3 cutoff points, the odds ratio for the group 4 risk group decreases, seemingly suggesting that it is safer than groups 2 and 3. However, this is most likely due to comparatively limited sample sizes for the shift volume levels comprising that group. Figure 2 presents a plot of the sample size for each shift volume; shift volumes of 91 and greater can be seen to have markedly lower sample sizes than those of the lower shift volumes. Furthermore, many shift volumes after this threshold are so small that no error has yet been observed at these volume levels. Together with the overall trends seen in Fig 1, we do not have any reason to suspect that risk group 4 is any safer than groups 2 and 3. We conclude the decreased odds ratio for group 4 is the result of sample size limitations.

FIG 2.
  • Download figure
  • Open in new tab
  • Download powerpoint
FIG 2.

Sample size for each shift volume level.

Prior literature has highlighted a broad range of potential strategies for reducing diagnostic errors within general and specialized practices, including interpretation by specialty and subspecialty radiologists,9,10,31,32 lower shift volumes,15 limits on shift lengths to less than 10 hours,15,33 reductions in noninterpretive tasks during clinical shifts,34 radiologist participation at multispecialty tumor boards,20 awareness of most common types of misses,18,19,21 and reduced interpretation speed.35 Subspecialty interpretations of neuroradiologic studies can change clinical care up to 41% of the time when compared with those of general radiologists or nonsubspecialized neuroradiologist interpretations.9,32 Radiologist workloads have been steadily increasing over recent decades.36,37 If we can develop more uniform policies and hospital business models in which shift volume limits and subspecialized interpretations are incentivized to act synergistically, as has been successfully done at many institutions across the country, the error reduction rates might approximate those of the airline industry or anesthesia departments. In 2012, the Royal College of Radiologists issued a national guideline recommending that radiologists interpret up to 2 complex CT or MR imaging examinations and up to 6 CT or MR imaging examinations, overall, per hour.38 In 2022, the Japanese College of Radiology issued a national guideline recommending that radiologists interpret up to 4 examinations per hour.39 The American College of Radiology has not issued official guidelines aimed at reducing error rates in the United States.

The results of this study can be used to guide future strategies. In our institution, the initial step has been to reduce the effect of extreme shift volumes by adjusting workflow without increasing shift frequency. Flexibility toward a labor division based on seniority level and experience with certain studies is encouraged as part of the process. Promoting educational and research efforts, multidisciplinary consultations, and peer-review discussions allows us to maintain our focus on quality and deepening our expertise. Mid- and long-term goals of limiting shift volume within the 19–26 range should then facilitate adjustments to the traditional business models and should thereby result in increased job attractiveness and more effective support to cohesive and motivated teams while maintaining profitability.

The limitations of our study include its single-center retrospective design. Second, though our study contains a large number of detected errors compared with other publications, only a fraction of potential errors was detected, given our methods of data collection. Third, all radiologists were fellowship-trained neuroradiologists at an academic medical center. Thus, our findings may not apply for general radiology practice, for neuroradiologists at community practices, or for academic neuroradiologists who have significantly different workflows than ours. Ideally, each institution should conduct an analysis of its own data. Fourth, we did not include confounders in our analysis. Based on prior work, neuroradiologists’ years of experience, trainee participation, and emergency interpretation setting did not have an impact on diagnostic errors, and shift volume was shown to be the dominant variable that influences outcomes.25 Shift length was not evaluated as a risk factor for diagnostic error, and the same volume threshold for a 6-hour shift should be different in comparison with that of a 9-hour or 12-hour shift; our shifts were generally shorter than 9 hours, whereas prior literature suggests a significant increase in errors beyond a threshold of 10 hours.15,33 Fifth, the analysis did not account for examination complexity (number of findings or diagnoses per study), which would be virtually impossible to evaluate, given the >250,000 studies performed during the study period. It might be reasonable to assume that higher volume shifts could have a higher proportion of negative or simple studies (negative CT head) and a lower proportion of complex MR imaging studies. Sixth, sub-analyses were not performed with respect to specific RADPEER scores (2a, 2b, 3a, or 3b). Further, prospective research is needed to determine shift volume safety cutoff points at the group and individual levels, using shift volume as the only variable and holding all possible confounders constant. Seventh, the lack of full covariate information on attending radiologists limited the analytic approaches that could be employed to handle potential intraclass correlation. Future studies should give thought to handling potential correlation though direct modeling.

CONCLUSIONS

Limiting the number of studies per shift to a low range, as opposed to high, unregulated volumes, should allow for the prevention of a significant number of diagnostic neuroradiology errors. Our study of shift volumes at a busy multispecialty, tertiary, large referral academic medical center suggests that neuroradiologic shift volumes should be limited to a 19–26 range per shift.

Footnotes

  • Disclosure forms provided by the authors are available with the full text and PDF of this article at www.ajnr.org.

References

  1. 1.↵
    1. Makary MA,
    2. Daniel M
    . Medical error-the third leading cause of death in the US. BMJ 2016;353:i2139 doi:10.1136/bmj.i2139 pmid:27143499
    FREE Full Text
  2. 2.↵
    The flight safety foundation’s aviation safety network. Fatalities per million passengers. https://aviation-safety.net/statistics/. Accessed September 23, 2023
  3. 3.↵
    1. Li G,
    2. Warner M,
    3. Lang BH, et al
    . Epidemiology of anesthesia-related mortality in the United States, 1999–2005. Anesthesiology 2009;110:759–65 doi:10.1097/aln.0b013e31819b5bdc pmid:19322941
    CrossRefPubMed
  4. 4.↵
    1. Wu MZ,
    2. McInnes MDF,
    3. Macdonald DB, et al
    . CT in adults: Systematic review and meta-analysis of interpretation discrepancy rates. Radiology 2014;270:717–35 doi:10.1148/radiol.13131114 pmid:24475832
    CrossRefPubMed
  5. 5.↵
    1. Babiarz LS,
    2. Yousem DM
    . Quality control in neuroradiology: discrepancies in image interpretation among academic neuroradiologists. AJNR Am J Neuroradiol 2012;33:37–42 doi:10.3174/ajnr.A2704 pmid:22033725
    Abstract/FREE Full Text
  6. 6.↵
    1. Borgstede JP,
    2. Lewis RS,
    3. Bhargavan M, et al
    . RADPEER quality assurance program: a multifacility study of interpretive disagreement rates. J Am Coll Radiol 2004;1:59–65 doi:10.1016/S1546-1440(03)00002-4
    CrossRefPubMed
  7. 7.↵
    1. Kim YW,
    2. Mansfield LT
    . Fool me twice: delayed diagnoses in radiology with emphasis on perpetuated errors. AJR Am J Roentgenol 2014;202:465–70 doi:10.2214/AJR.13.11493 pmid:24555582
    CrossRefPubMed
  8. 8.↵
    1. Garland LH
    . On the scientific evaluation of diagnostic procedures. Radiology 1949;52:309–28 doi:10.1148/52.3.309 pmid:18113241
    CrossRefPubMed
  9. 9.↵
    1. Loevner LA,
    2. Sonners AI,
    3. Schulman BJ, et al
    . Reinterpretation of cross-sectional images in patients with head and neck cancer in the setting of a multidisciplinary cancer center. AJNR Am J Neuroradiol 2002;23:1622–26 pmid:12427610
    PubMed
  10. 10.↵
    1. Rosenkrantz AB,
    2. Duszak R,
    3. Babb JS, et al
    . Discrepancy rates and clinical impact of imaging secondary interpretations: a systematic review and meta-analysis. J Am Coll Radiology 2018;15:1222–31 doi:10.1016/j.jacr.2018.05.037 pmid:30031614
    CrossRefPubMed
  11. 11.↵
    1. Kabadi SJ,
    2. Krishnaraj A
    . Strategies for improving the value of the radiology report: a retrospective analysis of errors in formally over-read studies. J Am Coll Radiol 2017;14:459–66 doi:10.1016/j.jacr.2016.08.033 pmid:7884632
    CrossRefPubMed
  12. 12.↵
    1. Revesz G,
    2. Kundel HL
    . Psychophysical studies of detection errors in chest radiology. Radiology 1977;123:559–62 doi:10.1148/123.3.559 pmid:860023
    CrossRefPubMed
  13. 13.↵
    1. Quekel LGBA,
    2. Kessels AGH,
    3. Goei R, et al
    . Miss rate of lung cancer on the chest radiograph in clinical practice. Chest 1999;115:720–24 doi:10.1378/chest.115.3.720 pmid:10084482
    CrossRefPubMed
  14. 14.↵
    1. Abujudeh HH,
    2. Boland GW,
    3. Kaewlai R, et al
    . Abdominal and pelvic computed tomography (CT) interpretation: discrepancy rates among experienced radiologists. Eur Radiology 2010;20:1952–57 doi:10.1007/s00330-010-1763-1 pmid:20336300
    CrossRefPubMed
  15. 15.↵
    1. Hanna TN,
    2. Lamoureux C,
    3. Krupinski EA, et al
    . Effect of shift, schedule, and volume on interpretive accuracy: a retrospective analysis of 2.9 million radiologic examinations. Radiology 2018;287:205–12 doi:10.1148/radiol.2017170555 pmid:29156150
    CrossRefPubMed
  16. 16.↵
    1. Kasalak Ö,
    2. Alnahwi H,
    3. Toxopeus R, et al
    . Work overload and diagnostic errors in radiology. Eur J Radiology 2023;167:111032 doi:10.1016/j.ejrad.2023.111032 pmid:37579563
    CrossRefPubMed
  17. 17.↵
    1. Ivanovic V,
    2. Paydar A,
    3. Chang Y-M, et al
    . Impact of shift volume on neuroradiology diagnostic errors at a large tertiary academic center. Acad Radiology 2023;30:1584–88 doi:https://doi.org/10.1016/J.ACRA.2022.08.035 pmid:36180325
    CrossRefPubMed
  18. 18.↵
    1. Vong S,
    2. Chang J,
    3. Assadsangabi R, et al
    . Analysis of perceptual errors in skull-base pathology. Neuroradiol J 2023;36:515–23 doi:10.1177/19714009221108679 pmid:35722674
    CrossRefPubMed
  19. 19.↵
    1. Biddle G,
    2. Assadsangabi R,
    3. Broadhead K, et al
    . Diagnostic errors in cerebrovascular pathology: retrospective analysis of a neuroradiology database at a large tertiary academic medical center. AJNR Am J Neuroradiol 2022;43:1271–78 doi:10.3174/ajnr.A7596 pmid:35926887
    Abstract/FREE Full Text
  20. 20.↵
    1. Ivanovic V,
    2. Assadsangabi R,
    3. Hacein-Bey L, et al
    . Neuroradiology diagnostic errors at a tertiary academic centre: effect of participation in tumour boards and physician experience. Clin Radiology 2022;77:607–12 doi:10.1016/j.crad.2022.04.006 pmid:35589432
    CrossRefPubMed
  21. 21.↵
    1. Ferguson A,
    2. Assadsangabi R,
    3. Chang J, et al
    . Analysis of misses in imaging of head and neck pathology by attending neuroradiologists at a single tertiary academic medical centre. Clin Radiology 2021;76:786.e9–e13 doi:10.1016/j.crad.2021.06.011 pmid:34304864
    CrossRefPubMed
  22. 22.↵
    1. Ivanovic V,
    2. Broadhead K,
    3. Beck R, et al
    . Factors associated with neuroradiologic diagnostic errors at a large tertiary-care academic medical center: a case-control study. AJR Am J Roentgenol 2023;221:355–62 doi:10.2214/AJR.22.28925 pmid:36988269
    CrossRefPubMed
  23. 23.↵
    1. Goldberg-Stein S,
    2. Frigini LA,
    3. Long S, et al
    . ACR RADPEER committee white paper with 2016 updates: Revised scoring system, new classifications, self-review, and subspecialized reports. J Am Coll Radiology 2017;14:1080–86 doi:10.1016/j.jacr.2017.03.023 pmid:28551339
    CrossRefPubMed
  24. 24.↵
    1. Chang C,
    2. Hsieh MK,
    3. Chang WY, et al
    . Determining the optimal number and location of cutoff points with application to data of cervical cancer. PLoS One 2017;12:e0176231 doi:10.1371/journal.pone.0176231 pmid:28448533
    CrossRefPubMed
  25. 25.↵
    1. Ivanovic V,
    2. Broadhead K,
    3. Beck R, et al
    . Factors associated with neuroradiology diagnostic errors at a large tertiary-care academic medical center: a case-control study. AJR Am J Roentgenol 2023;221:355–62 doi:10.2214/AJR.22.28925
    CrossRefPubMed
  26. 26.↵
    1. Chakraborty H,
    2. Sen PK
    . Resampling method to estimate intra-cluster correlation for clustered binary data. Commun Stat Theory Methods 2016;45:2368–77 doi:10.1080/03610926.2013.870202
    CrossRef
  27. 27.↵
    1. Wintermark M,
    2. Gupta V,
    3. Hess C, et al
    . Realistic productivity in academic neuroradiology: a national survey of neuroradiology division chiefs. AJNR Am J Neuroradiol 2023;44:759–61 doi:10.3174/ajnr.A7912 pmid:37348969
    FREE Full Text
  28. 28.↵
    1. Mahesh M,
    2. Ansari AJ,
    3. Mettle FA
    . Patient exposure from radiologic and nuclear medicine procedures in the United States and worldwide: 2009-2018. Radiology 2023;307:e239013 doi:10.1148/radiol.239006 pmid:36972184
    CrossRefPubMed
  29. 29.↵
    1. Deckey DG,
    2. Eltorai AEM,
    3. Jindal G, et al
    . Analysis of malpractice claims involving diagnostic and interventional neuroradiology. J Am Coll Radiology 2019;16:764–69 doi:10.1016/j.jacr.2018.10.022 pmid:30584036
    CrossRefPubMed
  30. 30.↵
    1. Khan A,
    2. Khunte M,
    3. Wu X, et al
    . Malpractice litigation related to diagnosis and treatment of intracranial aneurysms. AJNR Am J Neuroradiol 2023;44:460–66 doi:10.3174/ajnr.A7828 pmid:36997286
    Abstract/FREE Full Text
  31. 31.↵
    1. Hatzoglou V,
    2. Omuro AM,
    3. Haque S, et al
    . Second-opinion interpretations of neuroimaging studies by oncologic neuroradiologists can help reduce errors in cancer care. Cancer 2016;122:2708–14 doi:10.1002/cncr.30083 pmid:27219108
    CrossRefPubMed
  32. 32.↵
    1. Lysack JT,
    2. Hoy M,
    3. Hudon ME, et al
    . Impact of neuroradiologist second opinion on staging and management of head and neck cancer. J Otolaryngol Head Neck Surg 2013;42:39 doi:10.1186/1916-0216-42-39 pmid:23739037
    CrossRefPubMed
  33. 33.↵
    1. Ruutiainen AT,
    2. Durand DJ,
    3. Scanlon MH, et al
    . Increased error rates in preliminary reports issued by radiology residents working more than 10 consecutive hours overnight. Acad Radiology 2013;20:305–11 doi:10.1067/j.cpradiol.2016.11.010 pmid:23452475
    CrossRefPubMed
  34. 34.↵
    1. Lee MH,
    2. Schemmel AJ,
    3. Pooler BD, et al
    . Workflow dynamics and the imaging value chain: quantifying the effect of designating a nonimage-interpretive task workflow. Curr Probl Diagn Radiology 2017;46:275–81 doi:10.1067/j.cpradiol.2016.11.010 pmid:28049559
    CrossRefPubMed
  35. 35.↵
    1. Sokolovskaya E,
    2. Shinde T,
    3. Ruchman RB, et al
    . The effect of faster reporting speed for imaging studies on the number of misses and interpretation errors: a pilot study. J Am Coll Radiology 2015;12:683–88 doi:10.1016/j.jacr.2015.03.040 pmid:26003588
    CrossRefPubMed
  36. 36.↵
    1. Lu Y,
    2. Arenson RL
    . The academic radiologist’s clinical productivity: an update. Acad Radiology 2005;12:1211–23 doi:10.1016/j.acra.2005.05.015 pmid:16112517
    CrossRefPubMed
  37. 37.↵
    1. McDonald RJ,
    2. Schwartz KM,
    3. Eckel LJ, et al
    . The effects of changes in utilization and technological advancements of cross-sectional imaging on radiologist workload. Acad Radiology 2015;22:1191–98 doi:10.1016/j.acra.2015.05.007 pmid:26210525
    CrossRefPubMed
  38. 38.↵
    The Royal College of Radiologists website. Clinical radiology workload: guidance on radiologists' reporting figures. www.rcr.ac.uk. Accessed September 28, 2023
  39. 39.↵
    Japanese College of Radiology webpage. JCR statement on appropriate workload of radiologists. jcr.or.jp/english-page. Accessed September 28, 2023
  • Received October 6, 2023.
  • Accepted after revision December 18, 2023.
  • © 2024 by American Journal of Neuroradiology
PreviousNext
Back to top

In this issue

American Journal of Neuroradiology: 45 (4)
American Journal of Neuroradiology
Vol. 45, Issue 4
1 Apr 2024
  • Table of Contents
  • Index by author
  • Complete Issue (PDF)
Advertisement
Print
Download PDF
Email Article

Thank you for your interest in spreading the word on American Journal of Neuroradiology.

NOTE: We only request your email address so that the person you are recommending the page to knows that you wanted them to see it, and that it is not junk mail. We do not capture any email address.

Enter multiple addresses on separate lines or separate them with commas.
Shift Volume Directly Impacts Neuroradiology Error Rate at a Large Academic Medical Center: The Case for Volume Limits
(Your Name) has sent you a message from American Journal of Neuroradiology
(Your Name) thought you would like to see the American Journal of Neuroradiology web site.
CAPTCHA
This question is for testing whether or not you are a human visitor and to prevent automated spam submissions.
Cite this article
Vladimir Ivanovic, Kenneth Broadhead, Yu-Ming Chang, John F Hamer, Ryan Beck, Lotfi Hacein-Bey, Lihong Qi
Shift Volume Directly Impacts Neuroradiology Error Rate at a Large Academic Medical Center: The Case for Volume Limits
American Journal of Neuroradiology Apr 2024, 45 (4) 374-378; DOI: 10.3174/ajnr.A8119

Citation Manager Formats

  • BibTeX
  • Bookends
  • EasyBib
  • EndNote (tagged)
  • EndNote 8 (xml)
  • Medlars
  • Mendeley
  • Papers
  • RefWorks Tagged
  • Ref Manager
  • RIS
  • Zotero
0 Responses
Respond to this article
Share
Bookmark this article
Shift Volume and Neuroradiology Error Rates
Vladimir Ivanovic, Kenneth Broadhead, Yu-Ming Chang, John F Hamer, Ryan Beck, Lotfi Hacein-Bey, Lihong Qi
American Journal of Neuroradiology Apr 2024, 45 (4) 374-378; DOI: 10.3174/ajnr.A8119
del.icio.us logo Twitter logo Facebook logo Mendeley logo
  • Tweet Widget
  • Facebook Like
  • Google Plus One
Purchase

Jump to section

  • Article
    • Abstract
    • ABBREVIATIONS:
    • MATERIALS AND METHODS
    • RESULTS
    • DISCUSSION
    • CONCLUSIONS
    • Footnotes
    • References
  • Figures & Data
  • Info & Metrics
  • Responses
  • References
  • PDF

Related Articles

  • No related articles found.
  • PubMed
  • Google Scholar

Cited By...

  • Analysis of Requirements within Neuroradiology Job Advertisements in a Specific Timeframe
  • Shift Volumes
  • A Public Health Perspective on Radiologists Interpretation Volumes
  • Striking a Balance: Global Perspectives on Neuroradiology Workload and Quality of Service
  • Crossref (8)
  • Google Scholar

This article has been cited by the following articles in journals that are participating in Crossref Cited-by Linking.

  • Mitigating Misses and Misinterpretations: AJR Podcast Series on Diagnostic Excellence and Error, Episode 4
    Francis Deng, David M. Yousem
    American Journal of Roentgenology 2024 223 4
  • A Public Health Perspective on Radiologists’ Interpretation Volumes
    Jeffrey P. Guenette, Geoffrey S. Young, Rajiv Gupta, Javier M. Romero, Raymond Y. Huang
    American Journal of Neuroradiology 2024 45 6
  • Analysis of Requirements within Neuroradiology Job Advertisements in a Specific Timeframe
    Vishal D. Thumar, James Y. Chen
    American Journal of Neuroradiology 2024 45 9
  • Causes of Moral Distress in Academic Radiologists: Variation Among Institutions
    Priya Dave, Olga R. Brook, Alexander Brook, Andrew W. Bowman, Luke Yoon, Robert W. Morris, Jonathan A. Flug, Ethan A. Smith, Bettina Siewert
    Journal of the American College of Radiology 2025
  • Forecasting trends of rising emergency department chest imaging using machine learning
    Sishir Doddi, Oscar Salichs, Shruthi Karthika Varier, Ashish Khandelwal, Satheesh Krishna Jeyaraj, Sree Harsha Tirumani
    Emergency Radiology 2025 32 2
  • Navigating Malpractice: Guide for U.S. Radiologists
    Luke M. Wojdyla, James Y. Chen
    RadioGraphics 2025 45 5
  • Shift Volumes
    Nadja Kadom
    American Journal of Neuroradiology 2024 45 7
  • Striking a Balance: Global Perspectives on Neuroradiology Workload and Quality of Service
    Max Wintermark, Kei Yamada, Tchoyoson Lim, Roy Riascos, Carlos Torres, Tarek Yousry
    American Journal of Neuroradiology 2024 45 2

More in this TOC Section

  • Gender differences in neuroradiology practice
  • Accuracy of Financial Disclosures at ASNR
  • ASNR Gadolinium Contrast Use in CKD Patients
Show more Health Policies/Quality Improvement/Evidence-Based Neuroimaging

Similar Articles

Advertisement

Indexed Content

  • Current Issue
  • Accepted Manuscripts
  • Article Preview
  • Past Issues
  • Editorials
  • Editor's Choice
  • Fellows' Journal Club
  • Letters to the Editor
  • Video Articles

Cases

  • Case Collection
  • Archive - Case of the Week
  • Archive - Case of the Month
  • Archive - Classic Case

More from AJNR

  • Trainee Corner
  • Imaging Protocols
  • MRI Safety Corner
  • Book Reviews

Multimedia

  • AJNR Podcasts
  • AJNR Scantastics

Resources

  • Turnaround Time
  • Submit a Manuscript
  • Submit a Video Article
  • Submit an eLetter to the Editor/Response
  • Manuscript Submission Guidelines
  • Statistical Tips
  • Fast Publishing of Accepted Manuscripts
  • Graphical Abstract Preparation
  • Imaging Protocol Submission
  • Evidence-Based Medicine Level Guide
  • Publishing Checklists
  • Author Policies
  • Become a Reviewer/Academy of Reviewers
  • News and Updates

About Us

  • About AJNR
  • Editorial Board
  • Editorial Board Alumni
  • Alerts
  • Permissions
  • Not an AJNR Subscriber? Join Now
  • Advertise with Us
  • Librarian Resources
  • Feedback
  • Terms and Conditions
  • AJNR Editorial Board Alumni

American Society of Neuroradiology

  • Not an ASNR Member? Join Now

© 2025 by the American Society of Neuroradiology All rights, including for text and data mining, AI training, and similar technologies, are reserved.
Print ISSN: 0195-6108 Online ISSN: 1936-959X

Powered by HighWire