
Abstract
BACKGROUND AND PURPOSE: Tumor segmentation is essential in surgical and treatment planning and response assessment and monitoring in pediatric brain tumors, the leading cause of cancer-related death among children. However, manual segmentation is time-consuming and has high interoperator variability, underscoring the need for more efficient methods. After training, we compared 2 deep-learning-based 3D segmentation models, DeepMedic and nnU-Net, with pediatric-specific multi-institutional brain tumor data based on multiparametric MR images.
MATERIALS AND METHODS: Multiparametric preoperative MR imaging scans of 339 pediatric patients (n = 293 internal and n = 46 external cohorts) with a variety of tumor subtypes were preprocessed and manually segmented into 4 tumor subregions, ie, enhancing tumor, nonenhancing tumor, cystic components, and peritumoral edema. After training, performances of the 2 models on internal and external test sets were evaluated with reference to ground truth manual segmentations. Additionally, concordance was assessed by comparing the volume of the subregions as a percentage of the whole tumor between model predictions and ground truth segmentations using the Pearson or Spearman correlation coefficients and the Bland-Altman method.
RESULTS: The mean Dice score for nnU-Net internal test set was 0.9 (SD, 0.07) (median, 0.94) for whole tumor; 0.77 (SD, 0.29) for enhancing tumor; 0.66 (SD, 0.32) for nonenhancing tumor; 0.71 (SD, 0.33) for cystic components, and 0.71 (SD, 0.40) for peritumoral edema, respectively. For DeepMedic, the mean Dice scores were 0.82 (SD, 0.16) for whole tumor; 0.66 (SD, 0.32) for enhancing tumor; 0.48 (SD, 0.27) for nonenhancing tumor; 0.48 (SD, 0.36) for cystic components, and 0.19 (SD, 0.33) for peritumoral edema, respectively. Dice scores were significantly higher for nnU-Net (P ≤ .01). Correlation coefficients for tumor subregion percentage volumes were higher (0.98 versus 0.91 for enhancing tumor, 0.97 versus 0.75 for nonenhancing tumor, 0.98 versus 0.80 for cystic components, 0.95 versus 0.33 for peritumoral edema in the internal test set). Bland-Altman plots were better for nnU-Net compared with DeepMedic. External validation of the trained nnU-Net model on the multi-institutional Brain Tumor Segmentation Challenge in Pediatrics (BraTS-PEDs) 2023 data set revealed high generalization capability in the segmentation of whole tumor, tumor core (a combination of enhancing tumor, nonenhancing tumor, and cystic components), and enhancing tumor with mean Dice scores of 0.87 (SD, 0.13) (median, 0.91), 0.83 (SD, 0.18) (median, 0.89), and 0.48 (SD, 0.38) (median, 0.58), respectively.
CONCLUSIONS: The pediatric-specific data-trained nnU-Net model is superior to DeepMedic for whole tumor and subregion segmentation of pediatric brain tumors.
ABBREVIATIONS:
- AI
- artificial intelligence
- BraTS
- Brain Tumor Segmentation Challenge
- CBTN
- Children’s Brain Tumor Network
- CC
- cystic component
- CNN
- convolutional neural network
- DMG/DIPG
- diffuse midline glioma/diffuse intrinsic pontine glioma
- ED
- edema
- ET
- enhancing tumor
- NET
- nonenhancing tumor
- TC
- tumor core
- WT
- whole tumor
SUMMARY
Previous Literature:
The research on automated segmentation of pediatric brain tumors remains sporadic, particularly in context of multi-institutional and multi-histology datasets, and with validation on independent test sets. Studies employing deep learning for the segmentation of whole lesion in pediatric brain tumors have documented Dice scores from 0.72 to 0.86. Only one study has reported on the segmentation of different tumor subregions, including enhancing tumor, nonenhancing tumor, cystic components, and edema, with Dice scores ranging between 0.35 and 0.74.
Key Findings:
Our automated tumor segmentation method by using nnU-Net demonstrates better performance in segmenting all subregions when compared with existing studies in the literature with high Dice scores of 0.90 for whole tumors, 0.77 for enhancing regions, and a combined score (0.82) for all nonenhancing areas.
Knowledge Advancement:
This developed model, which is available for public access, generates reliable results for segmentation of different tumor subregion across various histologies, validated with multi-institutional data.
Pediatric CNS tumors are the second most common childhood cancer and represent the most prevalent solid tumor and the leading cause of cancer-related mortality in children.1,2 These tumors encompass a wide range of histologies and display marked variations in their molecular origins, disease course, and response to therapy, which complicates the clinical decision-making process for their management.3 MR images are imperative to precisely locate, characterize, and monitor the treatment for these tumors. Achieving this precision relies heavily on accurate delineation and characterization of the whole tumor (WT) and tumor subcomponents. Quantitative measures of change in tumors are highly desirable for objective assessment of size and signal intensity, requiring visual and manual measurement of the tumors and tumor components. Accurate, automated tumor segmentation methods can offer rapid determination of tumor volumes with less effort and potentially more consistency than manual segmentation methods.
Manual delineation of brain tumors presents distinct obstacles that require specialized expertise, resources, and time.4 Moreover, there are distinct differences in the prevalence, appearance, histology, and behavior of pediatric brain tumors compared with adult brain tumors.1,5 The most common pediatric brain tumors include pilocytic astrocytoma, medulloblastoma, and other gliomas. In adults, the most common intracranial tumors are brain metastases and meningiomas, and the most common primary intra-axial brain tumors are glioblastoma.6 There is a higher prevalence of circumscribed gliomas in children compared with infiltrating gliomas that are commonly seen in adults.7 Necrosis is much more prevalent in adult brain tumors than in children, whereas tumoral cysts are more common in pediatrics.7 Contrast enhancement in adult brain tumors is more commonly associated with high-grade tumors, whereas a large proportion of low-grade pediatric tumors demonstrate contrast enhancement.8
The response assessment criteria for adult and pediatric brain tumors are also considerably different.9⇓-11 The differences have implications for brain tumor subregion segmentation. In adult brain tumor segmentations, typically nonenhancing tumor (NET) and edema are combined into a single subregion label, given the difficulty of separating these tissues and of common infiltrative adult brain tumors. Alternatively, NET and tumor necrosis may be combined into 1 label, though they are quite distinct on imaging. As a result of these differences, segmentation models trained on adult brain tumors may not be well-suited for segmentation of pediatric brain tumors, leading to under- or oversegmentation of tumor subregions.12 Thus, there is a relatively unmet need for training and validation of more accurate, pediatric-specific, brain tumor segmentation models with tumor subregion delineation.
Advancements in deep learning have broadened the potential applications of artificial intelligence (AI) in the field of medical imaging. In the context of brain tumors, 3D convolutional neural networks (CNNs) have gained widespread use in this field for image segmentation due to their ability to capture spatial features in 3D data, which is particularly relevant for brain MR imaging.13 Nevertheless, optimal use of CNNs for pediatric brain tumor segmentation remains inadequate.14 Distinctive characteristics of the pediatric brain as well as inherent limitations in available data sources present formidable challenges in the development of automated segmentation methods tailored to pediatric cases.15 Moreover, given the necessity for AI systems to undergo specific training and validation for each distinct application, it is evident that focused research endeavors within the pediatric demographic are essential for optimal application of AI in segmenting pediatric brain tumors.
Recent advancements in CNN structures like ShuffleNet (https://arxiv.org/abs/1707.01083), ResNet (https://www.ncbi.nlm.nih.gov/pmc/articles/PMC7711146/), and DenseNet (https://www.ncbi.nlm.nih.gov/pmc/articles/PMC8300985/) have shown promising results in various image analysis tasks, including adult brain tumor segmentation.16,17 U-Net, a CNN based on an encoder-decoder architecture, has become popular for medical image segmentation, showing superior performance in small data sets with a limited number of scans.18,19 Thus, U-Net and its derivatives are potentially helpful for segmentation of pediatric brain tumors. A few studies have used U-Net models to improve segmentation performance on types of pediatric brain tumors, yielding good agreement between predicted and manual segmentations.20,21 Nevertheless, there is a paucity of available highly accurate deep learning models that can be used for pediatric brain tumor segmentation across a wide range of tumor pathologies.
In this article, we investigate 2 innovative, 3D deep learning segmentation architectures that have been successfully applied in adult brain tumor segmentations, namely DeepMedic (https://deepmedic.org/) and nnU-Net models (https://www.nature.com/articles/s41592-020-01008-z).22,23 DeepMedic is a multilayered, multiscale, 3D deep CNN architecture coupled with a 3D fully connected conditional random field,22 showing excellent performance in adult brain tumors, notably in the 2017 BraTS Challenge by the Medical Image Computing and Computer Assisted Interventions (MICCAI) organization (https://arxiv.org/html/2305.17033v6). nnU-Net, a self-configuring model for biomedical image segmentation, excels in various applications,23 including The Brain Tumor Segmentation (BraTS) 2020 multiorgan segmentation challenge. nnU-Net extends the original U-Net design with an automated end-to-end pipeline, selecting the optimal configuration for diverse segmentation tasks. Our objective was to harness an extensive collection of multi-institutional ground truth segmentations to train these 2 models on carefully curated, pediatric-specific data and compare the performance for automated pediatric brain tumor subregion segmentation across a wide spectrum of tumor types. We hypothesized that the nnU-NET segmentation model would perform better than DeepMedic.
MATERIALS AND METHODS
Data Description and Patient Cohort
This was a Health Insurance Portability and Accountability Act–compliant, institutional review board (Children’s Hospital of Philadelphia)–approved study of previously acquired multi-institutional data from the subjects enrolled onto the Children’s Brain Tumor Network (CBTN) consortium (https://cbtn.org).24 MR imaging examinations of pediatric patients with histologically confirmed brain tumors from the CBTN consortium were retrospectively collected. Inclusion criteria were the availability of preoperative brain MR imaging comprising 4 conventional MR imaging sequences, ie, precontrast T1WI, T2WI, T2 FLAIR, and gadolinium postcontrast T1WI sequences, all acquired as a part of standard-of-care clinical imaging evaluation for brain tumors. Patients were still included if the only procedure was placement of an external ventricular drain or needle biopsy. Patients were excluded if the images were incomplete or if they were severely degraded by artifacts. Internal site data were from the Children’s Hospital of Philadelphia, and external data were from other consortium members of the CBTN. A total of 339 patients (293 from the internal site, 46 from the external sites) were included in this study. Detailed descriptions of the patients, tumor types, and MR image characteristics are included in Table 1 and the Online Supplemental Data. We also used another independent data set (n = 92) from Brain Tumor Segmentation Challenge in Pediatrics (BraTS-PEDs) data set, for the purpose of benchmarking our best performing model (See “Benchmarking Our Model in the BraTS-PEDs Context” for more details). We report a level 5A efficacy for our study.
Characteristics of patients, tumor histology, and MR imaging scanners in internal and external patient cohorts
Details about image preparation, preprocessing, and tumor subregion segmentation can be found in the Online Supplemental Data. Tumors were segmented into 4 subregions,12 including enhancing tumor (ET), NET, cystic component (CC), and edema (ED). WT segmentation masks were generated by the union of all 4 tumor components (ie, WT = ET + NET + CC + ED). Tumor core (TC) was defined as a combination of ET, NET, and CC.25
Model Training and Validation
We trained and evaluated two 3D convolutional neural networks, DeepMedic and nnU-Net, for automated tumor subregion segmentation on multiparametric MR imaging sequences of 233 subjects from the internal cohort and tested them on withheld sets of 60 internal and 46 external subjects from the CBTN. nnU-Net v1 (https://github.com/MIC-DKFZ/nnUNet/tree/nnunetv1) with 5-fold cross-validation was trained with an initial learning rate of 0.0, stochastic gradient descent with Nesterov momentum (μ = 0.99), and number of epochs =1000 × 250 minibatches. Because the DeepMedic approach does not inherently include cross-validation, a validation set comprising 20% of the 293 training subjects (n = 47) was randomly selected. DeepMedic, Version 0.8.4 (https://github.com/deepmedic/deepmedic), was trained from scratch with a learning rate = 0.001, number of epochs = 35, and batch size = 10.
Benchmarking Our Model in the BraTS-PEDs Context
We extended the validation of our best-performing model (based on the results on internal and external data sets) to include the latest benchmarks in automated tumor segmentation, specifically focusing on the multi-institutional data set provided through the BraTS-PEDs 2023 data set.25,26 Our analysis involved applying the best model to a cohort of 92 pediatric subjects diagnosed with high-grade gliomas, which include astrocytoma and diffuse midline glioma/diffuse intrinsic pontine glioma (DMG/DIPG).25
The evaluation of the performance of our model was conducted in alignment with the BraTS-PEDs validation criteria,25 which focus on the segmentation of ET, TC, and the WT. The TC region encompasses the ET, NET, and CC regions.
Code Availability
All image-processing tools used in this study are freely available for public use (CaPTk, https://www.cbica.upenn.edu/captk; ITK-SNAP, http://www.itksnap.org/). The pretrained nnUNet tumor segmentation model is publicly available on GitHub (https://github.com/d3b-center/peds-brain-auto-seg-public). It is also a software plug-in (“gear”) on the Flywheel platform (https://flywheel.io/) and can be found by searching “Pediatric Brain Automated Segmentation” in the Flywheel Gear Exchange library (https://flywheel.io/gear-exchange/).
Statistical Methods
The performance of the DeepMedic and nnU-Net models with respect to the expert manual ground truth segmentations was evaluated using several evaluation metrics, including the Dice score (Sørensen-Dice similarity coefficient), sensitivity, and 95% Hausdorff distance. We assessed segmentation of the WT, ET, NET, CC, and ED subregions along with the nonenhancing component/edema, which encompassed the combination of NET, CC, and ED. A paired t test was used for comparison of Dice scores between the 2 automated segmentation methods. The comparison between the predicted and expert tumor segmentations was further analyzed by measuring a selection of semantic radiomic features, namely Visually AcceSAble Rembrandt Images (VASARI) features (https://wiki.cancerimagingarchive.net/display/Public/VASARI+Research+Project), which have been extensively used in the studies on the diagnosis and prognosis of brain tumors.27,28 We calculated the proportion of the WT volume, that is ET, NET, CC, or ED, for the nnU-Net and DeepMedic models and compared them with the values obtained using expert segmentations by using Pearson or Spearman correlation coefficients, depending on the data distribution, the Bland-Altman method, and Mann-Whitney U test.
RESULTS
The Dice score, sensitivity, and 95% Hausdorf distance metrics of the nnU-Net and DeepMedic deep learning models compared with manual ground truth segmentations are shown in Table 2 and the Online Supplemental Data. The Online Supplemental Data show the breakdown across different histologies. Median values are included in addition to means (SDs) because a discrepancy in the mere absence or presence of even a small tumor subregion label in one of the model-pair comparisons may tremendously affect the metrics for a particular subject and disproportionately affect the mean (eg, result in a calculated Dice score of 0). Additionally, the distribution of the internal and external test set Dice scores of WT and tumor subregions for the 2 models is shown with violin plots in Fig 1 (The Online Supplemental Data show the breakdown across different histologies). The distribution of Dice scores in WT and across all tumor subregions was more favorable for nnU-Net compared with DeepMedic, with a tighter distribution toward higher Dice scores (Table 2). Both models performed worse in ED segmentation compared with other tumor subregions, but even here the nnU-Net performed much better than DeepMedic (P < .001 and P = .003 for internal and external sets, respectively), which had rather poor results for ED delineation (Dice score = 0.19 and 0.21 for internal and external test subjects, respectively). Paired t test comparison of Dice scores between the 2 automated segmentation methods demonstrated higher nnU-Net Dice scores compared with DeepMedic for ET segmentation in the internal test set mean Dice score: 0.77 (SD, 0.29) (median, 0.86) versus 0.66 (SD, 0.32) (median, 0.75) (P = .01), and similarly for WT and all other tumor subregions in both the internal and external test sets (P < .001).

Violin plots demonstrating the distribution of Dice scores for nnU-Net and DeepMedic segmentation compared with ground truth for both internal and external test sets. A, WT. B, ET. C, NET. D, CC. E, ED. F, All NETs (NET + CC + ED).
Results comparing the performance metrics of nnU-Net versus DeepMedic architectures for WT and tumor component segmentations compared with the manual ground truth in terms of Dice score metric
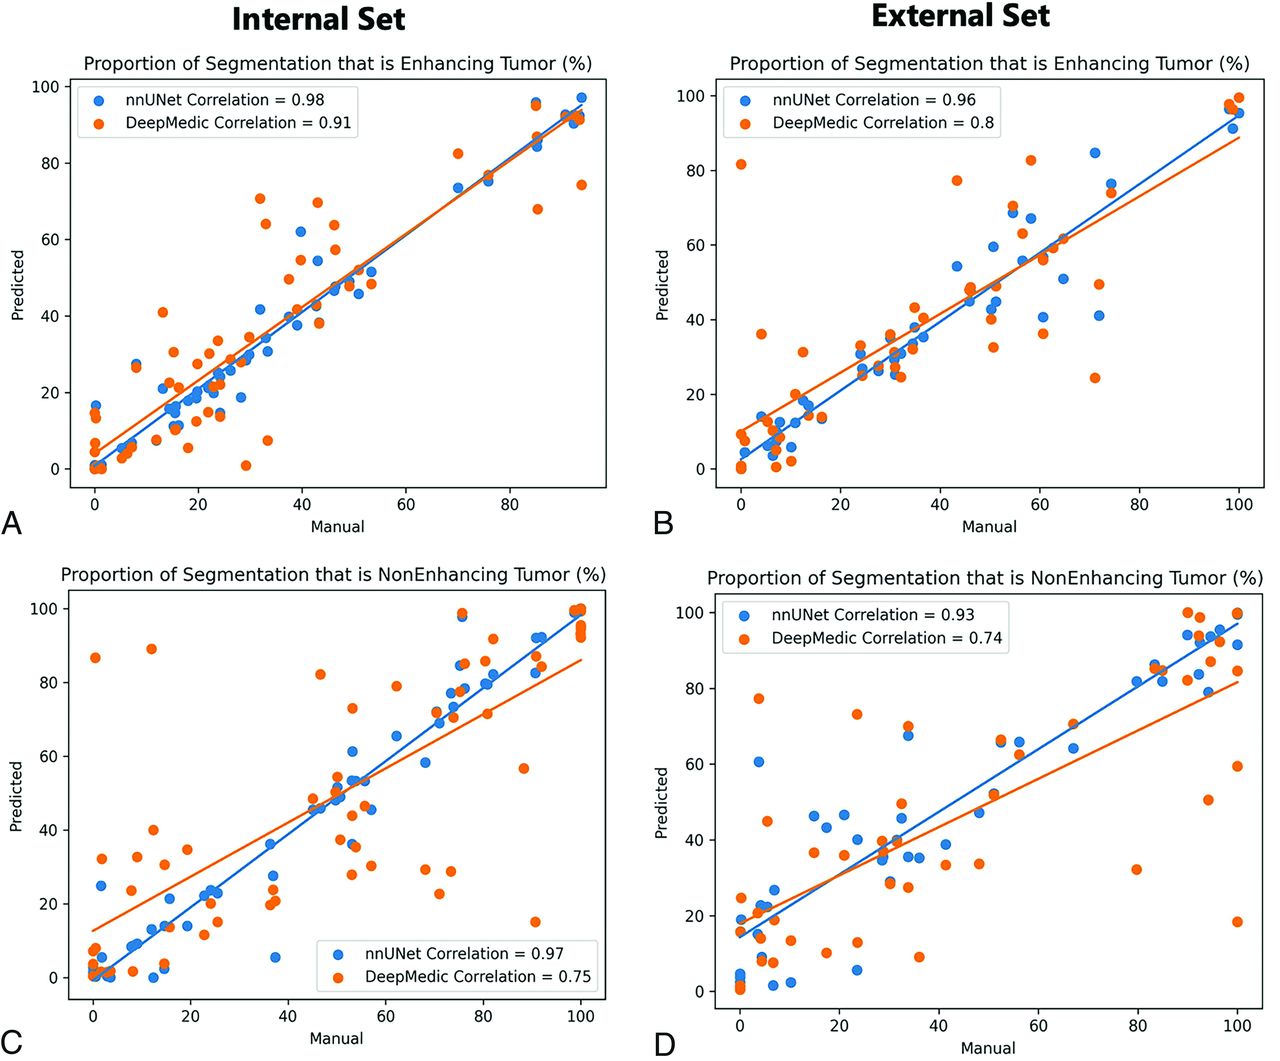
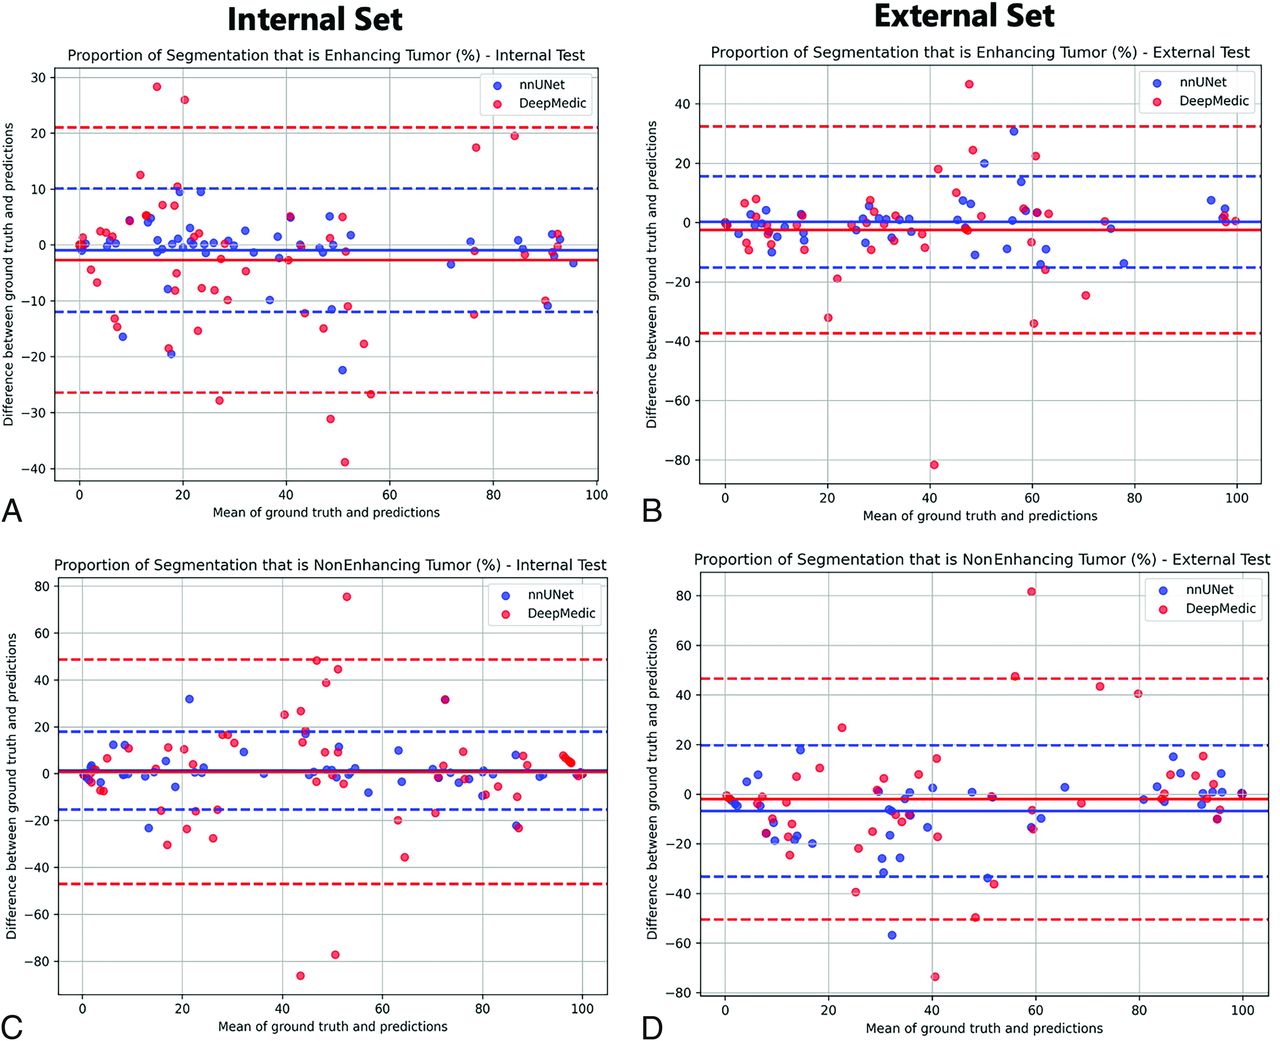
Correlation between the volume percentages of tumor subregion segmentation compared with the ground truth for nnU-Net and DeepMedic models are shown in Fig 2 and the Online Supplemental Data. All correlation coefficient P values were <.001, but again the lowest correlations were seen with DeepMedic ED determination, with r = 0.48 and r = 0.33 for internal and external test subjects, respectively. All nnU-Net percentage volume correlation coefficients were close to or above r = 0.9. Furthermore, the Bland-Altman assessment of agreement between the methods showed tighter 95% intervals for nnU-Net compared with the ground truth as opposed to DeepMedic (Fig 3 and the Online Supplemental Data).

Scatterplots of the correlations between ground truth and automated tumor subregion volume percentages from nnU-Net and DeepMedic for internal and external test sets. A and C, Proportion of tumor that is labeled enhancing, B and D, Proportion of tumor that is labeled NET.

Bland-Altman analysis plots demonstrating the agreement between ground truth and automated tumor subregion volumes/percentages from nnU-Net and DeepMedic for internal and external test sets. A and C, Proportion of tumor that is labeled enhancing. B and D, Proportion of tumor that is labeled NET.
Finally, the results of the Mann-Whitney U test comparing tumor subregions as a proportion of WT in nnU-Net and DeepMedic segmentations compared with ground truth segmentation are shown in the Online Supplemental Data. ED segmentation proportions determined by DeepMedic were statistically different from the ground truth for the internal test subjects. For the internal test subjects, the DeepMedic model was significantly different from ground truth in the proportion of ED with respect to the WT (P value = .003).
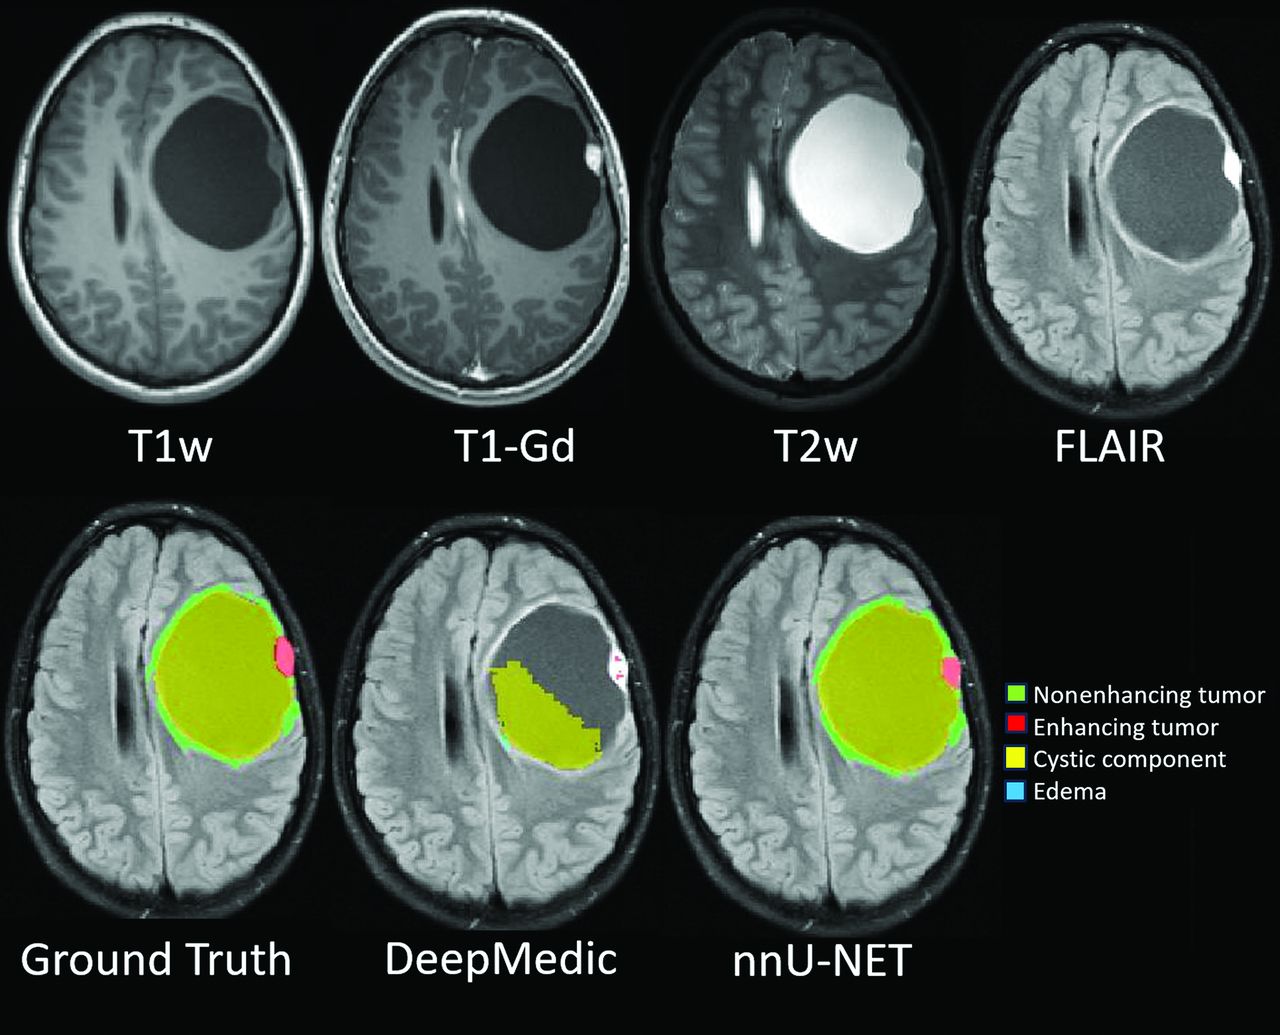
Sample MR images with results comparing ground truth segmentation with nnU-Net and DeepMedic models are shown in Fig 4 and the Online Supplemental Data.

Sample comparison images of ground truth and predicted segmentation from nnU-Net and DeepMedic in a predominantly cystic supratentorial mass with a solid enhancing nodule. While nnU-Net has near-perfect agreement with the ground truth, DeepMedic failed to delineate most of the large cyst, enhancing nodule, and nonenhancing rim. T1w indicates T1-weighted; T1-GD, T1-gadolinium.
Because the nnU-Net-based autosegmentation model performed better than the DeepMedic model on our withheld internal and external sets, we applied it to the multi-institutional BraTS-PEDs 2023 data set (Table 3). This model indicates a high degree of generalizability in segmenting both the WT and the tumor core region mean Dice scores of 0.87 (SD, 0.13) (median, 0.91) and 0.83 (SD, 0.18) (median, 0.89), respectively. However, a comparatively lower performance in segmenting the ET region was a mean Dice score of 0.48 (SD, 0.38) (median, 0.58).
Results on the performance of our trained autosegmentation model using nnU-Net architecture on multi-institutional BraTS-PEDs 2023 data (n = 92)a
DISCUSSION
DeepMedic22 has been effective in pediatric tumor subregion segmentation12 and has outperformed technicians in brain tumor segmentation on a multi-institutional MR imaging database, as validated by neuroradiologists.29 Its multiscale, parallel-processing approach captures comprehensive contextual information. Using feature maps from its final convolutional layer, DeepMedic efficiently predicts voxel labels in input patches.30 However, its focus on high-level semantic information may limit its performance.30
nnU-NET23,31 has also been successfully applied in automated segmentation of brain metastases and specific tumors such as craniopharyngiomas32 or meningiomas.33 On the basis of the U-Net structure, it combines encoding with downsampling and decoding with upsampling. U-Net introduces multilevel information gradually, from encoding to decoding, to optimize prediction accuracy.
Leveraging accurate automated methods can greatly facilitate the rapid delineation of structures and potentially decrease variability. To this end, we leveraged a carefully curated manual segmentation data set of pediatric brain tumors and trained nnU-Net and DeepMedic models. nnU-Net showed high Dice scores, sensitivity, and 95% Hausdorff distance metrics compared with DeepMedic. The distribution scale of Dice scores was also tighter with less variability across subjects for WT and all tumor subregions, resulting in statistically significant higher Dice scores for nnU-Net. Additionally, for a more practical evaluation, volume percentages (proportions) of tumor subregions with respect to the WT were also evaluated using core relational analysis and Bland-Altman plots, which again showed higher correlation and agreement of nnU-Net with the manual ground truth. nnU-Net achieved high Dice scores of 0.90 and 0.77 for WT and ET regions, respectively, though the Dice scores for NET (0.66), CC (0.71), and ED (0.71) were lower. The Dice score (0.82) on a combination of all the nonenhancing areas (NET + CC + ED) was higher than in these individual subregions. Our model demonstrates better performance in segmenting all subregions compared with existing studies in the literature. Other research using deep learning for the segmentation of the WT region in pediatric brain tumors has documented Dice scores from 0.72 to 0.86 across studies.12,20,21,34⇓-36 Only a limited number of studies focus on the segmentation of ET, with Dice scores of 0.68,12 0.72,20 and 0.83.35 The highest Dice score of 0.83 in one of these studies35 was achieved through cross-validation instead of evaluation on an independent test set. Only 1 study has reported the segmentation of NET, CC, and ED subregions, with Dice scores ranging between 0.35 and 0.51 and a Dice score of 0.73 for a combination of all nonenhancing regions.12
Our results of Dice score values for both models performed worse in delineation of ED, and this outcome was particularly problematic for DeepMedic. Even though a smaller proportion of pediatric brain tumors are infiltrative compared with adult brain tumors, nevertheless, the ever-present challenge of separating ED from NET persists to some degree. Overall, both models performed slightly worse on the external test cohort than on the internal test set. This result was expected to some degree because the external test set was from multiple institutions with a wider variability of MR imaging acquisition protocols.
This study demonstrates the feasibility of achieving accurate pediatric brain tumor subregion segmentation results on the basis of multiparametric, multiscanner, multihistology, and multi-institutional clinical standard-of care MR imaging scans. In some cases, manual evaluation and revision may still be required to refine the segmentations, but nevertheless, the time and effort burden will be substantially less using an accurate, automated, segmentation software.
Our study has several advantages. The MR imaging examinations were performed as clinical standard-of-care scans without a predetermined universal research imaging protocol. The imaging was performed using various vendors and models of MR imaging scanners as well as on different field-strength magnets. These features help with increasing the generalizability of the segmentation model results. The ground truth manual segmentations were also performed in a rigorous fashion through multiple iterations to ensure high-quality ground truth labeling. As evident from the results of our study, segmentation evaluation studies generally benefit from training with larger data sets, and this benefit is true for our study as well. Increasing the sample size may be particularly helpful in improving segmentation performance for external multi-institutional data in which there is wider variability and scan protocols that can contribute to suboptimal performance for some tumor subregions.
The effectiveness of our approach is evidenced by the high Dice scores obtained for segmenting both the WT and tumor core components using the multi-institutional BraTS-PEDs 2023 data set. However, the lower performance in segmenting the ET region with the mean Dice score = 0.48 (SD, 0.38) (median, 0.58) can be attributed to the low prevalence of this subregion in subjects with DMG/DIPG tumors in the BraTS-PEDs data set. Additionally, our original training cohort included a limited number of high-grade gliomas (including DMG/DIPG histology), which may have contributed to this reduced performance in the ET region. Incorporating the additional BraTS-PEDs 2023 data set into the training data for our future autosegmentation models is a logical step to address this issue. This would likely enhance the generalizability of the model, particularly for the tumors with rare histology in multi-institutional cohorts.
No segmentation performance metric is optimal, exemplified by the limitations of the Dice score, as demonstrated in this study. Specifically, if a model fails to segment a certain label, the Dice score for that label will be equal to 0. This zero score considerably influences the aggregate Dice score for that label across all samples. Furthermore, if the data set contains a limited number of samples with that particular label, the aggregate score may not accurately reflect the overall performance trend of the model. As a result, we used multiple performance metrics and included tumor subregion proportion comparisons as well for a more practical and comprehensive evaluation of the segmentation results.
CONCLUSIONS
We present the results from automated deep learning–based pediatric brain tumor subregion segmentation models from 2 different segmentation models, nnU-Net and DeepMedic. nnU-Net achieved excellent results for WT and ET segmentation and decent results for the nonenhancing components including ET, CC, and peritumoral edema.
Footnotes
This research was supported by grant funding from the diffuse intrinsic pontine glioma/diffuse midline glioma Research Funding Alliance and Pediatric Brain Tumor Foundation.
Disclosure forms provided by the authors are available with the full text and PDF of this article at www.ajnr.org.
References
- Received January 5, 2024.
- Accepted after revision March 1, 2024.
- © 2024 by American Journal of Neuroradiology


